Analysis of the Fixed Asset Turnover Trend of Muyuan Foods Co., Ltd. (002714.SZ)
Unlock More Features
Login to access AI-powered analysis, deep research reports and more advanced features
About us: Ginlix AI is the AI Investment Copilot powered by real data, bridging advanced AI with professional financial databases to provide verifiable, truth-based answers. Please use the chat box below to ask any financial question.
Related Stocks
Based on the collected financial data, I will provide you with a detailed analysis of the fixed asset turnover trend of Muyuan Foods Co., Ltd. over the past five years.
| Year | Operating Revenue (CNY 100 million) | Fixed Assets (CNY 100 million) | Fixed Asset Turnover | YoY Change | Industry Average | Gap vs. Industry |
|---|---|---|---|---|---|---|
| 2020 | 562.77 | 485.23 | 1.16 |
- | 0.85 | +0.31 |
| 2021 | 788.90 | 1106.54 | 0.71 |
-38.53% | 0.92 | -0.21 |
| 2022 | 1248.26 | 1063.59 | 1.17 |
+64.62% | 1.05 | +0.12 |
| 2023 | 1108.61 | 1121.50 | 0.99 |
-15.77% | 0.88 | +0.11 |
| 2024 | 1379.47 | 1067.51 | 1.29 |
+30.73% | 1.15 | +0.14 |
The fixed asset turnover of Muyuan Foods Co., Ltd. rose from
-
2020-2021 Decline Period: The turnover rate dropped from 1.16 to 0.71, a decrease of 38.53%. The main reason was the company’s large-scale capacity expansion: fixed asset investment surged from CNY 48.5 billion to CNY 110.65 billion, an increase of over 128%, while operating revenue only grew by 40% during the same period, leading to temporary overcapacity [2].
-
2022-2024 Recovery and Upward Period: As new production capacity was gradually put into operation and generated benefits, the turnover rate rebounded sharply. It reached1.29in 2024, hitting a five-year high, mainly benefiting from:
- Continuous decline in breeding costs (total cost reached CNY 13/kg)
- Recovery in hog prices
- Improvement in capacity utilization
The fixed asset turnover of Muyuan Foods Co., Ltd.
- 2020: 0.31 higher than the industry average
- 2022: 0.12 higher than the industry average
- 2024: 0.14 higher than the industry average
| Indicator | Value | Analysis |
|---|---|---|
| Average Turnover Rate | 1.07 |
Higher than the industry average |
| Highest Value | 1.29 (2024) |
Capacity utilization efficiency reaches optimal level |
| Lowest Value | 0.71 (2021) |
Trough during capacity expansion period |
| Fluctuation Range | 0.58 |
Obvious cyclical characteristics |
-
Positive Factors:
- The turnover rate hit a record high in 2024, indicating continuous improvement in the company’s capacity efficiency
- The scale of fixed assets has stabilized (approximately CNY 106.7 billion), and capital expenditure has slowed down, implying improved asset utilization
- Operating cash flow has improved significantly, with net operating cash flow reaching CNY 29.178 billion in 2024 Q1-Q3 [3]
-
Risk Factors:
- Cyclical fluctuations in the hog breeding industry will still affect revenue, thereby impacting the turnover rate
- If hog prices decline, it may lead to a drop in revenue and a pullback in the turnover rate
-
Long-term Outlook:
- With the deepening of the company’s “full industry chain integration” model, the fixed asset turnover rate is expected to remain at a high level
- The development of the slaughtering and meat products segment is expected to further improve asset utilization efficiency
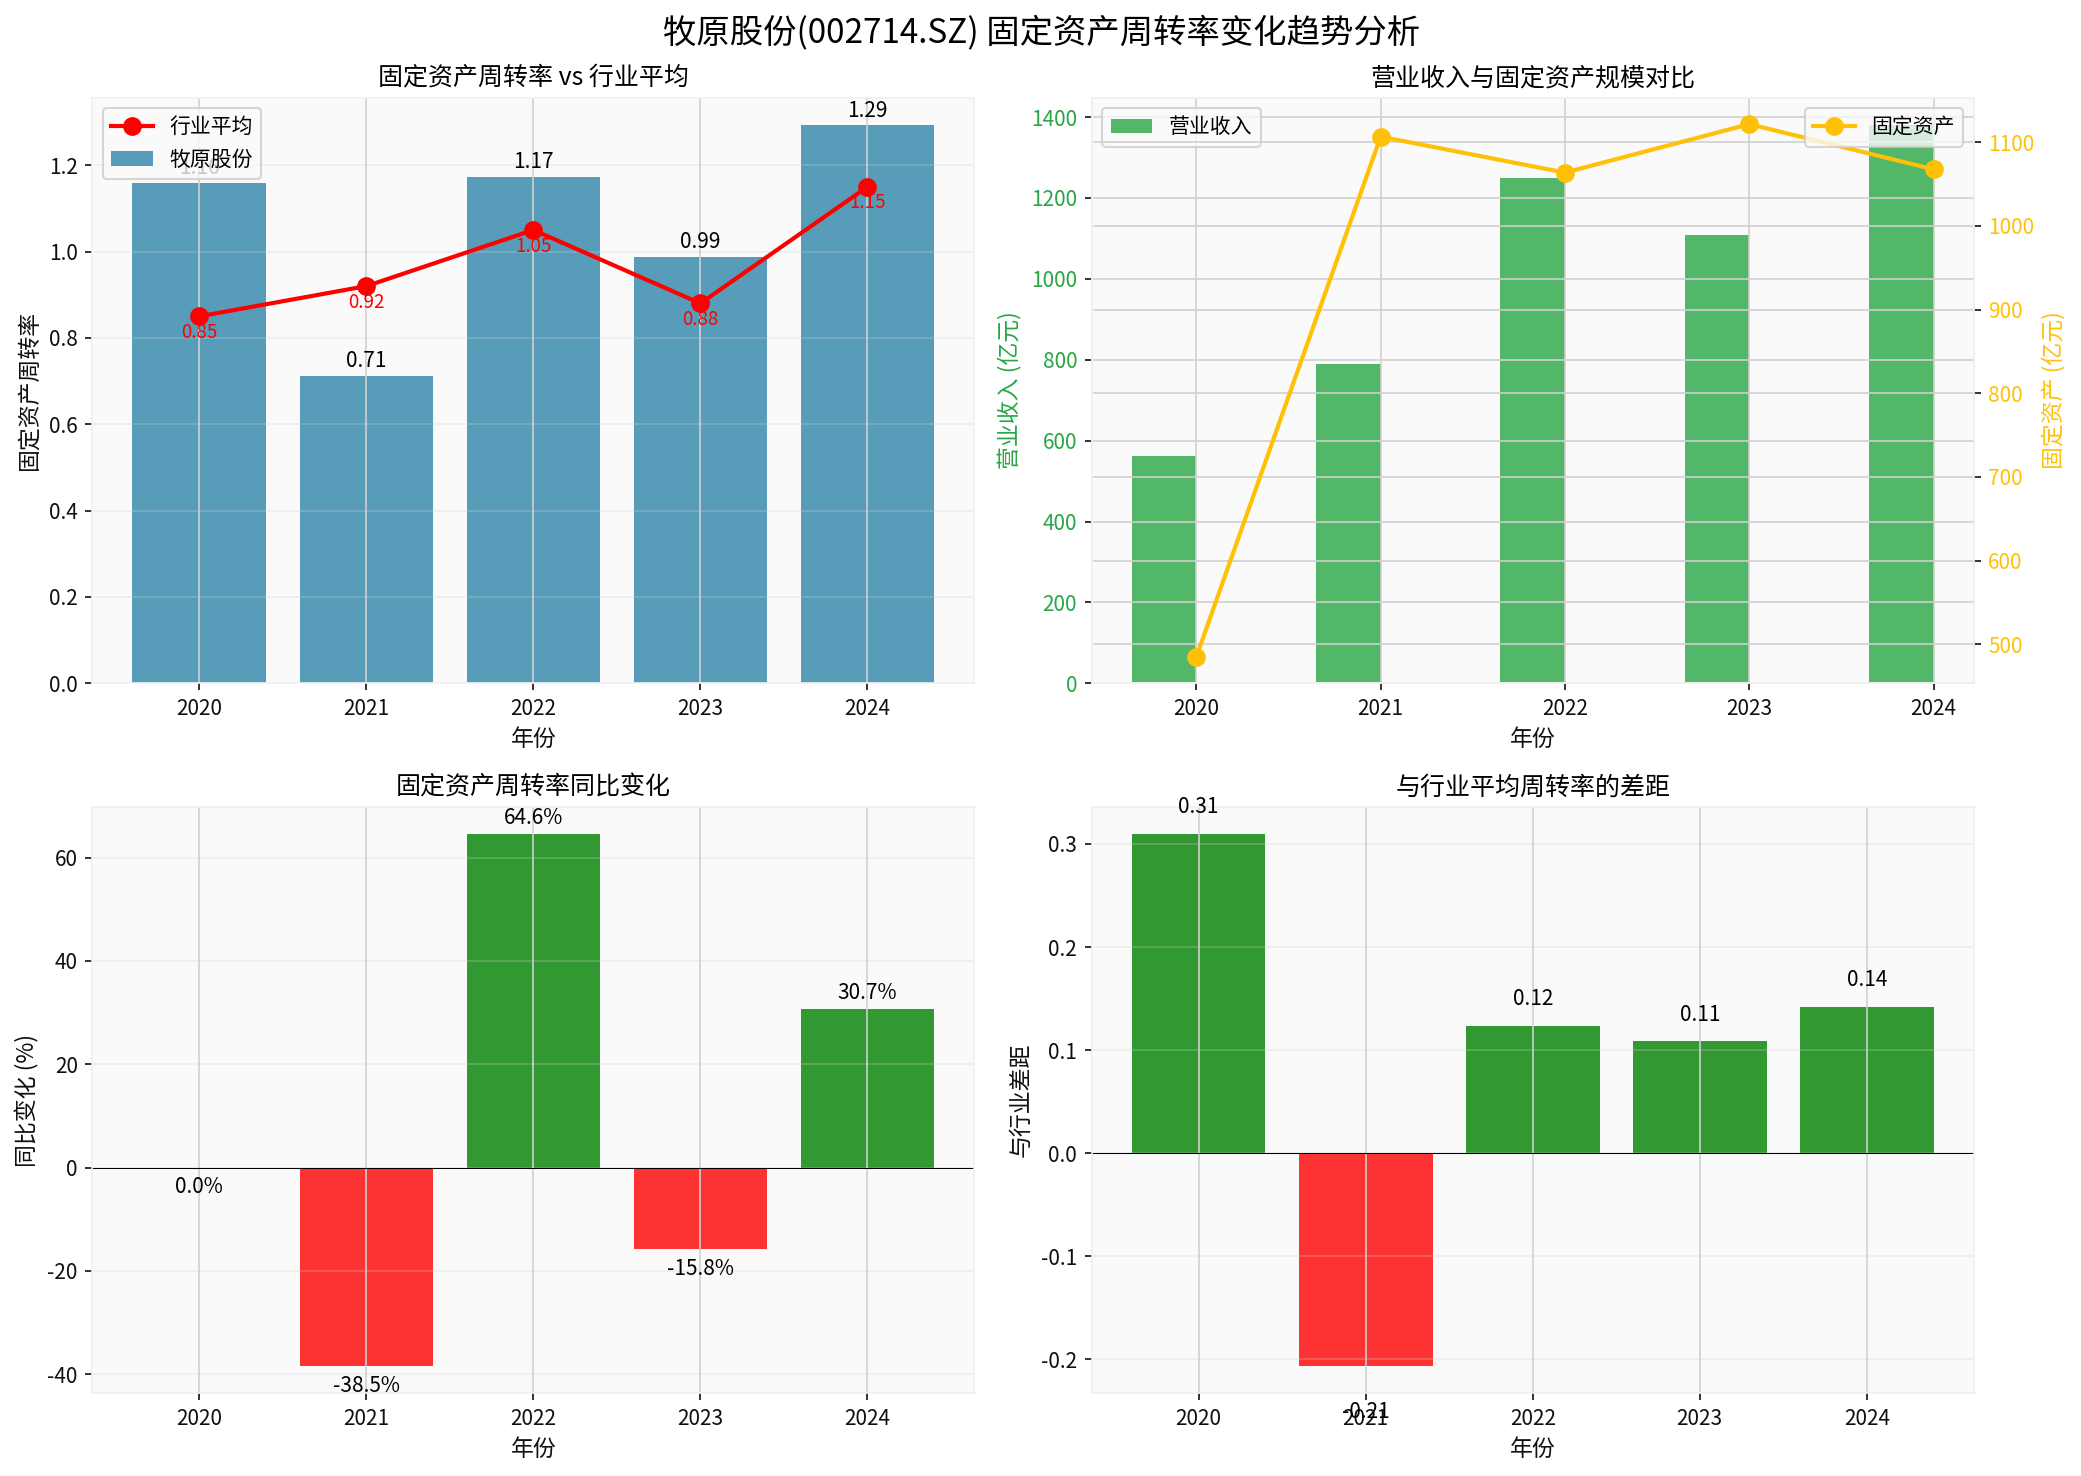
Chart Notes:
- Top Left: Comparison of fixed asset turnover and industry average, showing that Muyuan Foods Co., Ltd. outperforms the industry overall
- Top Right: Changes in operating revenue and fixed asset scale, fixed assets stabilized after 2021
- Bottom Left: YoY change in turnover rate, strong rebound in 2022
- Bottom Right: Gap vs. industry average, maintained a positive gap in most years
[1] Eastmoney - Muyuan Foods Co., Ltd. Financial Data (https://data.eastmoney.com/stockdata/002714.html)
[2] AVIC Securities Research Institute - Review of Muyuan Foods Co., Ltd.'s 2021 Annual Report and 2022 Q1 Report (https://pdf.dfcfw.com/pdf/H3_AP202205011562733767_1.pdf)
[3] Guosen Securities - Investment Research Report on Muyuan Foods Co., Ltd. (https://pdf.dfcfw.com/pdf/H3_AP202411031640688705_1.pdf)
Insights are generated using AI models and historical data for informational purposes only. They do not constitute investment advice or recommendations. Past performance is not indicative of future results.
About us: Ginlix AI is the AI Investment Copilot powered by real data, bridging advanced AI with professional financial databases to provide verifiable, truth-based answers. Please use the chat box below to ask any financial question.