In-Depth Analysis of the Significance of Large-Scale Net Outflows in Broad-Based Index ETFs
Unlock More Features
Login to access AI-powered analysis, deep research reports and more advanced features
About us: Ginlix AI is the AI Investment Copilot powered by real data, bridging advanced AI with professional financial databases to provide verifiable, truth-based answers. Please use the chat box below to ask any financial question.
I will now provide you with a systematic and comprehensive analysis report:
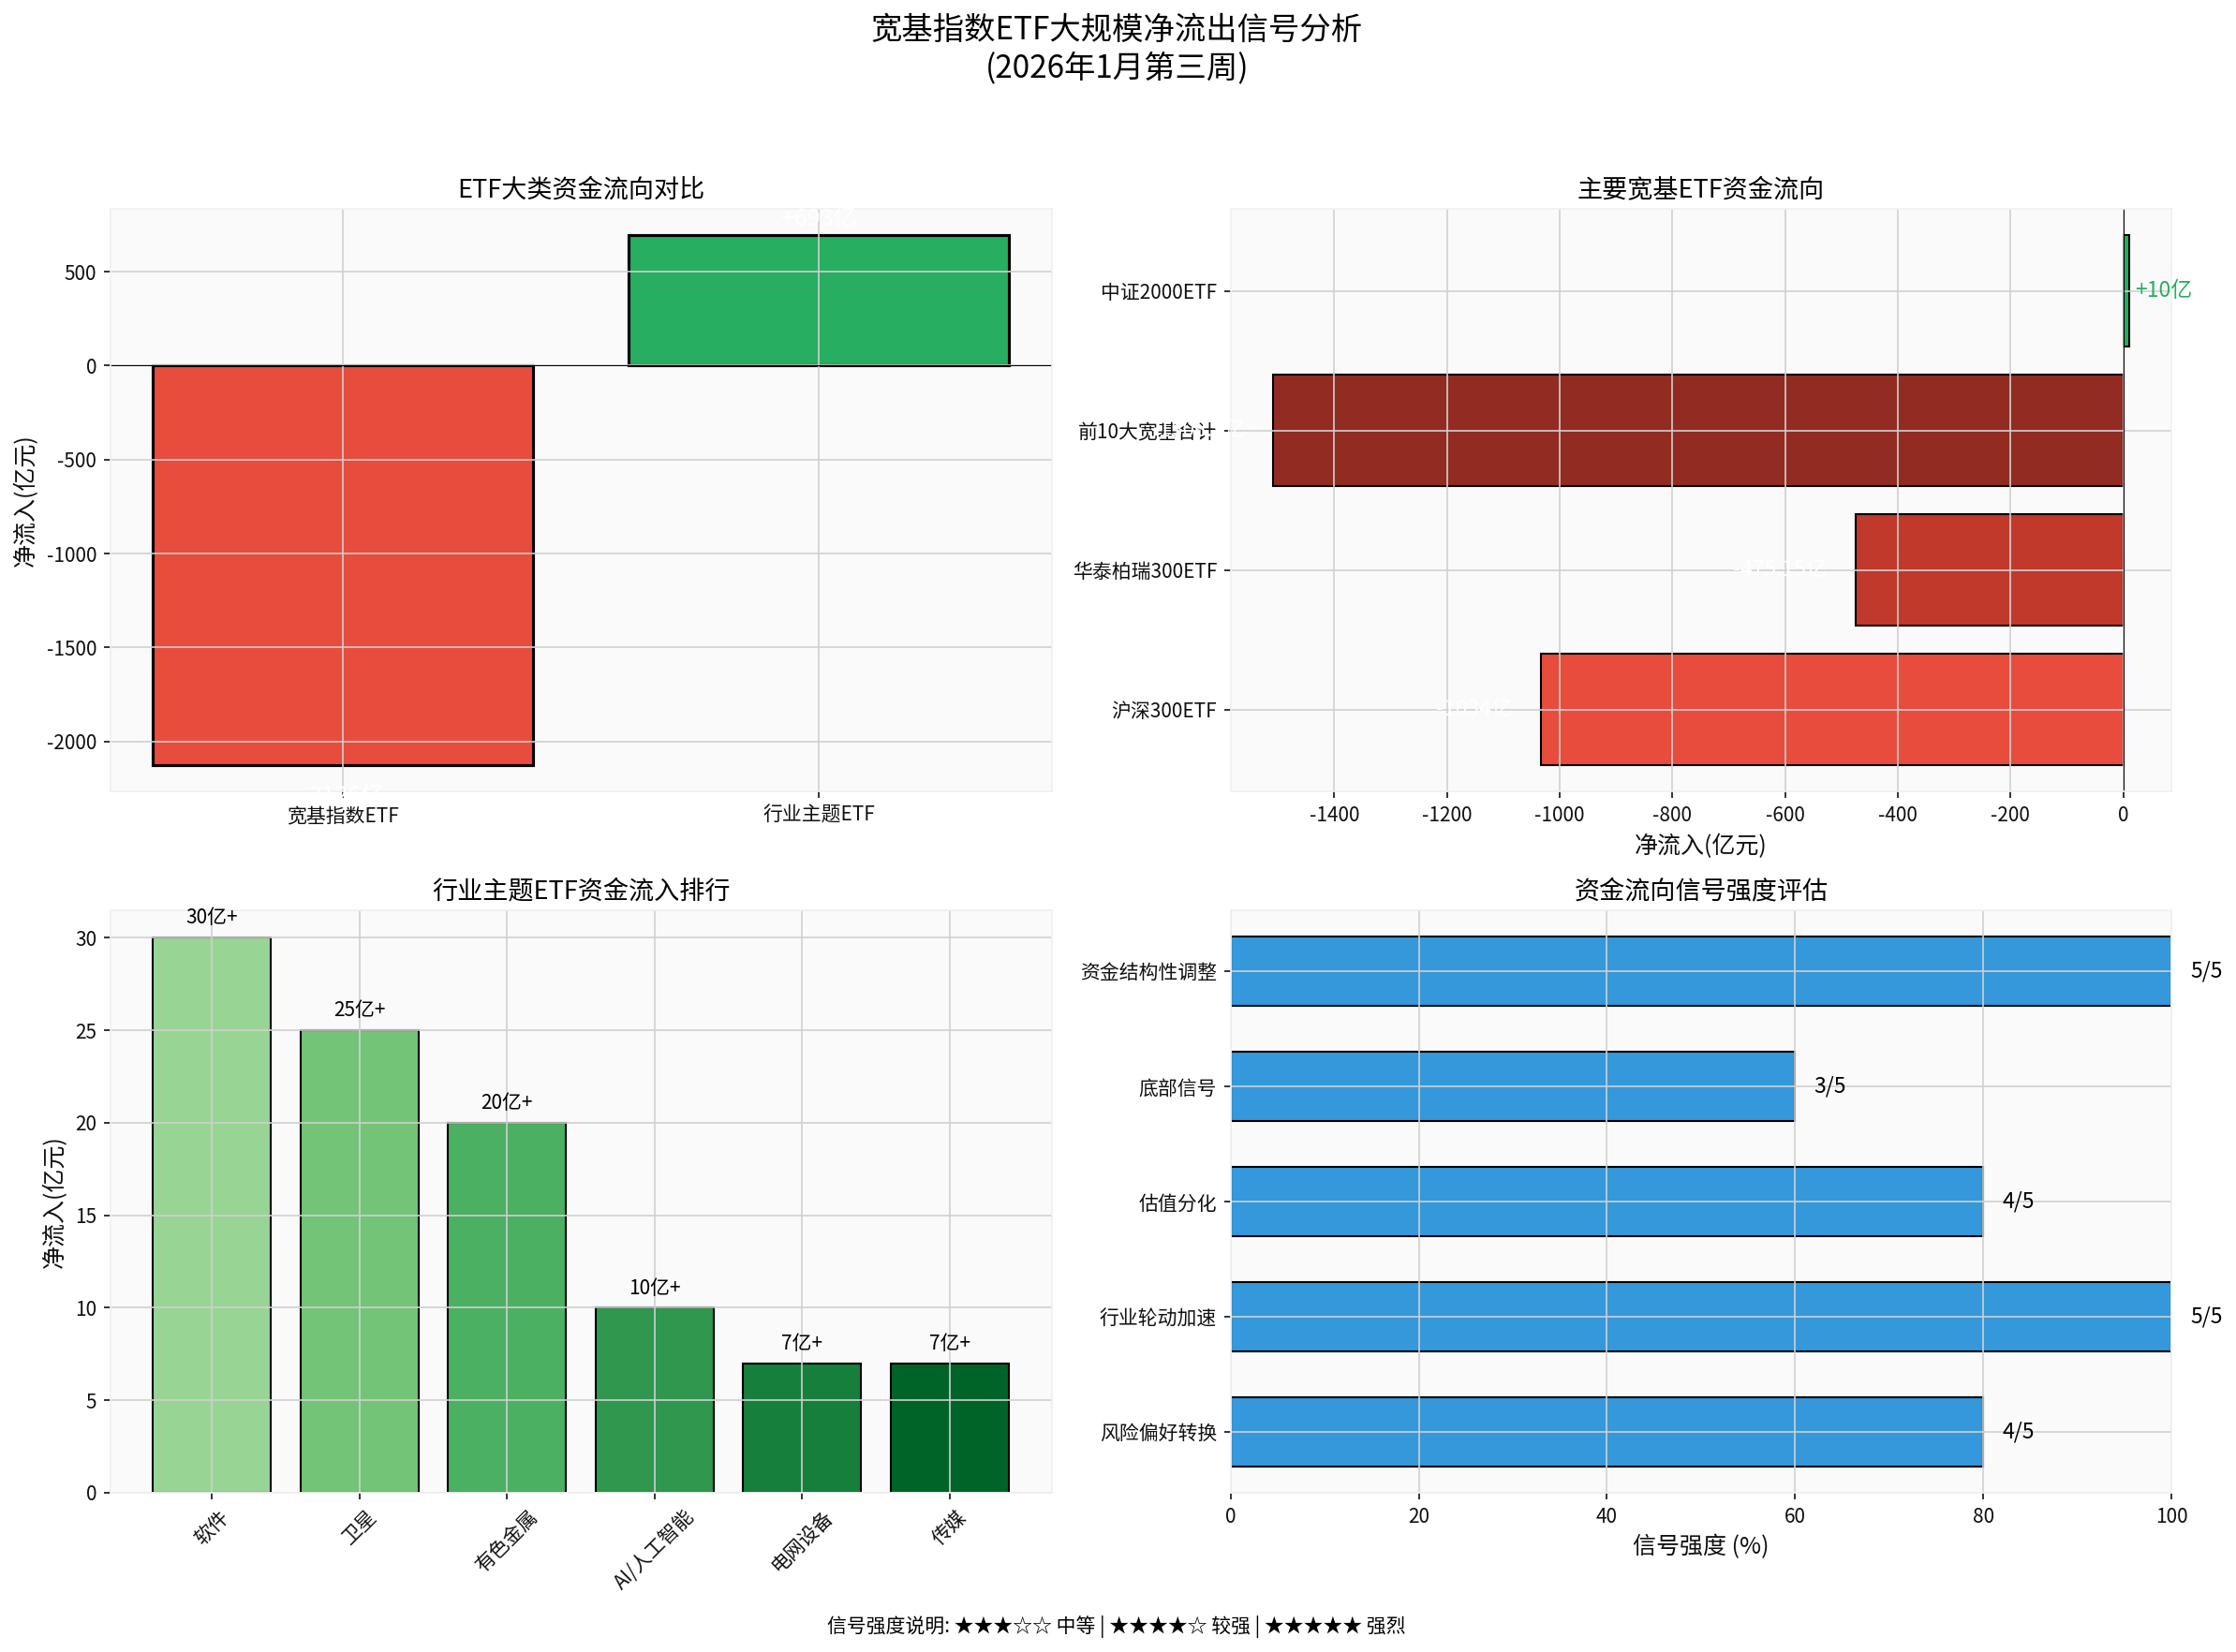
This week (the third week of January 2026), the capital flow of ETFs in the A-share market presents a significant structural differentiation pattern. According to statistics from Wind, the combined net outflow of equity ETFs and cross-border ETFs in the Shanghai and Shenzhen stock exchanges reached
| Capital Flow Category | Net Inflow (RMB 100 million) | Flow Nature |
|---|---|---|
| Broad-Based Index ETF | -2126 |
Large-Scale Withdrawal |
| Industry-Themed ETF | +693 |
Counter-Trend Inflow |
| CSI 300 ETF | -1034 |
Main Force Withdrawal |
| HuaTai-PineBridge CSI 300 ETF | -475.15 |
Largest Single Withdrawal |
| Top 10 Broad-Based ETFs (Total) | -1508.5 |
Concentrated Withdrawal |
| CSI 2000 ETF | Slight Inflow |
Only Inflowing Category |
- Broad-Based ETF Outflow / Industry ETF Inflow Ratio: 3.07:1
- CSI 300 ETF Outflow as a Percentage of Total Broad-Based ETF Outflows: 48.6%
- HuaTai-PineBridge CSI 300 ETF Single Outflow as a Percentage of Broad-Based ETF Outflows: 22.3%[0][1]
Institutional investors show a clear decline in short-term risk appetite for large-cap blue chips. As the most representative large-cap blue chip index ETF in the A-share market, the CSI 300 ETF saw a weekly net outflow exceeding RMB 100 billion, accounting for nearly half of the total outflow of broad-based ETFs, reflecting main force capital concerns about the following factors:
- Valuation Pullback Pressure: Large-cap blue chips have seen significant gains in the early stage, facing technical pullback demands
- Upcoming Performance Verification Period: The window for annual report performance forecasts has opened, and stocks with weak fundamental support are under pressure
- Relative Profit Lock-In: Some institutions choose to realize profits and shift to more flexible growth tracks [1][2]
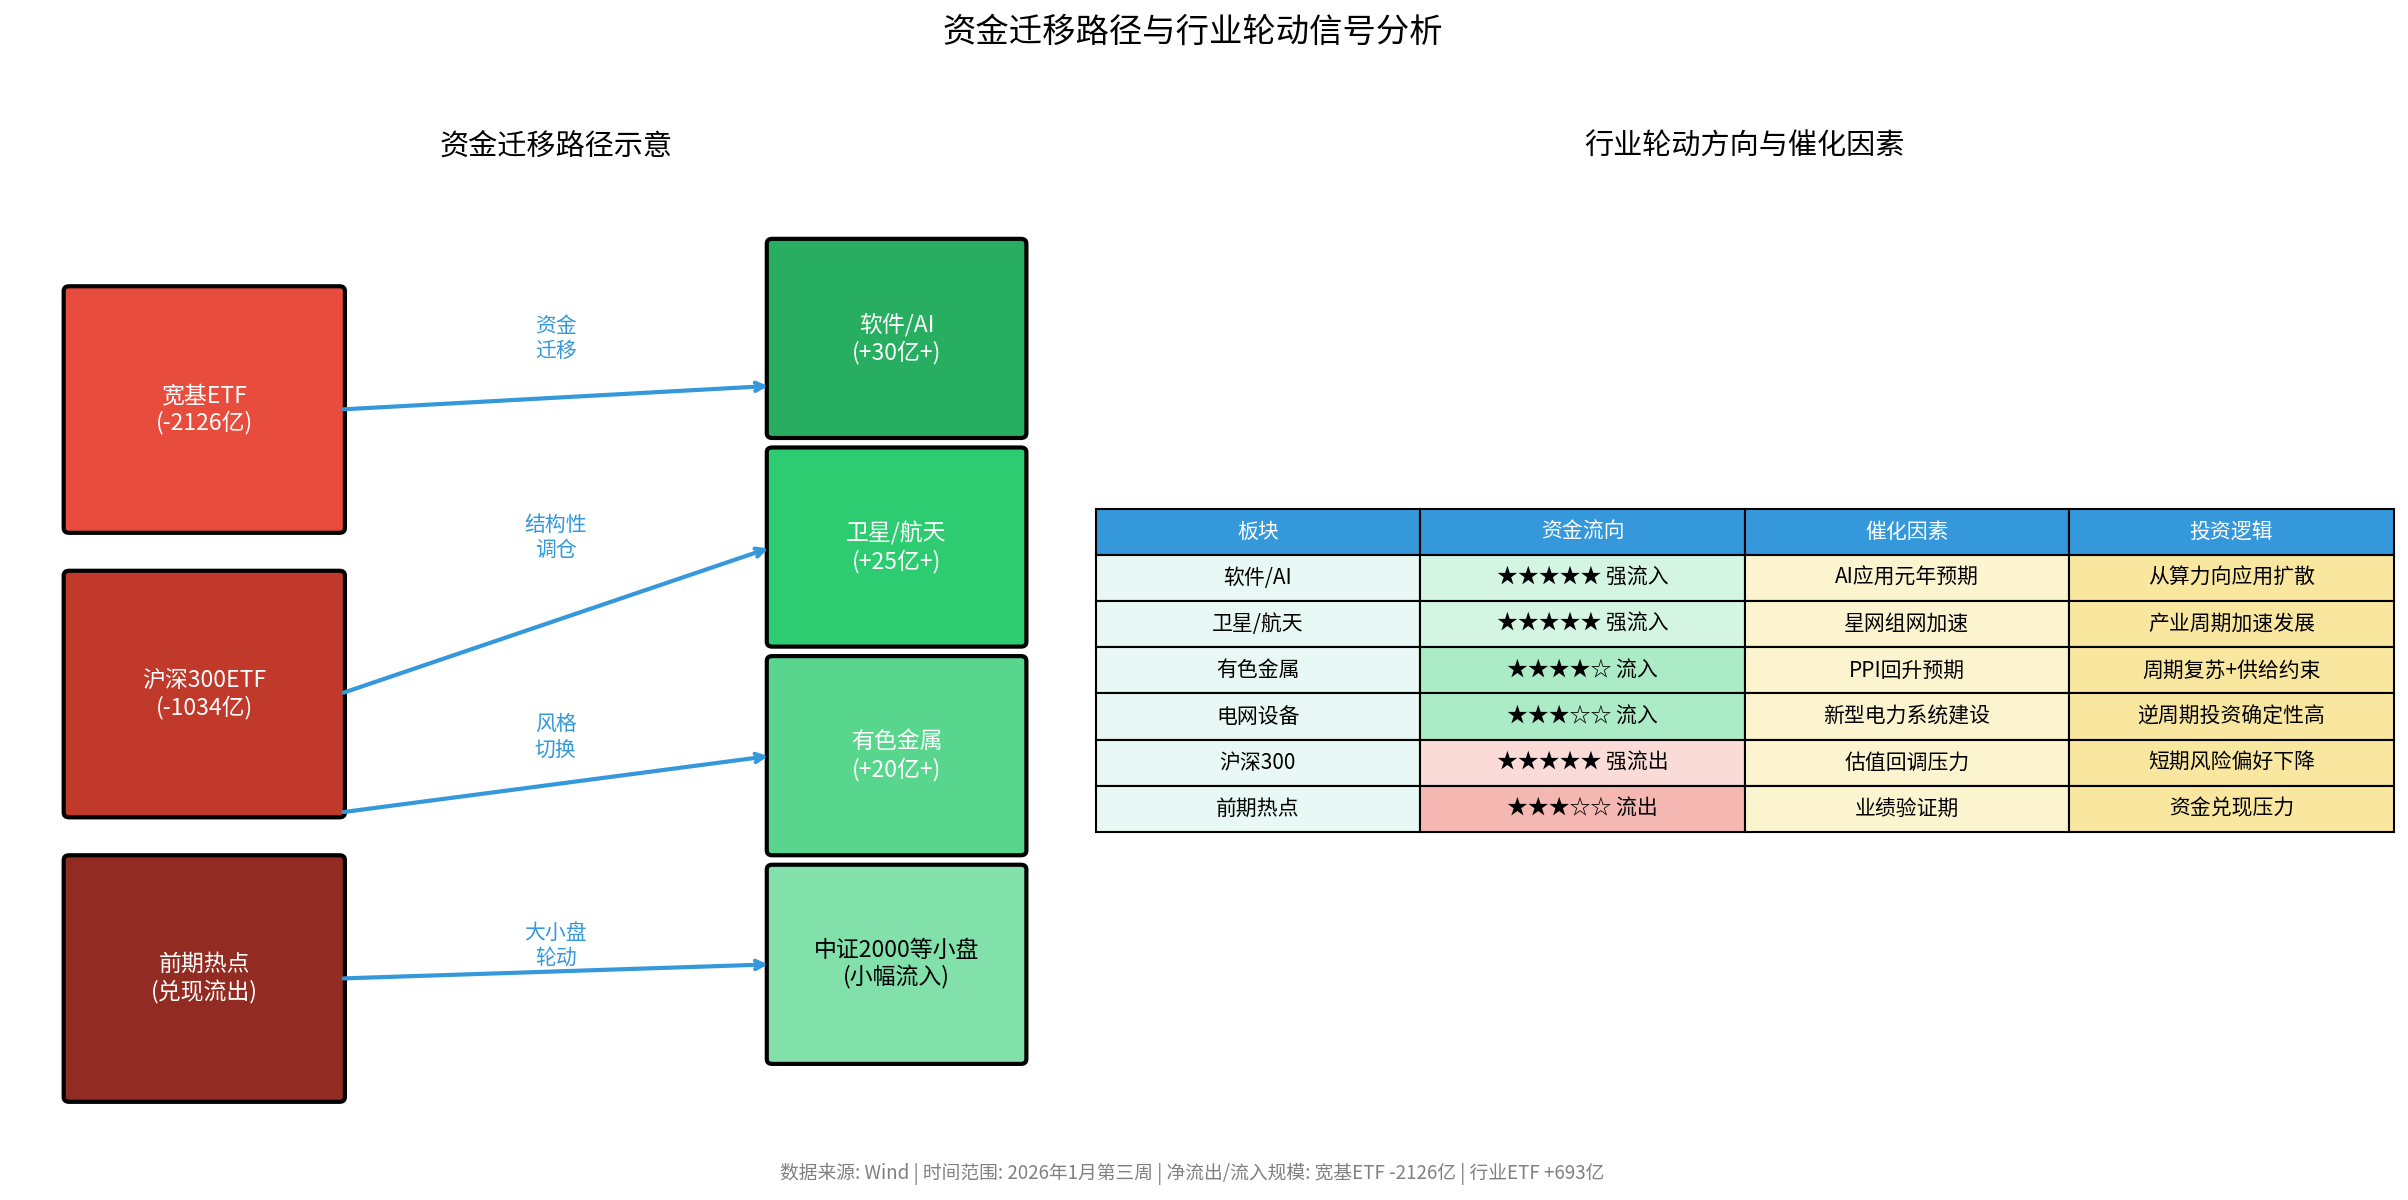
The trend of capital shifting from “defensive” broad-based products to “offensive” thematic investments is very obvious:
- Software ETF: Net inflow of over RMB 3 billion (ranks first)
- Satellite ETF: Net inflow of over RMB 2.5 billion
- Non-Ferrous Metals ETF: Net inflow of over RMB 2 billion
- AI/Artificial Intelligence ETF: Net inflow of over RMB 1 billion
- Power Grid Equipment ETF: Net inflow of nearly RMB 700 million [0][1]
This capital allocation trend reflects institutions’ precise grasp of
The CSI 2000 ETF is the only broad-based index with net inflows, which is in line with the historical “calendar effect” rule —
| Time Node | Event | Outflow Scale | Subsequent Trend | Implication |
|---|---|---|---|---|
| February 2024 | Reversal after large-scale broad-based ETF outflows at the start of the year | Approximately RMB 80 billion | Rebound after periodic bottom | Large-scale outflows often correspond to periodic bottoms |
| September 2024 | Policy-driven capital shift | Obvious broad-based outflows | Stabilized and rebounded under policy stimulus | Capital outflows often coincide with policy bottoms |
January 2026 |
Current large-scale outflows |
RMB 212.6 billion |
To be observed |
Record-high scale |
| Signal Type | Strength Rating | Interpretation |
|---|---|---|
| Risk Appetite Shift | ★★★★☆ | Shifting from anchoring on large caps to selected tracks |
| Accelerated Sector Rotation | ★★★★★ | Structural differentiation will continue to intensify |
| Valuation Differentiation | ★★★★☆ | Large-cap blue chips pull back, small-caps recover |
| Probability of Bottom Signal | ★★★☆☆ | Requires comprehensive judgment combined with fundamentals |
According to institutional analysis, the current inflation level is moderately rising, the internal driving force of economic recovery is gradually recovering, and the positive macro fundamentals will help the A-share market continue its structural slow bull pattern.
- Catalysts: Expectations for the first year of AI applications, upcoming performance inflection point
- Capital Signal: Software ETF ranks first with net inflow of over RMB 3 billion
- Investment Logic: The 2026 tech market is expected to expand from computing infrastructure to software [0][2]
- Catalysts: Successful launch of 18 groups of satellites by China Satellite Network, dense networking of mega constellations
- Capital Signal: Satellite ETF has net inflow of over RMB 2.5 billion
- Investment Logic: The accelerating development trend of the domestic satellite industry remains unchanged, and breakthroughs in reusable rocket technology bring new catalysts [1][2]
- Catalysts: Expectations of PPI recovery, commodity cycle recovery
- Capital Signal: Non-Ferrous Metals ETF has net inflow of over RMB 2 billion
- Investment Logic: Manufacturing recovery combined with supply constraints, favorable cyclical position [1]
- Catalysts: Construction of new power systems, accelerated approval of ultra-high voltage projects
- Capital Signal: Power Grid Equipment ETF has net inflow of nearly RMB 700 million
- Investment Logic: Counter-cyclical investment + high growth certainty [1]
- Previous Hot Sectors (Robotics, Photovoltaics): High short-term capital profit-taking pressure
- Military Industry: Weakening short-term event catalysts, cooling market sentiment
- Real Estate-Related Sectors: Sustained downturn in industry fundamentals
- Broad-Based Anchoring: Maintain strategic allocation to core assets
- Left-Side Layout: Consider gradually increasing positions in CSI 300 during broad-based pullbacks
- Hong Kong Stock Allocation: Focus on dividend assets such as Hong Kong-listed tech stocks and free cash flow stocks
- Short-Term Avoidance: Appropriately reduce exposure to large-cap blue chips
- Follow the Trend: Participate in main themes such as software and satellites in line with capital flows
- Rotation Rhythm: Pay attention to style shifts during the performance forecast period
- Effectiveness of the 4100-point support level for the Shanghai Composite Index
- Whether ETF capital flowscontinue to shift to industry themes
- Overall tone of annual report performance forecasts
- Changes in the RMB exchange rateand foreign capital flows
This capital withdrawal behavior, with broad-based index ETFs seeing a weekly net outflow of over RMB 200 billion, releases the following core signals:
- Risk Appetite Shift: Institutional investors are shifting from systematic allocation to selected tracks
- Accelerated Sector Rotation: Technology (software, AI), high-end manufacturing (satellites), and cyclical sectors (non-ferrous metals) have become new main lines
- Style Shift Expectations: Large-cap blue chips are under pressure, while small-cap growth stocks are gaining attention
- Bottom Signal to Be Verified: In history, large-scale ETF outflows often correspond to periodic bottoms, but confirmation from subsequent trends is required
[0] Tian Tian Fund Network - “Broad-Based Index ETFs Sold Off by Main Forces for Over RMB 200 Billion! Over 100 Industry-Themed ETFs Are Being Snatched Up by Capital” (https://fund.eastmoney.com/a/202601173622493672.html)
[1] Securities Times - “Stock ETFs See Net Outflow of Over RMB 7.3 Billion on January 14” (https://www.stcn.com/article/detail/3594605.html)
[2] Eastmoney - “Stock ETFs See Single-Day Net Outflow of Over RMB 7 Billion: Broad-Based Products Suffer Collective Capital Outflow, Software and Non-Ferrous Metals See Main Force Inflows” (https://nw.eastday.com/zq/zh/20260115/86466858bd14d5dd8edd5c3f29c2a2ad.html)"
Insights are generated using AI models and historical data for informational purposes only. They do not constitute investment advice or recommendations. Past performance is not indicative of future results.
About us: Ginlix AI is the AI Investment Copilot powered by real data, bridging advanced AI with professional financial databases to provide verifiable, truth-based answers. Please use the chat box below to ask any financial question.