Gold Prices Hit All-Time High: Analysis of Catalysts and Investment Opportunities
Unlock More Features
Login to access AI-powered analysis, deep research reports and more advanced features
About us: Ginlix AI is the AI Investment Copilot powered by real data, bridging advanced AI with professional financial databases to provide verifiable, truth-based answers. Please use the chat box below to ask any financial question.
Related Stocks
Based on the latest market data and in-depth analysis, below is a comprehensive interpretation of gold prices hitting an all-time high:
Spot gold prices broke through the
- U.S. December core CPI came in at 3.1%, below market expectations of 3.3%, marking the 6th consecutive month of decline[2]
- Interest rate futures markets show that investor expectations for a Federal Reserve rate cut in March 2026 have surged from 58% to 78%
- The Federal Reserve has cut rates by a total of 75 basis points in 2025, with the federal funds target range being continuously lowered
- As an “interest-free asset”, the holding cost of gold has decreased, significantly boosting its appeal
- The U.S. Dollar Index (DXY) has fallen from 108.5 at the start of the year to 98.3, representing a 9.4% depreciation[3]
- Since international gold is priced in U.S. dollars, a weaker dollar directly lifts gold prices denominated in other currencies
Geopolitical tensions have become a core pillar supporting gold’s safe-haven demand[1][2]:
| Risk Event | Impact |
|---|---|
| Escalating Middle East Tensions | Persistent instability in the Red Sea shipping lane, with multiple shipping companies suspending operations |
| Ongoing Eastern Europe Standoff | Supply chain pressures drive safe-haven capital into the gold market |
| Venezuela Sanctions | The Trump administration announces a blockade of sanctioned oil tankers |
| Concerns Over Federal Reserve Independence | Growing worries about central bank policy independence |
Analysts at UBS Group note that the current geopolitical landscape features “multi-point, multi-dimensional” tensions, which are fundamentally different from the local conflicts of the 2010s[2].
The World Bank has lowered its 2026 global economic growth forecast from 2.7% to 2.4%, warning of “risks of synchronized slowdowns in major economies”[2]. Against this backdrop:
- Adjustments in China’s real estate market, growing pains of Europe’s energy transition, and debt pressures in emerging markets
- Gold’s hedging function is fully demonstrated
- TD Securities notes: Gold typically performs well when economic growth prospects are dim
The 2025 gold market saw a landmark rally: spot gold prices climbed from $2640 per ounce at the start of the year to $4500 per ounce at year-end, with a
- Global central bank reserve asset diversification: Gold has surpassed U.S. Treasuries to become the largest reserve asset of global central banks
- De-dollarization trend: Countries are casting a “vote of no confidence” in the U.S. dollar credit system
- Renminbi internationalization opportunities: New opportunities emerge amid the global reserve asset diversification process
| Institution | Forecast | View |
|---|---|---|
| Morgan Stanley | 2026 average price of $4500 per ounce | Cautiously optimistic |
| Citibank | Testing $4700 per ounce in H1 2026 | Bullish |
| Goldman Sachs | At least two rate cuts in H1 2026 | Supports gold prices |
| CICC | Gold performs well during monetary policy shift cycles | Rally to last 12-18 months |
- Loose monetary policy cycle: Expectations for Federal Reserve rate cuts continue to strengthen
- Geopolitical uncertainty: Unlikely to ease in the short term
- Central bank gold demand: Global central banks continue to increase gold allocations
- Falling inflation trend: Core inflation has declined for consecutive periods
- Risk of inflation resurgence: A rebound in inflation data could alter the Federal Reserve’s monetary policy path
- Geopolitical de-escalation: Any easing of tensions could weaken safe-haven demand
- Technical correction: A pullback may occur after rapid short-term gains
- U.S. dollar rebound: Strong U.S. economic data could lead to a renewed strengthening of the dollar
As one of the world’s largest gold producers, Newmont’s stock performance is highly correlated with gold prices[4]:
| Metric | Data |
|---|---|
| Current Price | $114.12 |
| Market Capitalization | $124.53B |
| 1-Year Gain | +169.47% |
| 6-Month Gain | +96.12% |
| P/E Ratio | 17.42x |
| ROE | 22.72% |
| Net Profit Margin | 33.82% |
- Raymond James raises Newmont’s target price from $99 to $111, reaffirming its “Outperform” rating[4]
- The strategic moves to acquire Monex and increase stake in Atkinsons on December 29 have boosted market confidence
- Leverage effect: Mining company stocks typically have an amplified reaction to gold price movements
- Profit margin expansion: Higher gold prices directly improve mine profitability
- Dividend potential: Mining companies’ dividend-paying capacity improves in a high gold price environment
- Reasonable valuation: A P/E ratio of 17.42x remains attractive relative to the industry average
| Metric | Data |
|---|---|
| Current Price | $421.29 |
| Market Capitalization | $158.32B |
| 1-Year Gain | +66.43% |
| 6-Month Gain | +36.61% |
| YTD Gain | +5.78% |
According to the latest data[5]:
- Record capital inflows: Gold ETFs have posted their best annual performance since 1979
- Gold-silver ratio signal: The current ratio is in the “wartime behavior” range, indicating strong safe-haven demand
- Rebounding Chinese demand: China’s gold demand rebounded significantly in December
- Resilient Indian demand: Gold demand in the Indian market remains robust
| Comparison Dimension | Gold ETF (GLD) | Physical Gold |
|---|---|---|
| Trading Convenience | High, traded on exchanges | Low, requires storage and transportation |
| Transaction Costs | Low, minimal commissions | High, includes premiums |
| Entry Threshold | Low, flexible share quantities | High, large unit sizes |
| Liquidity | High | Medium |
| Custodial Risk | None | Exists |
- Allocation ratio: It is recommended to allocate 5-15% of the investment portfolio to gold-related assets
- Entry timing: Wait for a technical correction before allocating to avoid chasing highs
- Product selection:
- Conservative: Choose ETFs with low tracking errors (e.g., GLD, IAU)
- Aggressive: Allocate moderately to high-beta mining stocks (e.g., NEM)
- Long-term: Consider dollar-cost averaging to smooth out costs
- Short-term volatility risk: Technical indicators such as RSI have entered overbought territory
- Monetary policy expectation gap: A slower pace of Federal Reserve rate cuts than expected could trigger a pullback
- Liquidity risk: Liquidity crunches may occur in extreme market conditions
- Exchange rate risk: Non-U.S. dollar investors need to monitor exchange rate fluctuations
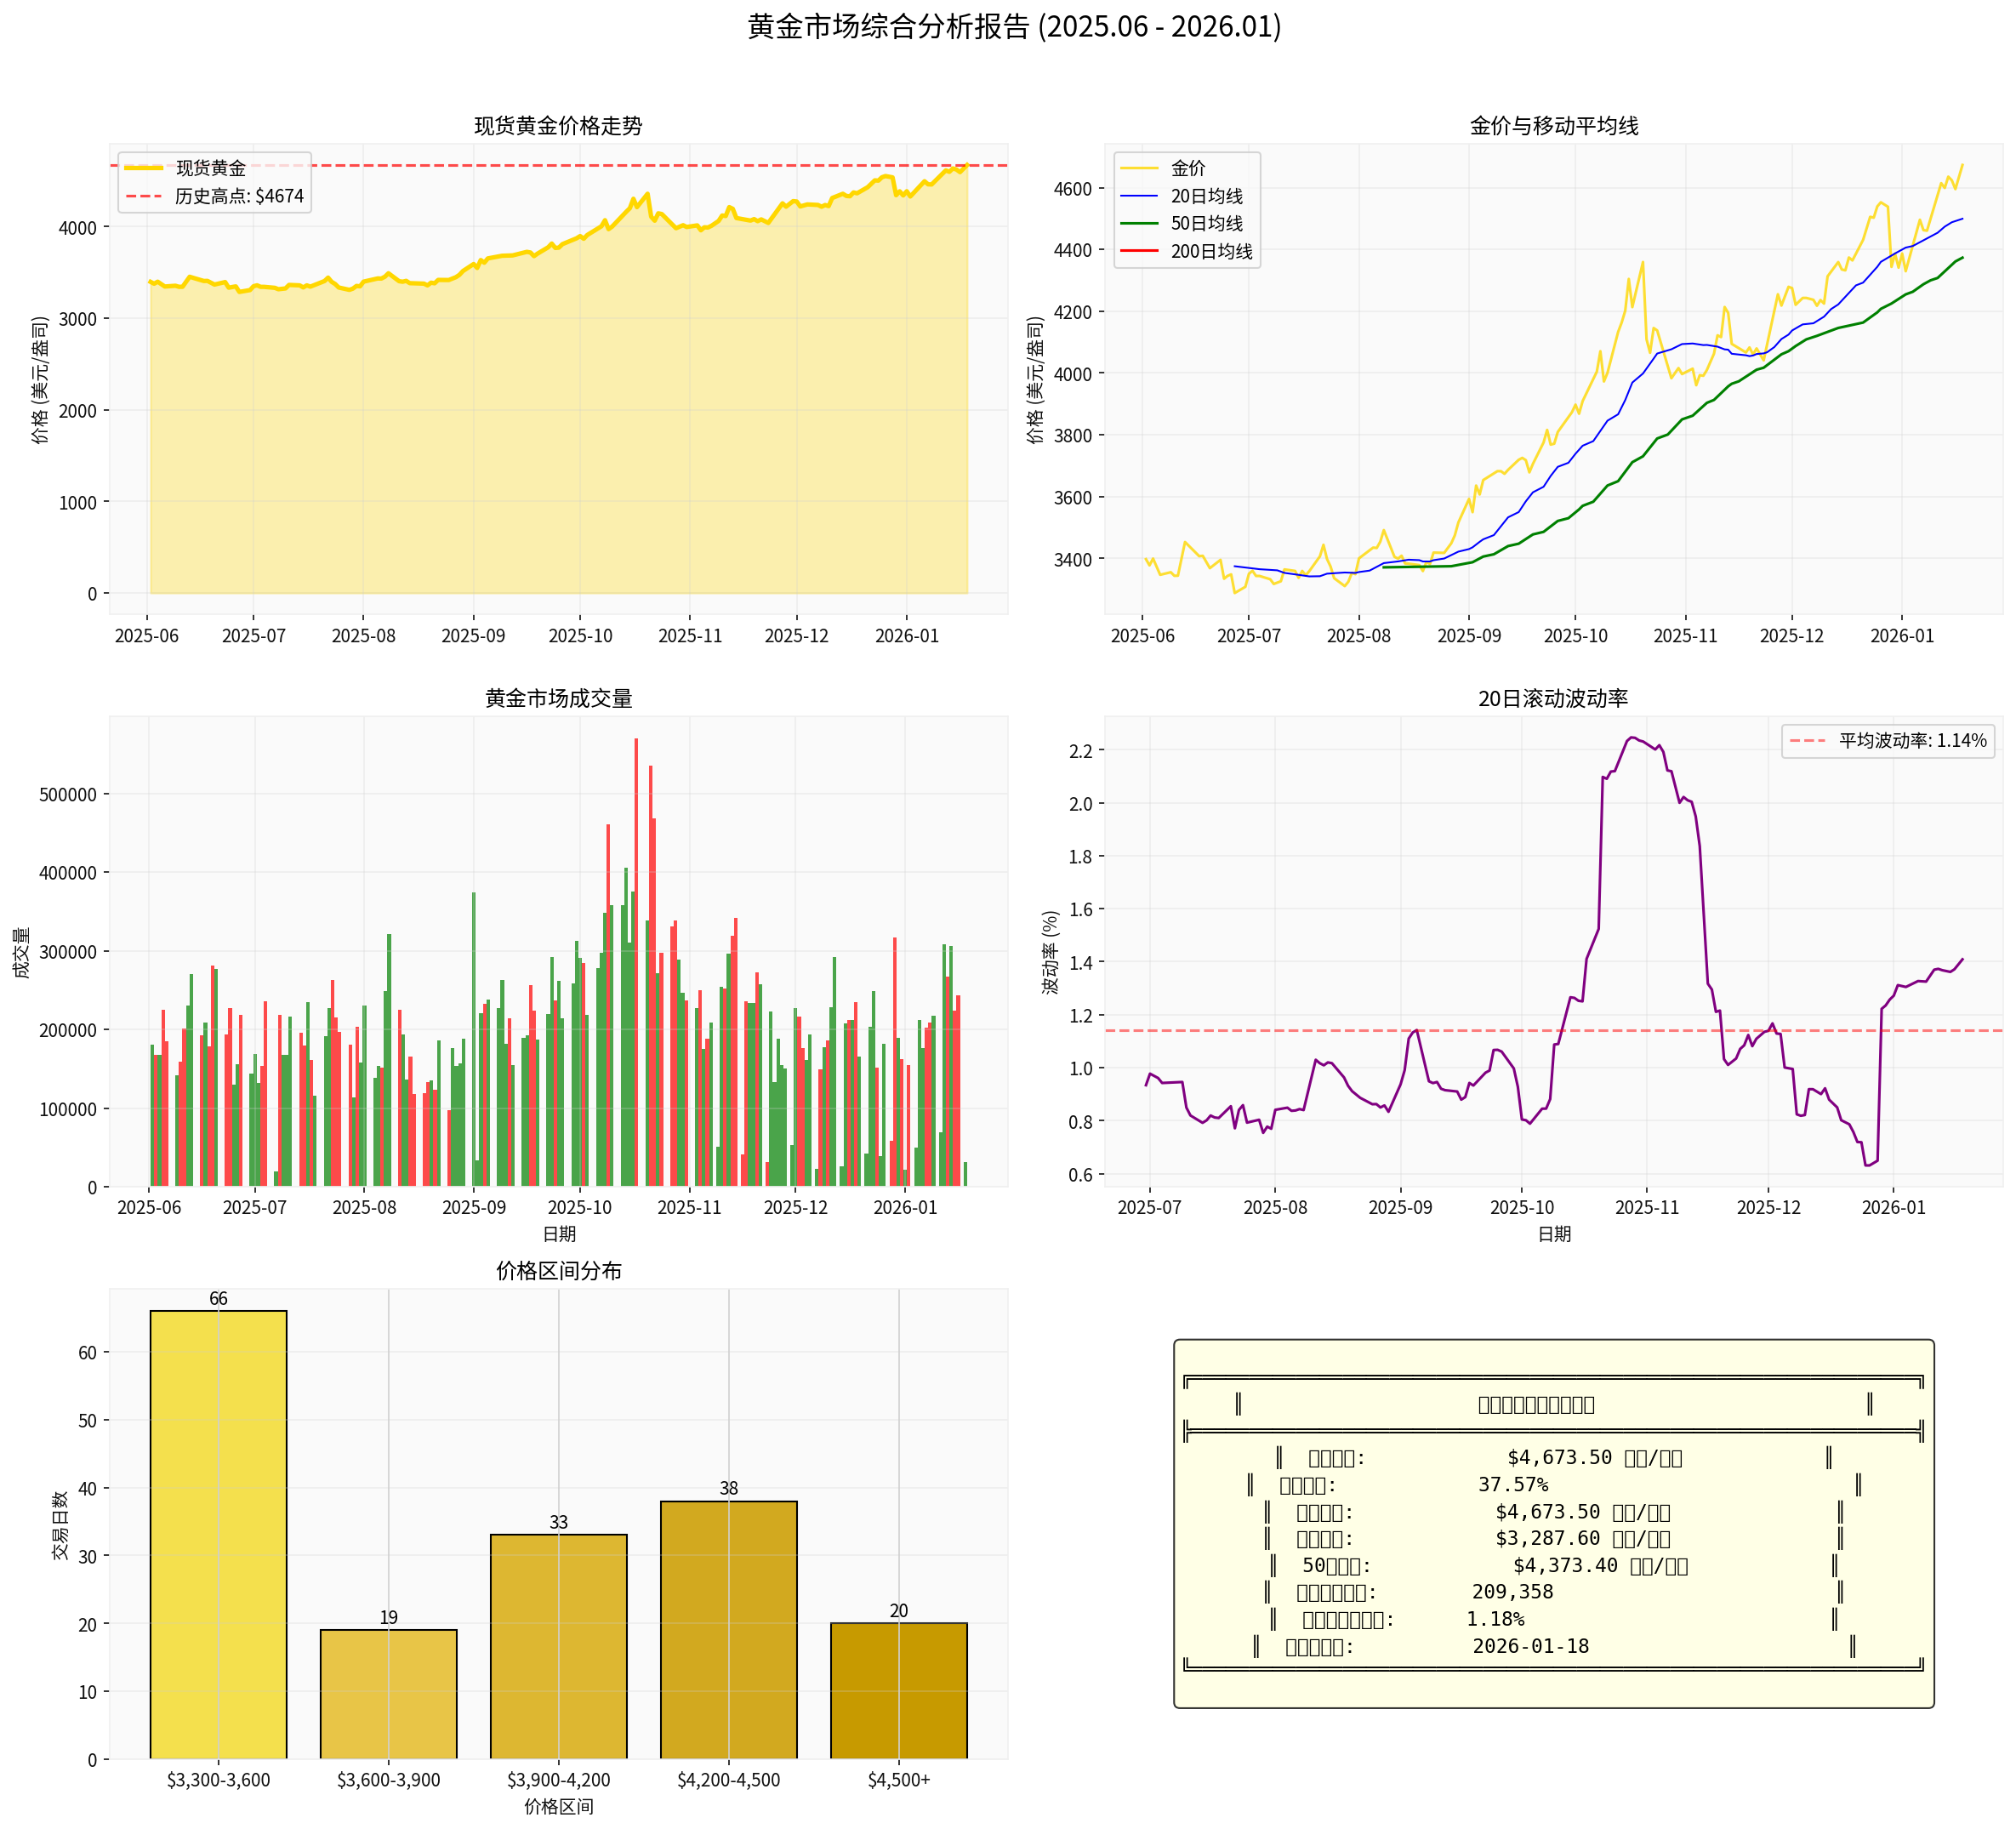
The chart above shows a comprehensive analysis of the gold market from June 2025 to January 2026, including price trends, moving averages, trading volume, volatility, and key statistical indicators.
Gold hitting an all-time high is the result of a confluence of factors:
For investors:
- Short-term: Be wary of technical correction risks; it is recommended to build positions in batches
- Medium-term: Gold still has upside potential; maintain long positions
- Long-term: Against the backdrop of global de-dollarization and reserve diversification, gold’s strategic allocation value stands out
[1] Xinhua Finance - “Gold Time · Daily Gold Commentary: Safe-Haven Demand Supports Precious Metals, Gold Price Volatility Narrows at High Levels” (https://finance.eastmoney.com/a/202601153620808370.html)
[2] Huanan Finance Network - “Comprehensive Analysis of the Precious Metals Market on January 14, 2026: Multiple Positive Catalysts Drive Gold and Silver Prices to New All-Time Highs” (https://www.huanancj.com/m/view.php?aid=24673)
[3] Securities Times - “[Global Insights] Soaring Gold Prices Reflect Trend of Global Central Bank Reserve Asset Diversification” (https://www.stcn.com/article/detail/3596085.html)
[4] Jinling AI Financial Database - Newmont Corporation (NEM) Company Profile
[5] Seeking Alpha - “New Gold-ETF Data: Record Inflows Fuel Metal’s Best Year Since 1979” (https://seekingalpha.com/article/4860409-new-gold-etf-data-record-inflows-fuel-metal-best-year-since-1979)
Insights are generated using AI models and historical data for informational purposes only. They do not constitute investment advice or recommendations. Past performance is not indicative of future results.
About us: Ginlix AI is the AI Investment Copilot powered by real data, bridging advanced AI with professional financial databases to provide verifiable, truth-based answers. Please use the chat box below to ask any financial question.