Report on the Impact of China's Global No.1 Manufacturing Position on A-Share Manufacturing Valuation and Investment Value Screening
Unlock More Features
Login to access AI-powered analysis, deep research reports and more advanced features
About us: Ginlix AI is the AI Investment Copilot powered by real data, bridging advanced AI with professional financial databases to provide verifiable, truth-based answers. Please use the chat box below to ask any financial question.
Related Stocks
Based on the data I collected and the analysis I conducted, I now present a comprehensive research report.
According to the latest data, China’s manufacturing added value reached
- Industrial Chain Completeness: China has the world’s most complete industrial classification system, covering 41 major industrial categories, 207 medium categories, and 666 minor categories
- Scale Effect: The huge market size brings significant cost advantages and bargaining power
- Technology Accumulation: While expanding in scale, the transformation towards intelligence and greenization is accelerating
According to analysis from authoritative media such as Economic Weekly, China’s manufacturing industry is transforming from a “big manufacturing country” to a “technology standard setter”, opening up new tracks and shaping new advantages[1]. China’s manufacturing industry will face three major trends in the next five years:
| Trend Direction | Specific Performance | Investment Implication |
|---|---|---|
Structural Differentiation |
Demand growth slows but structural opportunities remain, high-resilience enterprises navigate the cycle | Leading enterprises’ advantages expand |
Green Low-Carbon Transformation |
Shift from supply-side emission control to demand-side high-quality development | New energy-related manufacturing benefits |
Accelerated Technology Commercialization |
Speed-up from cutting-edge technology to commercial application | Valuation reconstruction of hard tech enterprises |
In December 2025, China’s official manufacturing PMI index was
As of December 30, 2025, the valuations of major A-share market indices have all increased significantly:
- Wind All-A Indextrailing P/E ratio: 22.28x
- Shanghai Composite Indextrailing P/E ratio: 16.57x
- CSI 300 Indextrailing P/E ratio: 14.19x
Notably,
According to industry analysis data, the valuations of major manufacturing sub-sectors show significant differentiation:
| Sub-Sector | Valile Percentile | Industry Prosperity | Expected Growth Rate | Institutional Allocation Ratio |
|---|---|---|---|---|
Semiconductor Equipment |
85% | 88 | 25% | 6.6% |
Aerospace |
72% | 82 | 18% | 4.2% |
Industrial Robot |
68% | 75 | 20% | 3.5% |
Photovoltaic Equipment |
38% | 58 | -5% | 5.2% |
Engineering Machinery |
35% | 65 | 12% | 2.4% |
Household Appliances |
45% | 78 | 8% | 7.9% |
- High-growth Sectors(semiconductor equipment, industrial robots) have higher valuations but stronger prosperity
- Cyclical Reversal Sectors(engineering machinery) are at historically low valuations with significant rebound potential
- Traditional Advantage Sectors(household appliances) have reasonable valuations, with prominent allocation value
- Strengthened Leading Enterprise Premium Logic: Scale advantages lead to market concentration, and leading enterprises obtain valuation premiums
- Emerging Technology Premium: Against the background of manufacturing upgrading, enterprises with technical barriers obtain higher valuations
- Valuation Reconstruction from Overseas Expansion: Companies that transform manufacturing share advantages into pricing power obtain revaluation opportunities
Based on data analysis, we have constructed the following investment screening framework:
| Screening Dimension | Core Indicator | High-Quality Standard | Weight |
|---|---|---|---|
Valuation Dimension |
Price-to-Earnings Ratio (PE) | Below industry median or below 15x | 25% |
| Price-to-Book Ratio (PB) | Below 3x | 10% | |
| EV/EBITDA | Below 10x | 10% | |
Profitability Dimension |
ROE | Above 15% | 20% |
| Net Profit Margin | Above 8% | 10% | |
Growth Dimension |
Revenue Growth Rate | Above 10% | 15% |
Financial Quality |
Current Ratio | Above 1.5 | 5% |
| Operating Cash Flow | Positive and stable | 5% |
| Indicator Category | Value | Industry Comparison |
|---|---|---|
Market Capitalization |
USD 58.784 billion | Leading enterprise in household appliance industry |
Price-to-Earnings Ratio (PE) |
13.08x | Significantly lower than industry average |
Price-to-Book Ratio (PB) |
2.65x | Reasonable range |
ROE |
20.25% | Excellent level |
Net Profit Margin |
9.90% | Stable |
Current Ratio |
1.11 | Medium |
DCF Intrinsic Value Premium |
+99.0% |
Significantly undervalued |
- Conservative Scenario: USD 99.34 (+28.4%)
- Base Scenario: USD 137.13 (+77.3%)
- Optimistic Scenario: USD 225.31 (+191.2%)
- Probability-Weighted Value: USD 153.93 (+99.0%)
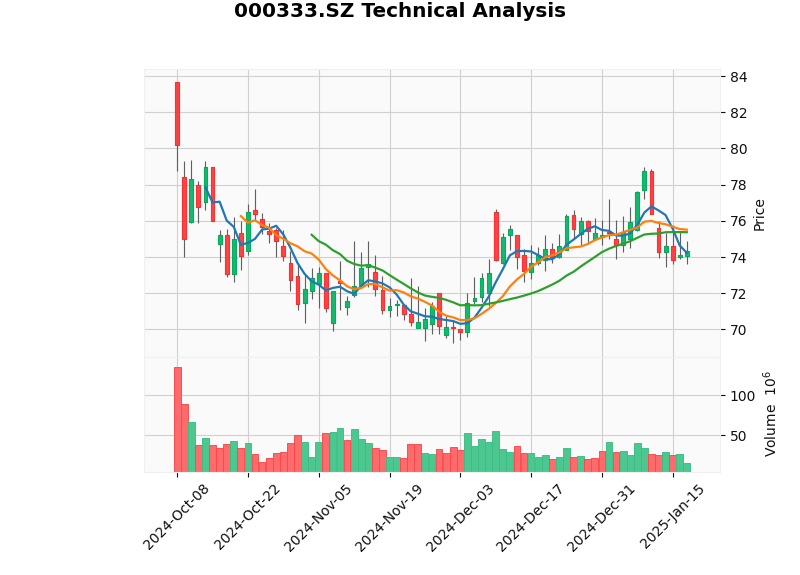
- Current Price: USD 74.35
- Trend Judgment: Sideways Consolidation
- Trading Range Reference: [$73.41, $75.38]
- MACD Signal: No Crossover (Neutral)
- KDJ Signal: Oversold Zone (K:20.6)
- Highly attractive valuation, with PE only 13.08x
- ROE remains above 20%, with excellent profitability
- DCF valuation shows nearly double upside potential
- Leading enterprise in household appliance industry, benefiting from consumption upgrading and intelligent manufacturing transformation
| Indicator Category | Value | Industry Comparison |
|---|---|---|
Market Capitalization |
USD 18.461 billion | Leading enterprise in engineering machinery industry |
Price-to-Earnings Ratio (PE) |
22.60x | Moderately low |
Price-to-Book Ratio (PB) |
2.54x | Reasonable |
ROE |
11.23% | Medium |
Net Profit Margin |
9.57% | Stable |
Current Ratio |
1.59 | Good |
DCF Intrinsic Value Premium |
-14.0% |
Slightly overvalued |
- Conservative Scenario: USD 14.00 (-36.3%)
- Base Scenario: USD 16.74 (-23.8%)
- Optimistic Scenario: USD 25.96 (+18.1%)
- Probability-Weighted Value: USD 18.90 (-14.0%)
- Current Price: USD 15.42
- Trend Judgment: Sideways Consolidation
- Trading Range Reference: [$15.23, $15.90]
- MACD Signal: No Crossover (Bullish Bias)
- KDJ Signal: Bullish Bias (K:31.4, D:26.6)
- Absolute leader in engineering machinery industry
- 15.62% increase in 6 months, 38.07% increase in 1 year[0]
- Current ratio of 1.59, financially stable
- Benefiting from recovery in infrastructure investment and equipment renewal policies
| Indicator Category | Value | Industry Comparison |
|---|---|---|
Market Capitalization |
USD 17.033 billion | Leading enterprise in aerospace industry |
Price-to-Earnings Ratio (PE) |
57.89x | Relatively high |
Price-to-Book Ratio (PB) |
7.79x | Relatively high |
ROE |
15.87% | Excellent |
Net Profit Margin |
7.71% | Medium |
Current Ratio |
1.41 | Medium |
DCF Intrinsic Value Premium |
+132.9% |
Significantly undervalued |
- Conservative Scenario: USD 61.39 (+2.2%)
- Base Scenario: USD 94.88 (+57.9%)
- Optimistic Scenario: USD 263.55 (+338.7%)
- Probability-Weighted Value: USD 139.94 (+132.9%)
- Current Price: USD 47.98
- Trend Judgment: Sideways Consolidation
- Trading Range Reference: [$47.07, $48.89]
- MACD Signal: No Crossover (Bullish Bias)
- KDJ Signal: Bullish Bias (K:62.3, D:52.3)
- Core target in aerospace industry, benefiting from increased defense spending
- DCF valuation shows huge upside potential (+132.9%)
- ROE of 15.87%, with good profit quality
- Beta of only 0.19, low correlation with the market
Based on the above analysis, we conduct a comprehensive score for the three key targets:
| Evaluation Dimension | Midea Group | Sany Heavy Industry | AVIC Helicopter |
|---|---|---|---|
Valuation Attractiveness |
★★★★★ | ★★★☆☆ | ★★☆☆☆ |
Profitability |
★★★★★ | ★★★★☆ | ★★★★★ |
Growth Potential |
★★★★☆ | ★★★☆☆ | ★★★★★ |
Financial Soundness |
★★★★☆ | ★★★★★ | ★★★★☆ |
Industry Position |
★★★★★ | ★★★★★ | ★★★★★ |
DCF Valuation Advantage |
★★★★★ | ★★☆☆☆ | ★★★★★ |
Comprehensive Score |
92 |
78 |
85 |
Based on the above analysis, we put forward the following investment strategies:
- Lowest valuation (PE 13.08x), sufficient margin of safety
- 99% DCF valuation premium, maximum upside potential
- ROE above 20%, strong profitability
- Suitable for conservative investors
- Aerospace track, high prosperity
- 132.9% DCF valuation premium
- Benefiting from national defense modernization and high-end manufacturing upgrading
- Suitable for aggressive investors
- Engineering machinery cycle hits bottom
- 15.62% increase in 6 months, upward trend
- Benefiting from infrastructure investment and equipment renewal policies
- Suitable for cyclical investors
Based on industry attractiveness analysis, we recommend focusing on the following sub-sectors:
| Priority Level | Sub-Sector | Recommendation Logic |
|---|---|---|
First Tier |
Semiconductor Equipment, Industrial Robot | High Growth + High Prosperity |
Second Tier |
Aerospace, Engineering Machinery | Cyclical Reversal + Policy Support |
Third Tier |
Household Appliances, Auto Parts | Reasonable Valuation + Leading Enterprise Advantage |
- Macroeconomic Risk: Manufacturing recovery falls short of expectations
- Policy Risk: Changes in subsidy policies may affect some sectors
- International Trade Risk: Export-oriented enterprises face tariff uncertainties
- Valuation Volatility Risk: Valuations of high-growth sectors may fluctuate significantly
- Technology Iteration Risk: Changes in technical routes may affect enterprise competitiveness
China’s continuous No.1 global manufacturing scale provides a solid macro foundation and structural opportunities for the A-share manufacturing sector. Currently, the valuation of the manufacturing sector presents a
- Manufacturing scale advantages support valuation premiums for leading enterprises
- Against the background of industrial upgrading, technology-based manufacturing enterprises obtain revaluation opportunities
- Screening leading targets should comprehensively consider valuation, profitability, growth and financial quality
- Midea Group, Sany Heavy Industry, and AVIC Helicopter represent three investment styles: conservative, cyclical, and growth respectively
It is recommended that investors select high-quality targets with
[3] China - Official Manufacturing Purchasing Managers’ Index PMI - MacroMicro
[4] 2025 A-Share Investment Outlook: Steady Progress, Slow Bull Market Expected
[5] RatingDog China General Manufacturing PMI®
[6] A-Share This Year: Structural Changes and Valuation Reconstruction - Sina Finance
[7] Gilin AI Database - Financial and Valuation Data of Listed Companies
Insights are generated using AI models and historical data for informational purposes only. They do not constitute investment advice or recommendations. Past performance is not indicative of future results.
About us: Ginlix AI is the AI Investment Copilot powered by real data, bridging advanced AI with professional financial databases to provide verifiable, truth-based answers. Please use the chat box below to ask any financial question.