Baobian Electric (SH600550) Asset-Liability Ratio Analysis Report
Unlock More Features
Login to access AI-powered analysis, deep research reports and more advanced features
About us: Ginlix AI is the AI Investment Copilot powered by real data, bridging advanced AI with professional financial databases to provide verifiable, truth-based answers. Please use the chat box below to ask any financial question.
Related Stocks
| Indicator | Value | Evaluation |
|---|---|---|
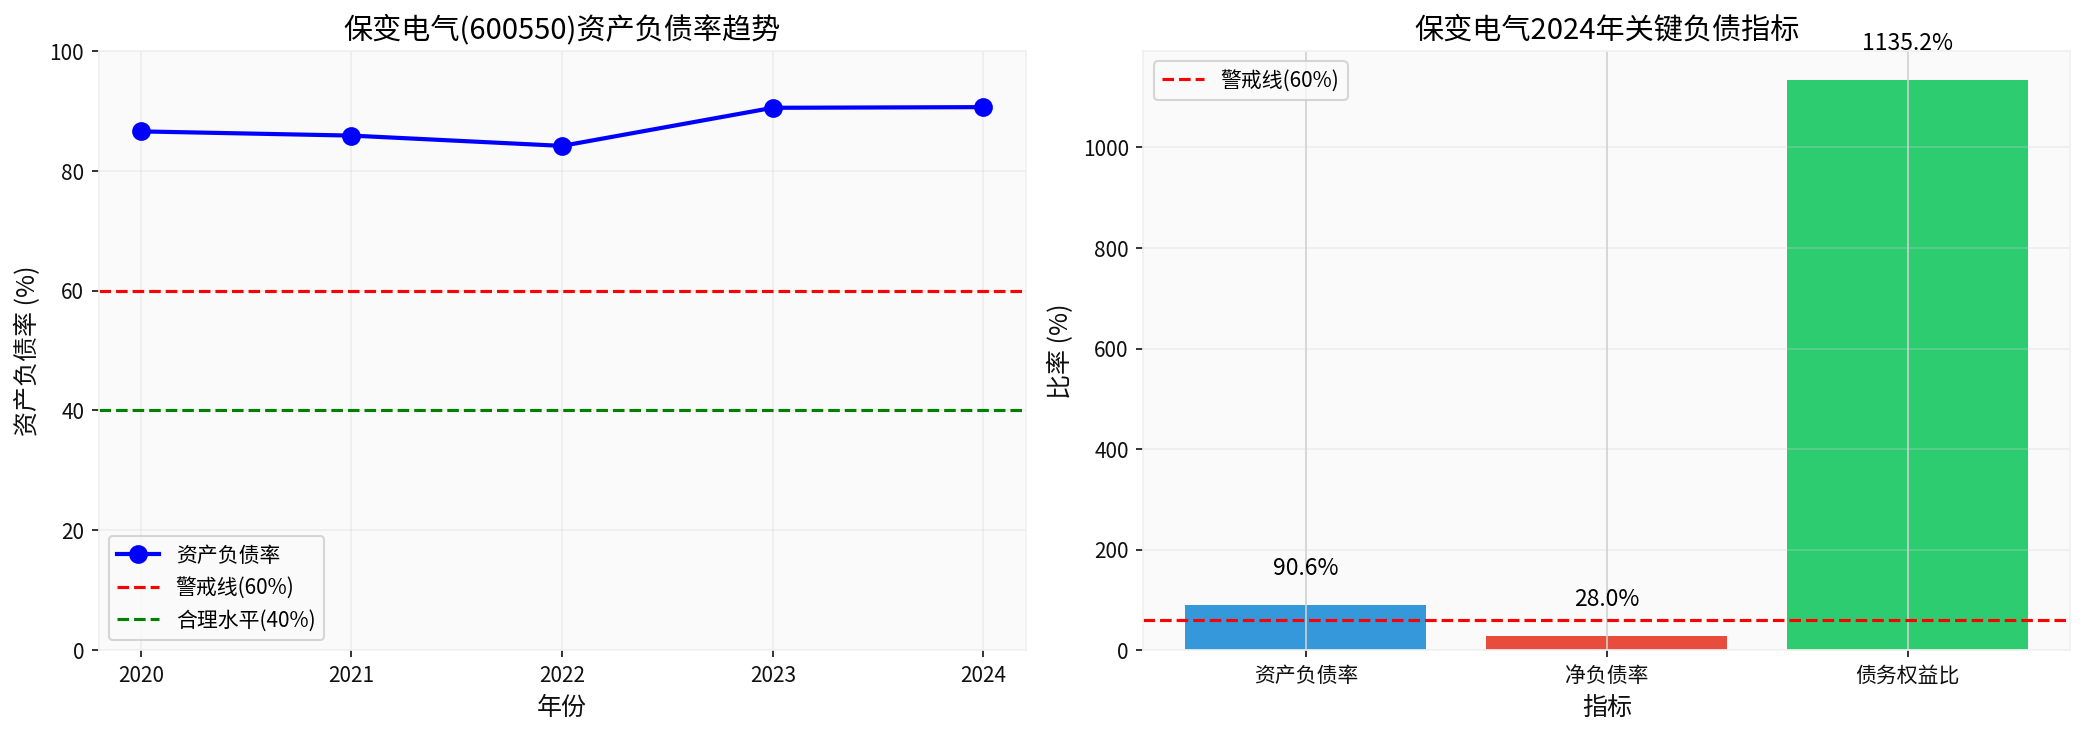
2024 Asset-Liability Ratio |
90.63% |
⚠️ Extremely High |
5-Year Average Asset-Liability Ratio |
87.55% | ⚠️ Persistently High |
Debt-to-Equity Ratio |
1135% | 🔴 Excessively High Financial Leverage |
Current Ratio |
0.89 | ⚠️ Weak Short-Term Solvency |
Net Debt Ratio |
27.96% | Relatively Controllable |
| Year | Asset-Liability Ratio | Trend |
|---|---|---|
| 2020 | 86.58% | Base Year |
| 2021 | 85.88% | ↓ Decreased by 0.7% |
| 2022 | 84.16% | ↓ Decreased by 1.7% |
| 2023 | 90.52% | ↑ Increased by 6.4% |
| 2024 | 90.63% | → Flat |
| Company/Industry | Asset-Liability Ratio | Evaluation |
|---|---|---|
Baobian Electric |
90.63% |
🔴 Significantly High |
| XJ Electric | 50.99% | 🟢 Reasonable Level |
| TBEA | 56.63% | 🟢 Reasonable Level |
Industry Average |
Approx. 60-65% |
Normal Range |
| Manufacturing Industry Warning Line | 70% | ⚠️ Risk Threshold |
- Adequate Cash Reserves: Monetary funds amount to RMB 1.176 billion, which can cover part of short-term debts
- Relatively Controllable Net Debt Ratio: Approximately 28%, indicating that the net debt pressure is manageable after excluding cash
- Asset-Liability Ratio Far Exceeds Warning Line: 90.63% is 20 percentage points higher than the manufacturing industry’s 70% warning line
- Short-Term Debt Repayment Pressure: Current ratio of 0.89 < 1, meaning current assets are insufficient to cover current liabilities
- Aggressive Financial Strategy: Rated as “Aggressive” accounting treatment [0]
- High Debt Risk: Rated as “High Risk” by the system [0]
- Excessively High Absolute Level: The 90.63% asset-liability ratio far exceeds the manufacturing industry’s reasonable range (50-65%) and warning line (70%)
- Worrying Trend: It has continued to rise in the past two years, indicating that the company’s use of financial leverage has become more aggressive
- Competitive Disadvantage: Significantly higher than peer competitors such as NARI Technology (approx. 51%) and TBEA (approx. 57%)
- Liquidity Pressure: Low current ratio leads to pressure in short-term debt repayment
[0] Jinling AI Brokerage API Financial Database - Baobian Electric (600550.SS) Financial Statement Analysis
[1] Lianhe Credit Rating - “Summary and Outlook of Credit Risks in the Machinery Manufacturing Industry in H1 2025” (https://pdf.dfcfw.com/pdf/H3_AP202507301718191346_1.pdf)
[2] China Association for Public Companies - “2025 Report on the Development of High-End Manufacturing among Chinese Listed Companies” (https://capcofile.oss-cn-beijing.aliyuncs.com/2025/file/2025.pdf)
[3] National Bureau of Statistics - Profit Data of National Above-Scale Industrial Enterprises from January to February 2024 (http://www.csteelnews.com/xwzx/hydt/202403/t20240328_86427.html)
Insights are generated using AI models and historical data for informational purposes only. They do not constitute investment advice or recommendations. Past performance is not indicative of future results.
About us: Ginlix AI is the AI Investment Copilot powered by real data, bridging advanced AI with professional financial databases to provide verifiable, truth-based answers. Please use the chat box below to ask any financial question.