In-Depth Analysis Report on Spot Gold Hitting a Record High
Unlock More Features
Login to access AI-powered analysis, deep research reports and more advanced features
About us: Ginlix AI is the AI Investment Copilot powered by real data, bridging advanced AI with professional financial databases to provide verifiable, truth-based answers. Please use the chat box below to ask any financial question.
Related Stocks
I will now present a comprehensive and systematic analysis report on the gold market.
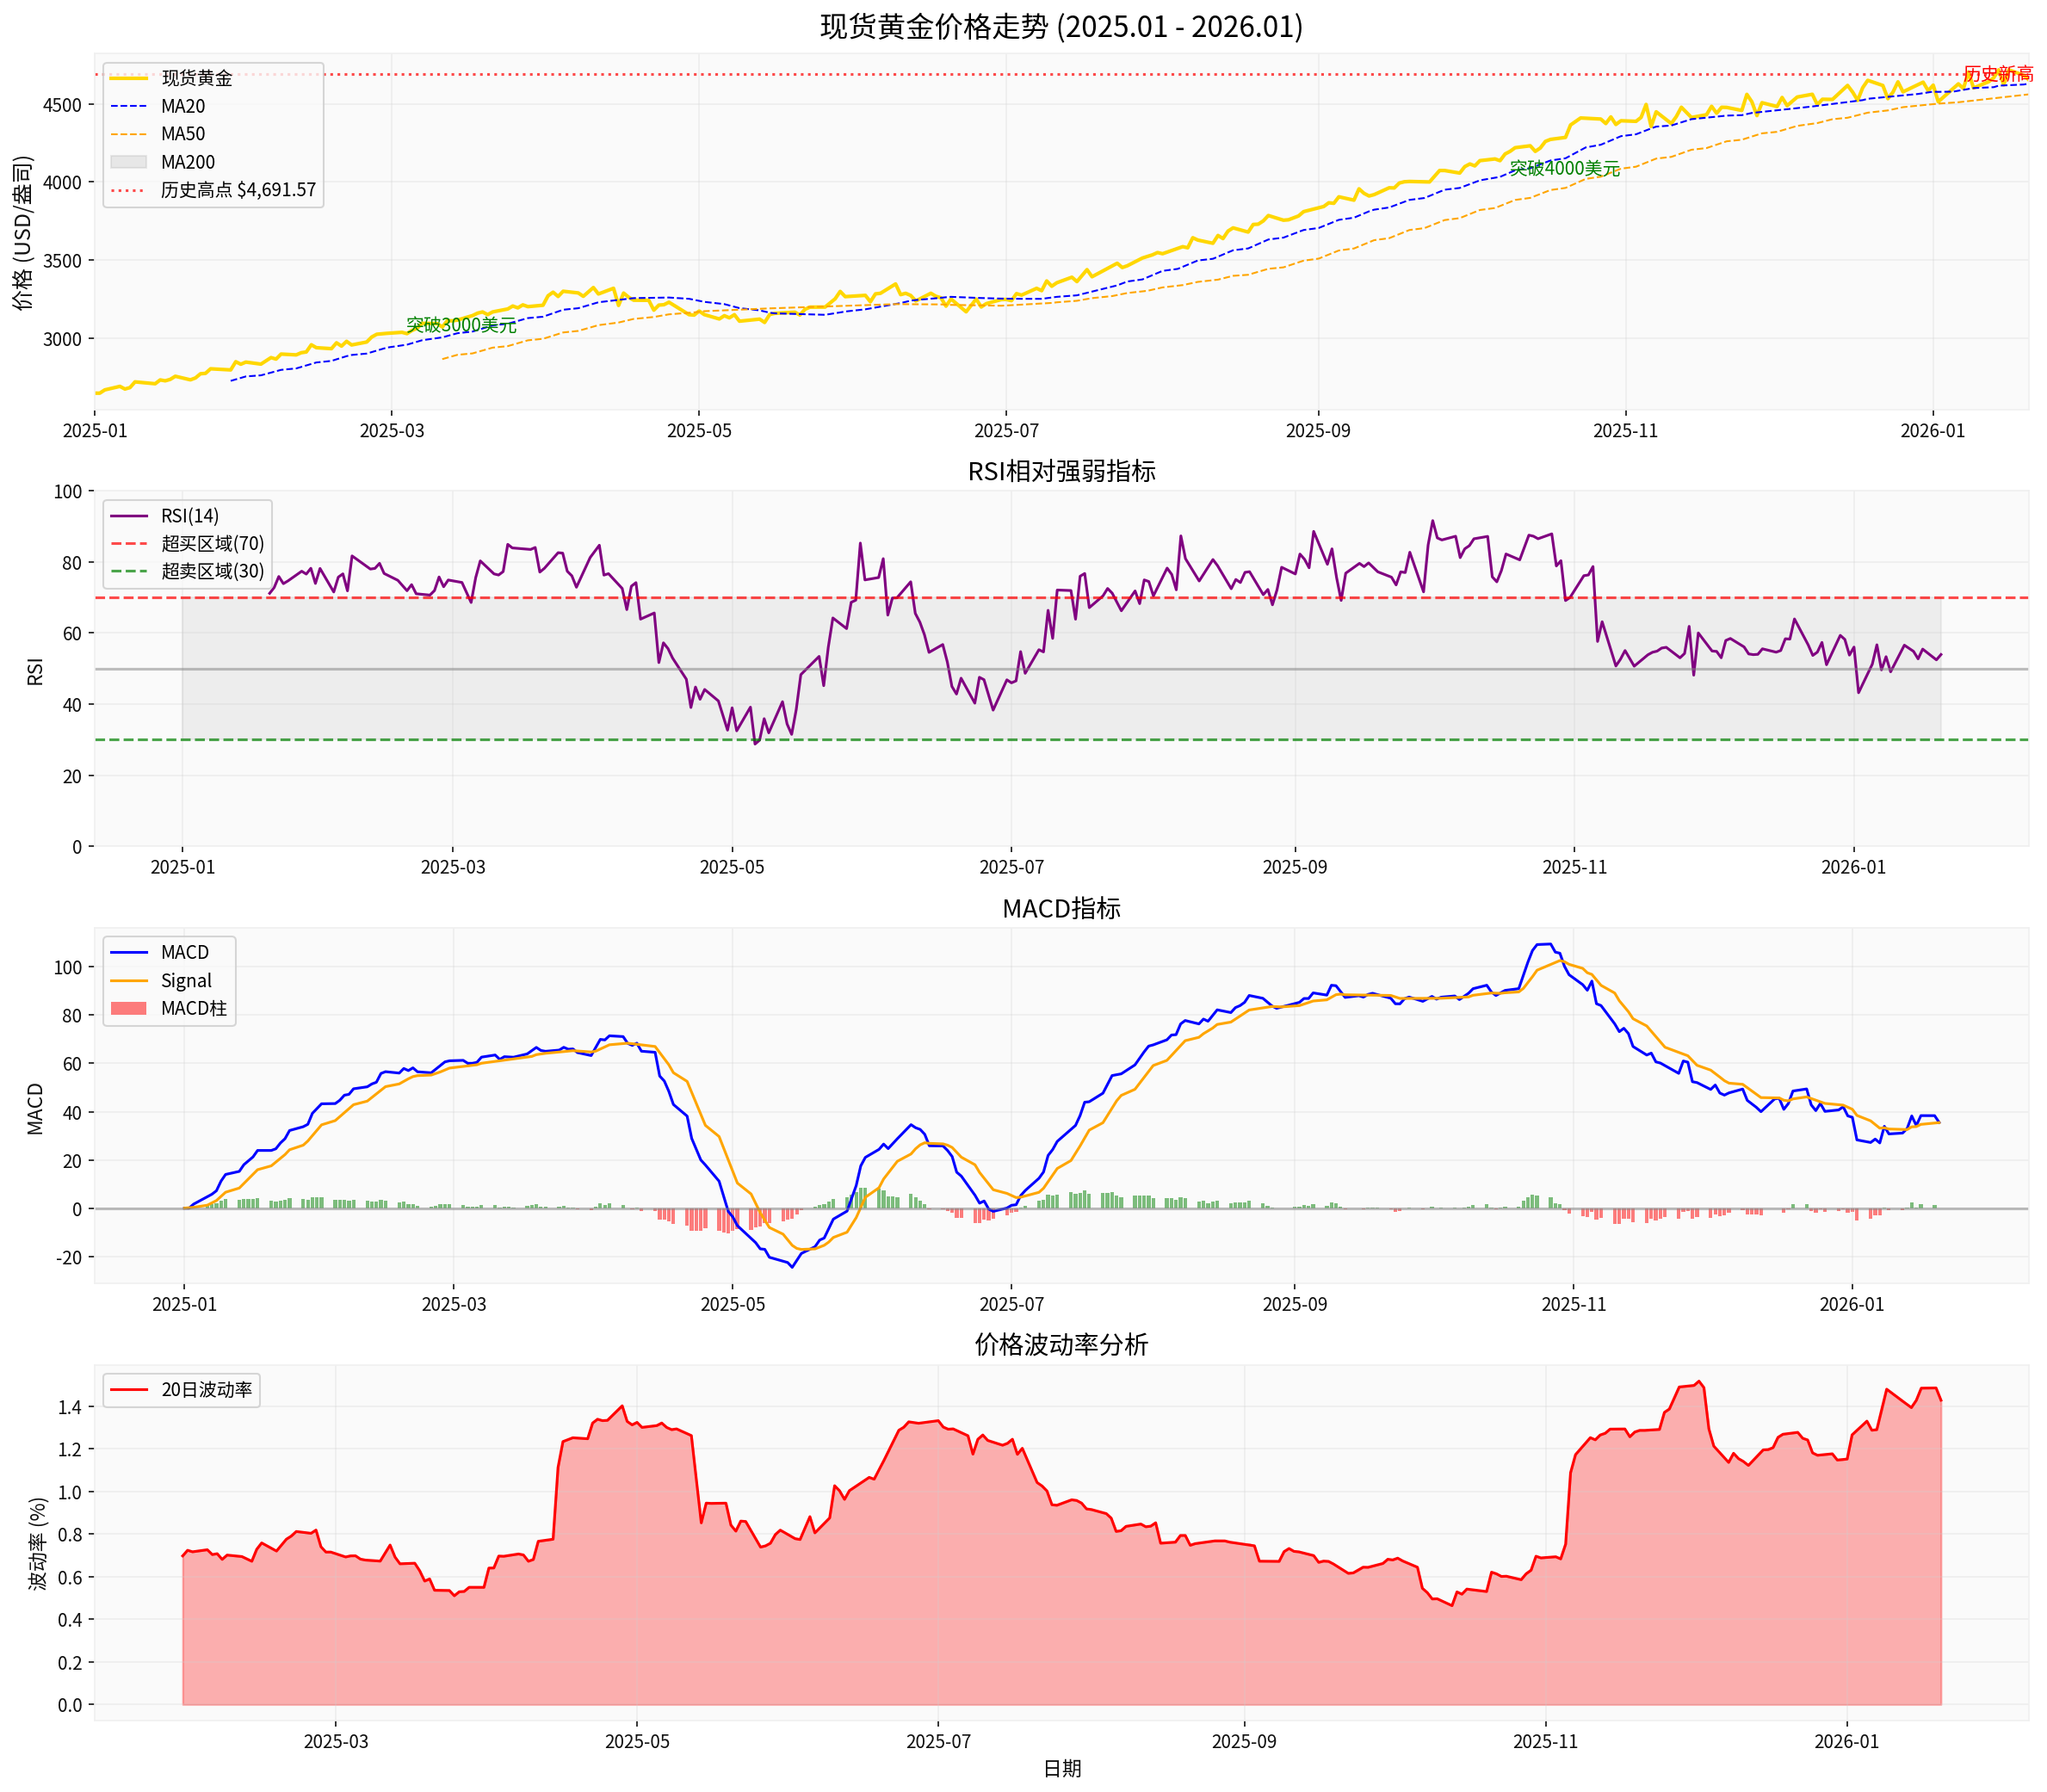
Spot gold prices broke through
| Indicator | Data |
|---|---|
| Price at the start of 2025 | ~$2,640/oz |
| All-time high | $4,691.57/oz |
| Cumulative increase | 75.72% |
| Latest price (Jan 20) | ~$4,652/oz |
| Current price percentile | 96.9% (in the historical high range) |
The
- December Core CPI Datashows that the U.S. core inflation rate came in at 3.1%, lower than the market expectation of 3.3%, marking the 6th consecutive month of decline[1]
- Market expectations for the probability of a Federal Reserve rate cut in March 2026 surged from 58% before the data release to 78%[1]
- Interest rate futures show that investors are betting on 2-3 rate cutsin 2026, far exceeding the 1 cut indicated by the dot plot[2]
Geopolitical tensions have become an important support for gold’s safe-haven demand[1][2][4]:
| Risk Event | Impact Analysis |
|---|---|
Middle East Situation |
Tough warnings from Iran and instability in the Red Sea shipping channel continue to disrupt global supply chains |
Eastern Europe Standoff |
The Russia-Ukraine conflict remains deadlocked, exacerbating volatility in the energy market |
Venezuela Situation |
Threat of U.S. military intervention raises regional risks |
China-U.S. Relations |
Uncertainties from trade frictions and strategic competition |
UBS Group pointed out that the current geopolitical pattern is characterized by “
Central banks around the world increasing their gold holdings have become a
- 43% of central banks plan to increase gold holdings, and 95% of reserve managers expect global central bank gold holdings to rise[5]
- The “de-dollarization” trend of global reserve assets is accelerating, and gold has surpassed U.S. Treasuries to become the largest reserve asset of global central banks[3]
- Emerging market central banks continued net gold purchases in 2025, with countries such as China, India, and Russia continuing to optimize their foreign exchange reserve structures
- Federal Reserve Chairman Jerome Powell is facing a criminal investigation, and the market is concerned that he may leave office early
- If Powell leaves office early, a dovish successor may accelerate the interest rate cut process
- Donald Trump continues to pressure the Federal Reserve, and concerns about political interference are eroding market confidence
The World Bank lowered its 2026 global economic growth forecast from 2.7% to 2.4%, warning that “major economies may face the risk of synchronized slowdown”[1]:
- Adjustments in China’s real estate market continue
- Growing pains of Europe’s energy transition
- Rising debt pressures in emerging markets
| Indicator | Value | Signal Interpretation |
|---|---|---|
MA (20-day) |
$4,629.29 | Short-term moving averages are in a bullish arrangement |
MA (50-day) |
$4,560.29 | Mid-term uptrend remains intact |
MA (200-day) |
$3,865.62 | Long-term moving average provides strong support |
RSI (14) |
53.96 | In a neutral to bullish zone, no overbought signal |
MACD |
35.51 | Bullish signal, strong momentum |
20-day Volatility |
1.43% | Moderate volatility |
- Price Position: Currently at the96.9th percentileof the year’s highs, with a cumulative increase of 75.74% from the low point
- Moving Average System: All major moving averages are in a bullish arrangement, and the uptrend remains unchanged
- RSI Analysis: The RSI is around 54, not entering the overbought zone (above 70), and technically has upward momentum remaining
- MACD Indicator: The MACD is above the signal line, maintaining a bullish pattern
| Type | Price Level | Description |
|---|---|---|
Resistance Level |
$4,650 / $4,800 | Short-term technical resistance |
Support Level |
$4,580 / $4,500 | Important support range |
Strong Support |
$4,000 | Psychological level and trend line support |
| Institution | 2026 Gold Price Forecast | Core Logic |
|---|---|---|
Morgan Stanley |
Targeting $4,800 | Supported by macro environment |
DBS Bank |
Testing $5,100 in the second half | Long-term bullish outlook |
HSBC |
Hitting $5,000 in the first half | Seasonal factors + safe-haven demand |
Citibank |
Testing $4,700 | Sufficient short-term momentum |
CICC (China International Capital Corporation) |
This cycle will last 12-18 months | Cycle rules of monetary policy shift |
| Investment Product | Suitable Crowd | Suggested Allocation Ratio | Risk Level |
|---|---|---|---|
Physical Gold Bars |
Conservative investors / those with capital preservation needs | 5%-10% | Low |
Bank Accumulated Gold |
Stable investors | 5%-15% | Low |
Gold ETFs |
Aggressive investors | 5%-15% | Medium |
Gold Mining Stocks |
High-risk preference investors | 3%-8% | High |
| Strategy | Applicable Scenario | Operation Suggestion |
|---|---|---|
Dollar-Cost Averaging |
High-level volatile market | Adopt a fixed-investment strategy to smooth out costs |
Buy on Pullbacks |
Technical pullbacks | Deploy positions when gold prices pull back to near the 50-day MA |
Volatility Trading |
High-volatility market | Focus on operations within the $4,500-$4,800 range |
- Core Strategy: Focus on physical gold + accumulated gold
- Allocation Ratio: 8%-12% of total assets
- Operation Method: Focus on fixed investment, do not chase rallies or sell on dips
- Risk Warning: Pay attention to liquidity; physical gold has a discount when cashed out
- Core Strategy: Gold ETFs + paper gold portfolio
- Allocation Ratio: 10%-15% of total assets
- Operation Method: Core holdings + satellite trading (20% position for flexible operations)
- Tool Selection: Huaan Gold ETF (518880), E Fund Gold ETF (159934)
- Core Strategy: Gold ETFs + gold mining stocks + leveraged products
- Allocation Ratio: Up to 15%-20%
- Operation Method: Trend tracking + swing trading
- Focus Targets: Shandong Gold (600547), Zijin Mining (601899), Zhaojin Mining (1818.HK)
Silver has performed strongly recently, outperforming gold[1]:
- Spot silver surged 3.11% to $89.62 per ounceon January 14, briefly hitting an all-time high of $89.98
- Logic behind silver price rise: Resonance of industrial and financial attributes(AI boom, photovoltaic demand, green energy transition)
- Silver has higher volatility than gold, suitable for aggressive investors
- Pay attention to changes in the gold-silver ratio(currently around 52:1, historical average around 65:1)
- Can deploy via silver ETFs (silver fund under Hua Yancy Oil & Gas) or mining stocks
| Risk Type | Hedging Method |
|---|---|
U.S. Dollar Rebound |
Allocate part of U.S. dollar assets for hedging |
Inflation Resurgence |
Gold naturally hedges against inflation |
Geopolitical Detente |
Reduce gold exposure and increase allocation to risk assets |
Liquidity Risk |
Hold paper gold/ETFs instead of physical gold |
- Fluctuating Inflation Data: If inflation rebounds, it may change the Federal Reserve’s monetary policy path[6]
- Geopolitical Detente: Eased tensions will weaken gold’s safe-haven demand
- Technical Correction: A correction may occur after a short-term sharp rise
- U.S. Dollar Rebound: Strong U.S. economic data may support a stronger dollar
- Policy Expectation Reversal: If the Federal Reserve suspends rate cuts or releases hawkish signals
- Position Control: Gold allocation should not exceed 20% of the investment portfolio
- Stop-Loss Setting: Set a 5%-8% stop-loss line for technical corrections
- Diversified Investment: Form a hedging portfolio with risk assets such as stocks and bonds
- Dynamic Management: Closely monitor Federal Reserve interest rate meetings, CPI data, and changes in geopolitical situations
- Bull Market Foundation Remains Intact: The three pillars of support—Federal Reserve’s interest rate cut cycle, geopolitical risks, and central bank gold purchase demand—remain solid
- Short-Term Volatility Possible: Some investors take profits after the record high, and there is a risk of technical correction
- Long-Term Bullish Outlook: Multiple institutions predict that gold prices are expected to test the $4,800-$5,100 range
┌─────────────────────────────────────────────────────────┐
│                    Gold Allocation Strategy              │
├─────────────────────────────────────────────────────────┤
│  Strategic Allocation (Core): Gold ETFs/Accumulated Gold 10%-15% │
│  Tactical Allocation (Satellite): Flexible adjustment, seize buying opportunities on pullbacks │
│  Risk Hedging: Form a hedging portfolio with risk assets │
│  Dynamic Management: Track Federal Reserve policies and geopolitical situations │
└─────────────────────────────────────────────────────────┘
| Variable | Impact Direction | Focus Time Point |
|---|---|---|
| Federal Reserve Interest Rate Meetings | Rate cut → bullish for gold | January, March, May |
| U.S. CPI Data | Below expectations → bullish for gold | Mid-month each month |
| Geopolitical Events | Conflict escalation → bullish for gold | Real-time tracking |
| U.S. Dollar Index Trend | Dollar decline → gold rise | Continuous monitoring |
[1] Huanan Financial Network - “Comprehensive Analysis of the Precious Metals Market on January 14, 2026: Multiple Positive Factors Resonate to Push Gold and Silver Prices to New All-Time Highs” (https://www.huanancj.com/invest/hj/2026/0114/24673.html)
[2] CNFOOL - “Gold Trend Analysis on January 19, 2026: Volatility After Record High, Multi-Dimensional Support Sustains Uptrend” (http://gold.cnfol.com/jinshizhibo/20260119/31952434.shtml)
[3] China.com/Workers’ Daily - “Why Are Global Central Banks ‘Snapping Up’ Gold? Driven by Safe-Haven Demand and Reserve Diversification” (https://news.china.com/socialgd/10000169/20260119/49175893.html)
[4] Sina Finance - “Gold Trading Alert: Uncertainty Shrouds the Globe, Gold and Silver Continue to Hit New All-Time Highs” (https://finance.sina.com.cn/money/forex/hbfx/2026-01-15/doc-inhhiurv4388471.shtml)
[5] Xinhua Daily News/ATFX - “2026 Q1 Trading Magazine Analyzes the Secrets Behind the Surge in Gold Prices” (https://www.xhby.net/content/s696a1b18e4b093d9f5c77c71.html)
[6] China News Service/Guo Shi Zhi Tong Che - “Spot Gold Hits Another Record High, How Long Can the Bull Market Last?” (https://www.chinanews.com.cn/gsztc/2026/01-15/10552274.shtml)
Report Generation Time: January 20, 2026
Data Sources: Gilin AI Financial Database, Wall Street Broker APIs, Public Market Information
Insights are generated using AI models and historical data for informational purposes only. They do not constitute investment advice or recommendations. Past performance is not indicative of future results.
About us: Ginlix AI is the AI Investment Copilot powered by real data, bridging advanced AI with professional financial databases to provide verifiable, truth-based answers. Please use the chat box below to ask any financial question.