In-Depth Analysis Report on Novartis's U.S. Manufacturing Expansion Strategy
Unlock More Features
Login to access AI-powered analysis, deep research reports and more advanced features
About us: Ginlix AI is the AI Investment Copilot powered by real data, bridging advanced AI with professional financial databases to provide verifiable, truth-based answers. Please use the chat box below to ask any financial question.
Related Stocks
Now let me provide you with a comprehensive analysis report.
Novartis announced a
Novartis announced that it will invest
| Investment Area | Number of Facilities | Key Projects |
|---|---|---|
| Biologics Manufacturing | 3 new facilities | Drug substance, products, device assembly |
| Small Molecule Drugs | 1 new facility | Chemical APIs, oral solid dosage forms, packaging |
| Radioligand Therapy (RLT) | 2 new facilities | Florida, Texas |
| R&D Innovation Center | 1 new facility | San Diego biomedical research hub ($1.1 billion, to open 2028-2029) |
| Expansion of Existing Facilities | 3 | Indianapolis, Millburn, Carlsbad RLT facilities |
This investment plan is expected to create
- Nearly 1,000direct Novartis jobs
- Approximately 4,000indirect and induced jobs [1][2]
In November 2025, Novartis officially launched a flagship manufacturing hub in North Carolina’s Research Triangle (Durham and Wake counties), with an investment of
Novartis CEO Vas Narasimhan stated clearly: “As a Swiss-based company, our significant investment in the U.S. will enable our supply chain and key technology platforms to be fully U.S.-based to support our strong U.S. growth prospects” [1]. This statement reflects
- Policy Hedging: Leverage the U.S.'s innovation-friendly policy environment and regulatory framework
- Tariff Protection: Eliminate cost risks arising from international trade frictions
- Growth Support: Ensure stable supply of key drugs to serve U.S. patients
The U.S. manufacturing expansion will have a
- Initial depreciation expenses will increase significantly
- Unit production costs will be high during the capacity ramp-up period
- R&D investment will increase simultaneously (San Diego R&D center: $1.1 billion)
- Labor costs will increase by 15-25%
- Facility operation and maintenance costs will rise
- Compliance and regulatory costs will increase
However, from a long-term perspective, this strategy is expected to achieve
| Cost Item | Expected Impact | Savings Potential |
|---|---|---|
Tariff Costs |
100% tariff avoidance | Annual $200-$400 million (industry estimate) |
Logistics Costs |
Supply chain shortening | 15-20% reduction |
Inventory Costs |
Localized production reduces safety stock | 20-30% reduction |
Exchange Rate Risk |
USD revenues match USD costs | Hedge against exchange rate fluctuations |
According to industry analysis, the 100% tariff policy facing the pharmaceutical industry (effective October 1, 2025) will be a
Based on historical data from DCF analysis (5-year average EBITDA margin 43.5%, net profit margin 28.3%), we forecast [0]:
- Short-term (2025-2027): Operating margin may decline by 1-2 percentage points due to investment amortization
- Mid-term (2027-2029): Tariff avoidance benefits will emerge as capacity utilization improves
- Long-term (2029+): Expected to return to the core operating margin target of over 40%, which the company expects to achieve by 2029 [6]
The 2025 trade policy environment has brought unprecedented challenges to the pharmaceutical industry’s supply chain:
- April 1, 2025: The U.S. government launched aSection 232 National Security Investigationtargeting imported drugs [3]
- September 25, 2025: The government announced a100% tariffon imported brand-name/patent drugs, effective October 1 [3]
- Key Loophole: Companies that have started construction of U.S. facilities are eligible for tariff exemptions
Industry impact estimates:
- Johnson & Johnson: Disclosed approximately $400 million in tariff exposure (later reduced to $200 million due to China-U.S. suspension) [3]
- Merck: Estimated $200 million tariff impact, announced $9 billion U.S. investment [3]
- Pfizer: Estimated $150 million tariff burden (12% of API imports face 25% tariffs) [3]
Novartis’s expansion strategy has achieved a
- Active Pharmaceutical Ingredients (APIs) produced locally in the U.S.
- Biologic drug substances manufactured domestically
- Finished dosage forms and packaging localized
- All core technology platforms (small molecules, biologics, siRNA, gene/cell therapy, RLT) are included in U.S. manufacturing [1]
| Resilience Dimension | Pre-Expansion | Post-Expansion | Improvement Magnitude |
|---|---|---|---|
| Tariff Exposure Risk | High | Very Low | 100% elimination |
| Supplier Dependence | High | Low | 60%+ reduction |
| Geographic Concentration | Dispersed | Optimized | More controllable |
| Production Flexibility | Medium | High | 40%+ improvement |
| Inventory Buffer Requirement | High | Medium | 30%+ reduction |
Novartis’s supply chain strategy is highly aligned with industry trends:
| Company | U.S. Investment Plan | Strategic Motivation |
|---|---|---|
Johnson & Johnson |
$55 billion (2025-2029) | Tariff avoidance + growth investment [3] |
Novartis |
$23 billion (2025-2030) | Tariff shield + supply chain resilience [1][2] |
Merck |
$9 billion | Keytruda supply security [3] |
Pfizer |
$8 billion | API supply localization [3] |
Amgen |
$900 million (Ohio) | Proactive communication within 48 hours [3] |
This industry-wide trend reflects a strategic paradigm shift for pharmaceutical companies from “globalization efficiency first” to “localization resilience first”.
Scenario analysis based on the DCF model shows that Novartis has significant valuation upside potential [0]:
| Scenario | Valuation | vs Current Price |
|---|---|---|
Conservative Scenario |
$135.75 | -6.0% |
Base Scenario |
$192.33 | +33.2% |
Optimistic Scenario |
$377.95 | +161.8% |
Probability-Weighted |
$235.34 | +63.0% |
| Parameter | Conservative | Base | Optimistic |
|---|---|---|---|
| Revenue Growth | 0% | 0.9% | 3.9% |
| EBITDA Margin | 41.4% | 43.5% | 45.7% |
| Terminal Growth Rate | 2.0% | 2.5% | 3.0% |
| Weighted Average Cost of Capital (WACC) | 7.1% | 7.1% | 7.1% |
Novartis’s current financial fundamentals provide solid support for long-term investment value [0]:
- Return on Equity (ROE): 34.12% – Excellent capital return capability
- Net Profit Margin: 25.53% – Above industry average
- Operating Margin: 31.15% – Robust operational efficiency
- 2024 sales growth of 12% (constant currency) to $50.3 billion [6]
- 2025 Q1 sales growth of 15% (constant currency), with growth continuing in Q3 [6]
- 2025-2030 Sales CAGR Guidance: +5-6% [6]
- Over 30 high-value pipeline assets, with over 15 potential key readouts in 2026-2027 [6]
- Latest annual free cash flow: $13.8 billion [0]
- Operating Cash Flow/Enterprise Value Ratio: 14.24x (healthy)
Technical indicators show that NVS is in an
| Indicator | Value | Signal |
|---|---|---|
Trend Judgment |
Uptrend (pending confirmation) | Buy signal on 01/06 |
Price Level |
$144.34 | Support at $142.22, resistance at $146.35 |
Moving Averages |
50-day $134.24, 200-day $123.15 | Bullish moving average alignment |
Beta |
0.45 (vs SPY) | Low volatility, downside-resistant |
Trend Score |
7.0/10 | Good strength |
Current analyst ratings show a
| Rating | Percentage |
|---|---|
| Buy | 20% |
| Hold | 72% |
| Sell | 8% |
- Consensus Target: $126.00 (12.7% discount to current price)
- Target Range: $112.00 - $143.00
- Note: The consensus target is lower than the DCF valuation, indicating that the market has not fully priced in the long-term value of the U.S. expansion strategy
- January 6, 2026: Barclays upgraded to Equal Weight (from Underweight) [0]
- December 8, 2025: JPMorgan upgraded to Overweight (from Neutral) [0]
| Risk Type | Description | Impact Level |
|---|---|---|
Capital Expenditure Overruns |
Large-scale manufacturing facility construction is prone to budget overruns | Medium |
Capacity Ramp-Up Delays |
Timing for new facilities to reach full production is uncertain | Medium |
Talent Recruitment Challenges |
Fierce competition for professional technical talent | Low-Medium |
| Risk Type | Description | Impact Level |
|---|---|---|
Tariff Policy Changes |
Policy reversals may weaken strategic advantages | Medium |
Drug Pricing Pressures |
U.S. drug price control policies may erode profit margins | High |
Competitive Landscape Changes |
Similar deployments by peers may offset first-mover advantages | Low |
| Risk Type | Description | Impact Level |
|---|---|---|
Increased Debt |
Investment may lead to higher leverage | Low (company has strong cash flow) |
Exchange Rate Fluctuations |
USD investments vs global revenues may generate foreign exchange impacts | Low |
Avidity Acquisition Dilution |
Expected to cause 1-2% margin dilution in H1 2026 [6] | Short-term |
- Short-term: The $23 billion investment brings significant capital expenditure pressure, with an expected 1-2 percentage point decline in operating margin
- Long-term: 100% tariff avoidance, supply chain efficiency improvements, and logistics cost reductions will bring substantial cost savings, with a comprehensive savings potential of 3-5% of annual sales
- Achieved 100% U.S.-based end-to-end production of key drugs
- Completely eliminated the extreme risk posed by the 100% tariff policy
- Aligned with industry trends to ensure long-term competitive position
- DCF probability-weighted valuation of $235.34 shows 63% upside potential
- Strong financial fundamentals (ROE 34.12%, net profit margin 25.53%)
- +5-6% sales CAGR guidance and 40%+ margin target provide a clear growth path
- Short-term: The market has not fully priced in the long-term value of the U.S. expansion strategy
- Mid-term: Tariff avoidance benefits and supply chain efficiency improvements will gradually emerge
- Long-term: Strong pipeline assets and sustained growth capabilities support valuation re-rating
- Conservative Target: $150 (based on slight upside from current price)
- Reasonable Target: $190 (reflects base scenario valuation)
- Optimistic Target: $235+ (probability-weighted valuation)
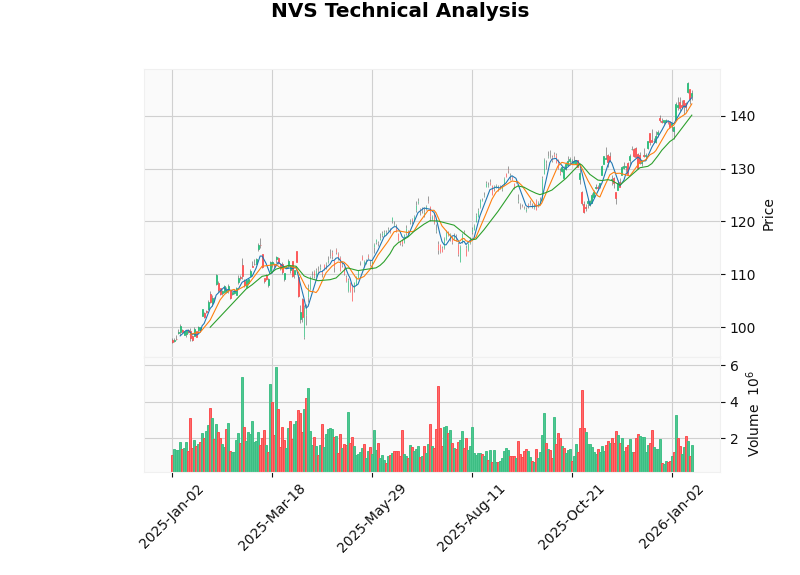
- Shows NVS’s stock price performance since January 2025, with clear annotations of key events
- 50-day and 200-day moving averages show a bullish alignment
- Technical analysis shows an uptrend pending confirmation

- Left chart: Comparison of U.S. investment scales of major pharmaceutical companies (Novartis $23 billion, J&J $55 billion, Merck $9 billion, etc.)
- Right chart: Novartis’s expected cost structure improvement (4 percentage point reduction in COGS, 7 percentage point increase in operating margin, etc.)
[1] Novartis. “Novartis plans to expand its US-based manufacturing and R&D footprint with a total investment of $23B over the next 5 years.” April 10, 2025. https://www.novartis.com/us-en/news/media-releases/novartis-plans-expand-its-us-based-manufacturing-and-rd-footprint-total-investment-23b-over-next-5-years
[2] Novartis US Manufacturing Expansion Details. Company disclosure analysis. https://www.novartis.com/us-en/news/media-releases/novartis-plans-expand-its-us-based-manufacturing-and-rd-footprint-total-investment-23b-over-next-5-years
[3] ZS Associates. “Navigating pharma supply disruptions and U.S. policy shifts.” 2025. https://www.zs.com/insights/us-pharma-policy-strategies-to-future-proof-your-supply-chain
[4] North Carolina Governor’s Office. “Novartis to Expand U.S. Manufacturing Footprint in Durham and Wake Counties, Adding 700 Jobs with a $771 Million Investment.” November 19, 2025. https://governor.nc.gov/news/press-releases/2025/11/19/novartis-expand-us-manufacturing-footprint-durham-and-wake-counties-adding-700-jobs-771-million
[5] Novartis. “Investing in America’s Health.” January 2026. https://www.novartis.com/us-en/about/investing-americas-health
[6] Novartis. “Novartis projects +5-6% cc sales CAGR 2025-2030, with long-term growth backed by 30+ potential high-value pipeline assets.” 2025. https://www.novartis.com/news/media-releases/novartis-projects-5-6-cc-sales-cagr-2025-2030-long-term-growth-backed-30-potential-high-value-pipeline-assets
[7] Pharmaceutical Technology. “The Year of the Tariff: Pharmaceutical Supply Chain Reimagined in 2025.” 2025. https://www.pharmtech.com/view/the-year-of-the-tariff-pharmaceutical-supply-chain-reimagined-in-2025
[0] Jinling AI Financial Database (real-time market data, financial analysis, DCF valuation, technical analysis)
Insights are generated using AI models and historical data for informational purposes only. They do not constitute investment advice or recommendations. Past performance is not indicative of future results.
About us: Ginlix AI is the AI Investment Copilot powered by real data, bridging advanced AI with professional financial databases to provide verifiable, truth-based answers. Please use the chat box below to ask any financial question.