In-Depth Analysis of the Profitability Recovery Path of Nanqiao Food (605339.SS)
Unlock More Features
Login to access AI-powered analysis, deep research reports and more advanced features
About us: Ginlix AI is the AI Investment Copilot powered by real data, bridging advanced AI with professional financial databases to provide verifiable, truth-based answers. Please use the chat box below to ask any financial question.
Related Stocks
Based on the collected data, I will provide you with an in-depth analysis report on Nanqiao Food’s profitability.
Nanqiao Food released its 2025 annual performance forecast on January 20, 2026, expecting the full-year net profit attributable to shareholders of listed companies to be
From the semi-annual data, the net profit attributable to shareholders of listed companies in the first half of 2025 was RMB 32.3647 million to RMB 38.8376 million, a year-on-year decrease of
The company’s main raw materials include palm oil, soybean oil, coconut oil, and natural cream. In 2025, the prices of various raw materials increased year-on-year to varying degrees, exerting significant pressure on production costs[1][2]:
| Raw Material | 2025 Price Trend | Impact on the Company |
|---|---|---|
| Palm Oil | Significant increase compared to 2024 throughout the year; although it declined slightly at the end of the year, it remained at a high level | Major cost item, with the greatest impact |
| Coconut Oil | Continued to rise, hitting a record high | Increased import costs |
| Natural Cream | Significant year-on-year increase | Combined with adverse euro exchange rate factors |
| Soybean Oil | Followed fluctuations in the global oil and fat market | Lag in cost pass-through |
In addition to raw material cost factors, the revenue proportion of the company’s high-margin product - baking application oils - has declined, further dragging down the overall gross profit margin performance[2]. The decline in the revenue proportion of baking application oils, which are the company’s core competitive advantage products, reflects:
- Slow recovery of terminal consumption and weak demand in the downstream baking industry
- Intensified industry competition and squeezed market share
- Product structure tilting towards low-margin categories
Affected by the macro environment, the magnitude of the company’s product price hikes was lower than the increase in raw material costs, and there was a certain lag in price hike measures, resulting in double compression of profit margins[1][2].
Based on the latest financial data[0][0]:
| Indicator Category | Indicator Name | Value | Industry Evaluation |
|---|---|---|---|
| Valuation Indicator | P/E (TTM) | 104.62x | Relatively high, reflecting the market’s expectation of performance decline |
| Valuation Indicator | P/B | 2.45x | Relatively reasonable |
| Profitability | ROE | 2.32% | Significantly lower than historical levels |
| Profitability | Net Profit Margin | 2.56% | Sharp decline |
| Profitability | Operating Margin | 2.42% | At a historical low |
| Liquidity | Current Ratio | 3.35 | Good financial resilience |
| Liquidity | Quick Ratio | 2.45 | Strong short-term solvency |
| Risk Indicator | Beta | 0.53 | Low volatility, strong defensive attributes |
Based on in-depth analysis of the past five years’ data by the financial_analyze tool[0]:
Based on the three-scenario valuation model of the dcf_analyze tool[0]:
| Valuation Scenario | Intrinsic Value | Premium Relative to Current Price |
|---|---|---|
| Conservative Scenario | $24.32 | +22.4% |
| Base Scenario | $31.91 | +60.6% |
| Optimistic Scenario | $53.46 | +169.0% |
| Weighted Average | $36.56 | +84.0% |
| Parameter | Conservative Scenario | Base Scenario | Optimistic Scenario |
|---|---|---|---|
| Revenue Growth Rate | 0.0% | 8.0% | 11.0% |
| EBITDA Margin | 12.6% | 13.2% | 13.9% |
| Perpetual Growth Rate | 2.0% | 2.5% | 3.0% |
| WACC | 8.7% | 8.0% | 7.0% |
Stock price trends show[0]:
- Current price: ¥19.87
- 52-week trading range: ¥13.77 - ¥23.26
- 52-week gain: +12.26%
- Gain in the past 6 months: +15.93%
- Beta coefficient is only 0.53, indicating low correlation with the broader market and certain defensive attributes
Technical analysis shows[0]:
- Short-term moving averages (20-day, 50-day) and long-term moving average (200-day) tend to converge
- The stock price is in a sideways consolidationpattern, lacking a clear trend direction
- MACD indicator has no crossover signal, and KDJ indicator shows neutral to slightly bullish
- Short-term support level: ¥19.51, short-term resistance level: ¥20.23
According to S&P Global’s survey of industry experts[3], palm oil prices are expected to
| Year | Average BMD Crude Palm Oil Price (MYR/ton) | Year-on-Year Change |
|---|---|---|
| 2023 | 3,800 | - |
| 2024 | 4,000 | +5.3% |
| 2025 | 4,223 | +5.6% |
| 2026 (Forecast) | 4,200 |
-0.5% |
- Latest forecast by well-known analyst Dorab Mistry: Due to continuously higher-than-expected production and inventory backlog, palm oil futures prices will continue to face pressureuntil production declines significantly[4]
- Malaysia and Indonesia have entered a high-yield phase, increasing supply pressure
- The implementation timeline of Indonesia’s B50 biodiesel policy is uncertain, weakening the positive demand-side expectations
According to industry data[3]:
- Coconut oil prices rose from $1,126/ton to $1,610/ton between January and August 2024, an increase of approximately 43%
- Tight supply and increasing demand are expected to support coconut oil prices at a relatively high level
- Imported natural cream is still under cost pressure due to euro exchange rate fluctuations
The transmission of raw material price declines to enterprise costs usually has a
The company has clearly stated that it will continue to track and research the price trends of major raw materials, and dynamically adjust procurement strategies based on market conditions combined with raw material inventory and actual production and operation[1][2]:
- Use futures hedging tools to hedge against raw material price fluctuation risks
- Establish a more flexible procurement cycle to lock in low-price ranges
- Optimize safety inventory levels to reduce price fluctuation exposure
Systematically improve operational efficiency and cost control capabilities through the following initiatives[2]:
- Optimize production processes and workflows
- Improve the automation level of production lines
- Strengthen supply chain management
The company clearly stated that it will advance through the dual drivers of “deepening market layout + product innovation-driven”[2]:
| Direction | Specific Measures | Expected Effect |
|---|---|---|
| Market Side | Promote full coverage of baking, catering, and retail markets | Expand revenue sources |
| Market Side | Focus on emerging retail and catering channels | Enhance customer stickiness |
| Market Side | Deeply cultivate sinking markets | Seize incremental market opportunities |
| Product Side | Upgrade baking application oils to clean-label, functional, and high-end products | Regain high gross profit advantage |
| Product Side | Promote domestic substitution of dairy products such as whipped cream and butter | Reduce import dependence |
| Product Side | Expand imported differentiated product categories | Improve product premium capability |
The pre-made baking segment will become an important growth driver:
- Rapidly expand the product matrix around core SKUs
- Enter the frozen cake market
- Strive to build new products into a new growth curve for future performance
- Establish strategic cooperation with upstream suppliers to lock in long-term supply prices
- Promote domestic substitution of some raw materials to reduce import dependence
- Improve comprehensive utilization of by-products to increase efficiency and reduce costs
- Seize the growth opportunities of the Asia-Pacific oil and fat market (CAGR of 4.21% from 2025 to 2032)[3]
- Expand industrial application channels such as biodiesel
- Strengthen overseas market layout to diversify regional risks
- Valuation has a margin of safety: The DCF weighted valuation of $36.56 implies an84% upsiderelative to the current price of $19.87[0]
- Raw material price inflection point is approaching: Palm oil prices are expected to decline in 2026, which will ease cost pressure[3]
- Sufficient financial resilience: Current Ratio of 3.35x, Quick Ratio of 2.45x, strong short-term solvency[0]
- Outstanding defensive attributes: Beta of only 0.53, relatively resistant to market fluctuations[0]
- Uncertainty in the bottoming-out time of performance: 2025 net profit has dropped to a historical low, and it is necessary to observe whether profitability can recover in 2026
- Effectiveness of product structure optimization to be verified: Recovery of market share in high-end baking oil market takes time
- Macroeconomic uncertainty: The pace of terminal consumption recovery affects the speed of revenue recovery
It is recommended to pay attention to the following indicators to verify the profitability recovery process:
| Tracking Dimension | Core Indicator | Monitoring Time Point |
|---|---|---|
| Cost Side | Average purchase price of palm oil and coconut oil | Quarterly |
| Gross Profit Margin | Comprehensive gross profit margin, main business gross profit margin | Quarterly |
| Product Structure | Revenue proportion of baking application oils | Quarterly |
| Revenue Growth | Revenue growth rate, revenue contribution from new channels | Quarterly |
| Cash Flow | Net cash flow from operating activities | Quarterly |
| Scenario | Trigger Condition | Expected Stock Price Performance |
|---|---|---|
Base Scenario |
Raw material prices decline + product structure optimization takes effect | Valuation recovers to the $28-$32 range |
Optimistic Scenario |
Significant improvement on the cost side + new product volume growth + consumption recovery | Valuation recovers to the $40-$50 range |
Pessimistic Scenario |
Raw material prices remain high + consumption continues to slump | Valuation drops to the $15-$18 range |
-
Clear short-term pressure: The significant 2025 performance decline has fully reflected the impact of raw material cost pressure and product structure deterioration, and the stock price is in the bottom area.
-
Marginal improvement expected: With the approaching raw material price inflection point (palm oil prices are expected to decline in 2026) and the company’s active promotion of cost optimization and product upgrading, profitability is expected to improve marginally in 2026.
-
Long-term value remains: The company’s brand and channel advantages in the baking oil sector remain solid. If it can successfully optimize product structure and improve cost control, it is expected to restore historical profitability levels.
-
Attractive valuation: The current price has a significant discount relative to the DCF intrinsic value, with sufficient margin of safety.
- Risk-seeking investors: May consider gradually building positions in the current price range and adding positions on dips to lay out the 2026 valuation recovery opportunity
- Risk-neutral investors: It is recommended to wait for the confirmation of cost-side improvement signals in the 2026 Q1 report before entering
- Risk-averse investors: May pay attention to palm oil price trends and the company’s cost control effectiveness, and take action after a clear inflection point emerges
[1] 2025 Semi-Annual Performance Forecast of Nanqiao Food Group (Shanghai) Co., Ltd. (https://stockmc.xueqiu.com/202507/605339_20250715_FYX5.pdf)
[2] Nanqiao Food: 2025 Full-Year Net Profit Expected to Decline 78.39%-81.99% Year-on-Year - Eastmoney (https://finance.eastmoney.com/a/202601203624819513.html)
[3] S&P Global - Survey: Palm Oil Prices to Weaken in 2026 (https://www.spglobal.com/energy/zh/news-research/latest-news/agriculture/010626-palm-oil-prices-to-weaken-in-2026-biofuel-policy-clarity-crucial-survey)
[4] Well-Known Analyst Reverses Bullish Stance, Believes Palm Oil Prices Will Face Downward Pressure in the Short Term - China Oil Network (https://www.oilcn.com/article/2026/01/01_96965.html)
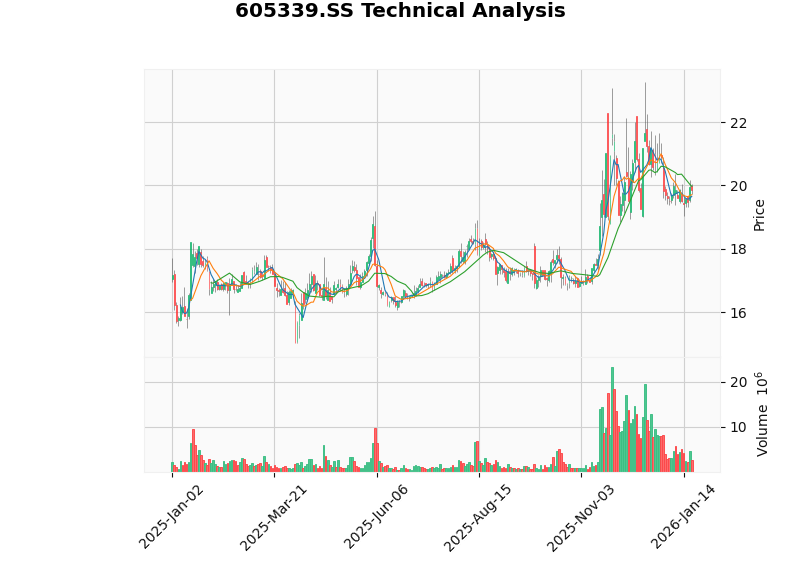
Above: K-line Trend and Technical Indicators of Nanqiao Food (605339.SS) Since 2025
Insights are generated using AI models and historical data for informational purposes only. They do not constitute investment advice or recommendations. Past performance is not indicative of future results.
About us: Ginlix AI is the AI Investment Copilot powered by real data, bridging advanced AI with professional financial databases to provide verifiable, truth-based answers. Please use the chat box below to ask any financial question.