AI Spending Risks Impact on Optical Networking Stocks: Ciena Case Study
Unlock More Features
Login to access AI-powered analysis, deep research reports and more advanced features
About us: Ginlix AI is the AI Investment Copilot powered by real data, bridging advanced AI with professional financial databases to provide verifiable, truth-based answers. Please use the chat box below to ask any financial question.
Related Stocks
Based on comprehensive data analysis, I will now provide a detailed examination of how rising AI spending risks may impact valuations of optical networking and infrastructure stocks, with a focus on Ciena Corporation (CIEN).
Bank of America Securities recently downgraded Ciena Corporation from
- Extreme Valuation Levels: Ciena trades at a P/E ratio of approximately286.6x, representing substantial earnings multiples that leave little margin for error [2]
- Peak Margin Risk: The company may have reached cyclical margin peaks, with limited upside potential
- Order/Backlog Deterioration Risk: Potential for slower order trends and declining backlog levels
- Spending Rationalization: Risk that network providers may delay or reduce capital expenditure as they await demand ramp-up [2]
Despite these concerns, BofA acknowledged that deployment plans among key cloud and neocloud leaders remain intact, suggesting continued underlying demand for optical networking equipment [2].
Ciena has delivered
| Performance Metric | Value |
|---|---|
| 1-Year Return | +173.30% |
| 6-Month Return | +185.20% |
| 3-Month Return | +40.00% |
| Current Price | $241.79 |
| 52-Week Range | $49.21 - $261.13 |
| Market Cap | $34.11 billion |
| Metric | Value | Assessment |
|---|---|---|
| P/E Ratio (TTM) | 278-286x |
Extremely elevated |
| P/B Ratio | 12.57x |
High relative to historical norms |
| P/S Ratio | 7.17x |
Premium valuation |
| EV/OCF | 43.02x |
Steep enterprise value multiple |
The consensus price target of
The optical networking sector’s fortunes are inextricably linked to hyperscaler capital expenditure patterns. Current data reveals a nuanced picture:
| Year | Projected CapEx | Year-over-Year Growth |
|---|---|---|
| 2024 | ~$200 billion | Base year |
| 2025 | $300-350 billion [3][4] |
~50-75% |
| 2026 | $400+ billion [4] |
Growth rate slowing to ~25% |
According to Goldman Sachs Research, while consensus estimates have consistently underestimated AI-related capital expenditure, the
- Amazon (AWS): On pace to exceed$100 billionin CapEx for 2025 [3]
- Microsoft: Raised 2025 CapEx outlook substantially
- Meta: Guides$66-72 billionfor 2025, potentially doubling year-over-year [3]
- Google: Lifted 2025 forecast by $10 billion to approximately$85 billion[3]
The optical networking and communications market is projected to grow from
Technical indicators reveal a stock in consolidation mode with mixed signals:
- Overall Assessment: Sideways/no clear trend
- Trading Range: $236.03 (support) to $250.93 (resistance)
- Beta: 1.14 relative to S&P 500, indicating above-average volatility
| Indicator | Value | Signal |
|---|---|---|
| MACD | No cross | Bearish |
| KDJ | K:58.4, D:56.7, J:61.6 | Bullish |
| RSI (14) | Normal range | Neutral |
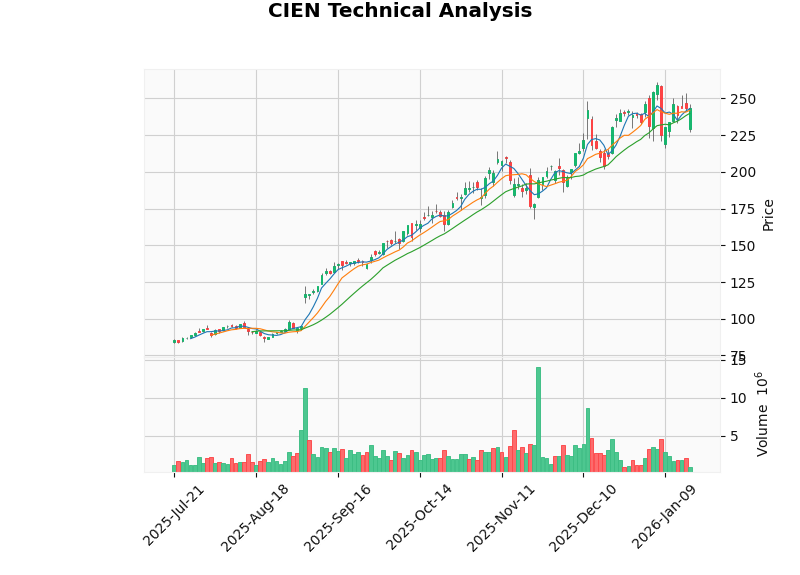
The chart above illustrates Ciena’s recent price action, showing the stock trading near the upper end of its recent range after a substantial rally. The bearish MACD signal combined with neutral RSI suggests caution among technical traders [6].
Ciena’s fundamental financial profile presents a
- Low Debt Risk Classification: The company maintains conservative leverage levels [6]
- Strong Liquidity: Current ratio of 2.73 and quick ratio of 2.09 indicate robust short-term financial health [1]
- Positive Free Cash Flow: Latest FCF of approximately $665 million supports ongoing operations and shareholder returns [6]
- Neutral Accounting Practices: Company maintains balanced accounting without persistent extremes [6]
- EPS: $0.91 actual vs. $0.78 estimate (+16.67% surprise) [1]
- Revenue: $1.35 billion actual vs. $1.29 billion estimate (+4.72% surprise) [1]
- Full-Year Revenue Growth: 18.79% YoY [2]
| Segment | Revenue | % of Total |
|---|---|---|
| Networking Platforms | $941.35M | 77.2% |
| Global Services | $160.26M | 13.1% |
| Software & Services | $117.76M | 9.7% |
The company’s
- Valuation Risk: The extreme P/E multiple of ~286x prices in perfection and leaves no margin for disappointment
- Cyclical Exposure: Optical networking is highly cyclical and dependent on telecom/hyperscaler capital expenditure cycles
- Customer Concentration: Heavy reliance on major cloud providers creates execution risk if any key customer reduces orders
- Margin Peak: Operating margin of 6.52% and net profit margin of 2.59% may have peaked [1]
- Growth Deceleration: Expected slowdown in hyperscaler CapEx growth from 75% to 25% represents a meaningful headwind [4]
- Continued AI infrastructure buildout exceeding expectations
- New product cycle adoption (WaveLogic platforms, Blue Planet software)
- Share repurchase program (completed $361.46 million buyback by December 2025) [7]
- Potential for revenue outperformance driven by data center interconnect demand
- Hyperscaler CapEx slowdown faster than anticipated
- Order deferrals or cancellations from major customers
- Competitive pressure from Cisco (CSCO), Infinera (INFN), and other optical networking vendors
- General rotation away from AI infrastructure stocks [4]
Ciena has significantly outperformed the broader technology sector and market indices:
| Index/Stock | 3-Month Return |
|---|---|
| Ciena (CIEN) | +40.00% |
| S&P 500 | -0.08% |
| NASDAQ Composite | -1.16% |
| Russell 2000 | +4.88% |
| Communication Equipment Sector | Mixed |
The technology sector has shown modest gains (+0.25%), while Ciena’s outperformance reflects its positioning as a key beneficiary of AI infrastructure buildout [8].
The intersection of extreme valuation and emerging AI spending concerns creates a
- Bull Case: Continued AI infrastructure buildout, market share gains, operating leverage improvement
- Bear Case: Valuation compression, customer concentration risk, CapEx deceleration, margin peak
Given the current risk-reward profile following the Bank of America downgrade, a
[1] Company Overview and Financial Data - Retrieved from Financial Database (2026-01-20)
[2] Investing.com - “Ciena stock rating downgraded to Neutral from Buy by BofA Securities” (https://www.investing.com/news/analyst-ratings/ciena-stock-rating-downgraded-to-neutral-from-buy-by-bofa-securities-93CH-4454659)
[3] Fusion Worldwide - “How Hyperscaler Spending Influences Semiconductor Supply Chains” (https://www.fusionww.com/insights/resources/the-cost-of-ai-how-hyperscaler-spending-is-impacting-semiconductor-supply)
[4] Goldman Sachs - “Why AI Companies May Invest More than $500 Billion in 2026” (https://www.goldmansachs.com/insights/articles/why-ai-companies-may-invest-more-than-500-billion-in-2026)
[5] Mordor Intelligence - Optical Networking and Communications Market Analysis (https://www.mordorintelligence.com)
[6] Technical and Financial Analysis - Retrieved from Financial Database (2026-01-20)
[7] Yahoo Finance - “Ciena (CIEN) Is Down 6.3% After AI-Focused Q4 Beat Highlights” (https://finance.yahoo.com/news/ciena-cien-down-6-3-190947586.html)
[8] Sector Performance Data - Retrieved from Financial Database (2026-01-20)
Insights are generated using AI models and historical data for informational purposes only. They do not constitute investment advice or recommendations. Past performance is not indicative of future results.
About us: Ginlix AI is the AI Investment Copilot powered by real data, bridging advanced AI with professional financial databases to provide verifiable, truth-based answers. Please use the chat box below to ask any financial question.