Kimberly Clark (KMB) Defensive Investment Valuation Report
Unlock More Features
Login to access AI-powered analysis, deep research reports and more advanced features
About us: Ginlix AI is the AI Investment Copilot powered by real data, bridging advanced AI with professional financial databases to provide verifiable, truth-based answers. Please use the chat box below to ask any financial question.
Related Stocks
Based on the comprehensive data analysis above, I will provide users with a systematic and detailed
| Basic Information | Data |
|---|---|
| Stock Price (2026-01-20) | $100.49 |
| Market Capitalization | $33.35 billion |
| P/E Ratio (TTM) | 16.93x |
| P/B Ratio | 25.03x |
| Dividend Yield | ~5.1% |
| Beta Coefficient | 0.28 (Extremely Low Volatility) |
| Industry | Home and Personal Care |
KMB’s stock price has experienced a significant pullback over the past year, showing negative returns across multiple time horizons:
| Period | Performance |
|---|---|
| 1 Month | -0.17% |
| 3 Months | -16.76% |
| 6 Months | -21.22% |
| 1 Year | -20.59% |
| 3 Years | -25.65% |
| 5 Years | -23.53% |
The current stock price ($100.49) is in the
| Valuation Metric | KMB | Industry Average | Assessment |
|---|---|---|---|
| P/E (TTM) | 16.93x | ~18-22x | Slightly Below Industry |
| P/S (TTM) | 1.85x | ~1.5-2x | Moderate |
| EV/OCF | 15.24x | ~12-16x | Near Reasonable |
From an absolute valuation perspective, KMB’s current P/E ratio is approximately 17x, which is at the
| Scenario | Intrinsic Value | Upside vs Current Price |
|---|---|---|
Conservative Scenario |
$201.96 | +101.0% |
Base Scenario |
$328.11 | +226.5% |
Optimistic Scenario |
$956.88 | +852.2% |
Probability-Weighted Value |
$495.65 | +393.2% |
- WACC (Weighted Average Cost of Capital): 5.7%
- Terminal Growth Rate: 2.0%-3.0%
- 5-Year Historical Average Revenue Growth Rate: 1.2%
- 5-Year Historical Average EBITDA Margin: 17.8%
DCF analysis indicates that the current stock price
| Assessment Dimension | Rating | Key Findings |
|---|---|---|
Financial Stance |
Neutral | Balanced accounting policies, no extremely aggressive or conservative practices [0] |
Revenue Structure |
Stable | Q3 FY2025 revenue was $4.13B, representing 0.17% YoY growth [0] |
Cash Flow |
Good | Latest free cash flow is $2.513 billion, with strong cash flow generation capacity [0] |
Profitability |
Stable | Net profit margin of 10.9%, operating profit margin of 14.01% [0] |
Debt Risk |
High | Current ratio of 0.77, quick ratio of 0.56, debt-servicing capacity requires attention [0] |
| Profitability Metric | Level | Industry Positioning |
|---|---|---|
| ROE (Return on Equity) | 1.73% | Below Average |
| Net Profit Margin | 10.90% | Above Medium |
| Operating Profit Margin | 14.01% | Stable |
The low ROE is mainly due to the increase in book value caused by recent stock price declines, rather than deteriorating operating performance [0].
- Q3 FY2025 EPS: $1.82 (consensus $1.45),25.52% above expectations
- Q2 FY2025 EPS: $1.92 (consensus $1.67),14.97% above expectations
- Q1 FY2025 EPS: $1.93 (consensus $1.89),2.12% above expectations
- Q4 FY2024 EPS: $1.50 (consensus $1.51),0.66% slightly below expectations
The company has
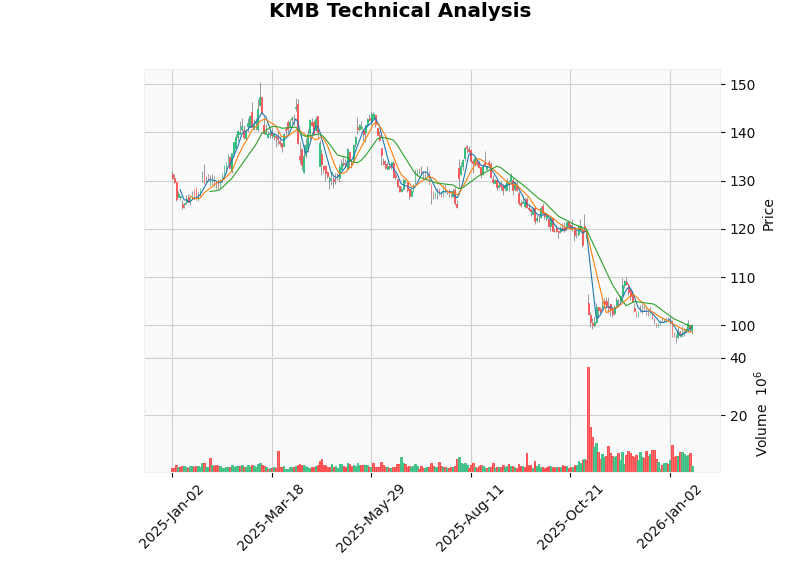
| Technical Indicator | Value | Signal Interpretation |
|---|---|---|
Current Price |
$100.08 | - |
MA20 |
$99.68 | Short-term moving average slightly below current price |
MA50 |
$102.35 | Medium-term moving average acts as resistance |
MA200 |
$122.90 | Long-term moving average is above, stock price is below the long-term trend line |
RSI(14) |
46.09 | In neutral range (30-70), no overbought or oversold signals |
MACD |
-1.17 | Slightly below the signal line (-1.53), weak momentum |
Beta |
0.28 | Extremely low volatility, prominent defensive attributes |
| Indicator | KMB | S&P 500 |
|---|---|---|
| Beta | 0.28 | 1.00 |
| Annualized Volatility | ~15-18% | ~18-22% |
KMB’s Beta coefficient is only 0.28, making it one of the
| Metric | Market Consensus | Prior Value (Q3) |
|---|---|---|
EPS |
$1.39 | $1.82 |
Revenue |
$4.09 billion | $4.13 billion |
Report Date |
2026-01-27 | - |
Note: Market consensus is relatively conservative, and the Q3 beat may be difficult to replicate [0]
Investors should focus on the following metrics:
- Revenue Growth Guidance: Whether positive growth can be achieved
- Gross Margin Trend: Cost pass-through capability
- International Business Performance: Foreign exchange impact and emerging market growth
- Kenvue Merger Progress: Integration timeline and synergies
- 2026 Full-Year Outlook: Management’s adjusted expectations for the future
| Scenario | EPS Performance | Potential Stock Price Reaction |
|---|---|---|
Beat Expectations (> $1.50) |
+8% or more | 3-5% Increase |
Meet Expectations ($1.35-$1.50) |
-3% to +8% | Relatively Stable |
Miss Expectations (<$1.35) |
-3% or more | 3-5% Decrease |
Given that market consensus is already relatively conservative, the probability of
| Item | Details |
|---|---|
Target Company |
Kenvue Inc. (spin-off of Johnson & Johnson’s consumer health business) |
Transaction Structure |
Cash + Stock: $3.50 per share + 0.14625 shares of KMB |
Total Consideration |
~$48.7 billion |
Ownership Stake |
54% for KMB shareholders, 46% for Kenvue shareholders |
Expected Completion Date |
H2 2026 |
Management |
Mike Hsu will serve as Chairman and CEO of the combined company |
- Complementary Product Portfolio: Kenvue offers health care brands such as Tylenol, Band-Aid, and Neutrogena, forming complete coverage with KMB’s personal care products
- Market Scale: The combined company will have annual revenue of approximately $32 billion, becoming a global leader in the health and wellness sector [1]
- Synergies: Expected to achieve cost savings and cross-selling opportunities
- Regulatory Approval: Antitrust review required
- Shareholder Litigation: Some Kenvue shareholders have filed legal challenges against the transaction terms [1]
- Integration Complexity: Execution risks of large-scale mergers and acquisitions
- Financing Costs: Debt financing for the $3.50 per share cash consideration
Institutional Shareholder Services (ISS) has
The consumer staples defensive sector
| Index | 2025 Performance |
|---|---|
| S&P 500 | +19.9% |
| Consumer Staples Select Sector | -6.5% |
- Investor preference for AI-driven high-growth technology stocks
- Weak consumer spending, especially among low-income groups
- Inflationary pressures squeezing corporate profit margins [2][3]
- The Federal Reserve’s interest rate cut cycle has begun, which is beneficial to consumption
- Fiscal stimulus policy (“One Big Beautiful Bill Act”) is expected to boost income for middle- and low-income consumers
- Adoption of GLP-1 weight-loss drugs has slowed, reducing the impact on the food and beverage sector
- Industry-specific headwinds are stabilizing [2][3]
- Low-end consumer spending remains under pressure
- Tariff policy uncertainty
- Intensified competition, limited category expansion
| Advantage | Analysis |
|---|---|
Consumer Staples Attribute |
Products such as diapers, facial tissues, and toilet paper are rigid demands, with low sensitivity to economic cycles |
Brand Moat |
Huggies, Kleenex, etc., are leading brands in their respective segments |
High Dividend |
Dividend yield of ~5.1%, providing stable cash flow returns |
Low Volatility |
Beta of only 0.28, relatively resilient during market declines |
International Business |
Growth potential in emerging markets, geographic diversification reduces single-market risk |
| Institution | Rating | Target Price | Recent Developments |
|---|---|---|---|
Consensus Rating |
Hold | $115.00 | - |
UBS |
Neutral | $107↓ | Downgraded on 2026-01-14 (from $132) |
TD Cowen |
Hold | $105↓ | Downgraded on 2026-01-08 (from $112) |
Wells Fargo |
Equal Weight | $105↓ | Downgraded on 2026-01-05 (from $110) |
Citi |
Sell | $102 | Maintained Sell rating |
- Buy: 29%
- Hold: 61.3%
- Sell: 9.7%
Analysts generally agree that
| Dimension | Score (5-point scale) |
|---|---|
| Absolute Valuation (P/E 17x) | 4.0 |
| Relative Valuation (vs History) | 4.5 |
| DCF-Implied Discount | 5.0 |
| Dividend Yield (5.1%) | 4.5 |
| Risk Type | Level | Explanation |
|---|---|---|
Operating Risk |
Medium | Intense competition in the consumer staples industry, limited pricing power |
Financial Risk |
Medium-High | Low current ratio, merger increases debt burden |
Valuation Risk |
Low | Stock price has fully reflected pessimistic expectations |
Merger Risk |
Medium-High | Execution uncertainty of the Kenvue transaction |
Macro Risk |
Low | Defensive attributes provide protection |
- Ample Downside Protection: The current stock price is only about 4% away from the 52-week low, with limited downward potential
- Attractive Valuation: DCF analysis shows approximately 100%-400% potential upside
- Dividend Provides Cushion: 5.1% dividend yield provides reliable cash flow for investors
- Limited Earnings Risk: Market consensus has been lowered, and a slight beat can provide support
- Merger Creates Value: The Kenvue merger is expected to unlock synergies in the long term
- Short-term stock price may remain under pressure due to market style and consumption data
- The Kenvue merger faces regulatory and execution risks
- Macroeconomic uncertainty may affect consumer spending
Against the backdrop of
| Value Dimension | Conclusion |
|---|---|
Defensive Attributes |
Excellent (Beta 0.28, high dividend, rigid demand) |
Valuation Margin of Safety |
Ample (DCF analysis shows 100%+ discount) |
Earnings Resilience |
Strong (beat EPS expectations for three consecutive quarters) |
Short-Term Catalyst |
Q4 earnings report (January 27) has a high probability of being neutral to positive |
Long-Term Catalyst |
Successful integration of the Kenvue merger |
- Entry Timing: Accumulate positions in batches in the $98-$100 range
- Target Price: Conservative target of $115 (consensus expectation), medium-term target of $130-$150
- Stop-Loss Level: $92 (~8% downside protection)
- Holding Period: 6-12 months (waiting for earnings validation and valuation reversion)
[0] Jinling AI Financial Database - KMB Company Overview, Real-Time Quotes, Financial Analysis, Technical Analysis, DCF Valuation (2026-01-20)
[1] GuruFocus - “Kimberly-Clark (KMB) Announces Strategic Merger with Kenvue Inc.” (2026-01-17) (https://www.gurufocus.com/news/4116270/kimberlyclark-corporation-kmb-announces-strategic-merger-with-kenvue-inc)
[2] Fidelity Institutional - “Consumer Staples Sector Outlook 2026” (https://institutional.fidelity.com/advisors/insights/spotlights/equity-sector-performance-outlook/consumer-staples-sector)
[3] Charles Schwab - “Stock Sector Outlook January 2026” (https://www.schwab.com/learn/story/stock-sector-outlook)
Insights are generated using AI models and historical data for informational purposes only. They do not constitute investment advice or recommendations. Past performance is not indicative of future results.
About us: Ginlix AI is the AI Investment Copilot powered by real data, bridging advanced AI with professional financial databases to provide verifiable, truth-based answers. Please use the chat box below to ask any financial question.