Betting Big on Counter-Cyclical Strategy: In-Depth Analysis of Zijin Mining's RMB 525 Billion Market Cap Surge
Unlock More Features
Login to access AI-powered analysis, deep research reports and more advanced features
About us: Ginlix AI is the AI Investment Copilot powered by real data, bridging advanced AI with professional financial databases to provide verifiable, truth-based answers. Please use the chat box below to ask any financial question.
Related Stocks
Based on the latest market data, financial news, and company announcements, I have prepared this in-depth analysis report on Zijin Mining’s market capitalization growth.
As of January 14, 2026, Zijin Mining (Stock Code: 601899.SS) saw its total market capitalization exceed the RMB 1 trillion mark for the first time, reaching approximately RMB 1.02 trillion, making it the 14th stock with a trillion-RMB market cap in the A-share market[1][2]. Calculated from the share price of RMB 3.15 per share in early 2020, the stock has risen more than 10 times to date; based on its market cap of approximately RMB 350 billion at the beginning of 2025, it grew by about RMB 525 billion to nearly RMB 900 billion throughout the year, with an annual share price increase of 133.09%, ranking among the top gainers in the A-share market for the year[1].
In terms of global mining company rankings, Zijin Mining’s current market cap has surpassed Rio Tinto, making it one of the top three listed metal mining enterprises globally, and placing it in the first echelon of global mining companies alongside BHP[3]. This achievement not only marks the rise of Chinese mining enterprises but also validates the effectiveness of Zijin Mining’s unique strategic model of “counter-cyclical M&A + independent and controllable resources”.
According to Zijin Mining’s 2025 performance forecast, the company expects to achieve net profit attributable to parent shareholders of approximately RMB 51-52 billion for the full year, representing a year-on-year increase of 59%-62% and hitting a new record high[3]. Based on this calculation, the company’s average daily net profit is close to RMB 140 million, reflecting strong profitability.
| Indicator | Value | Industry Comparison |
|---|---|---|
| Market Cap | RMB 989.9 Billion | 3rd in Global Mining |
| P/E (TTM) | 21.71x | Below Industry Average |
| ROE | 30.60% | Significantly Above Industry Average |
| Net Profit Margin | 13.91% | High in the Industry |
| Current Ratio | 1.20 | Good Liquidity |
In 2025, the company seized the historic opportunity of the structural bull market in precious metals, and its main products continued to see volume growth:
- Mineral Gold: Reached 90 tonnes, a year-on-year increase of 23.5%, exceeding the annual target[3]
- Mineral Copper: 1.09 million tonnes, a year-on-year increase of 2%, maintaining steady growth
- Mineral Silver: 480 tonnes
- Lithium Carbonate: Approximately 50,000 tonnes, achieving a breakthrough from zero production
The production growth stems from two factors: first, continuous production increase from existing mines, and second, production capacity contributions from precise and efficient M&As. In April 2025, the company completed the 100% equity delivery of the Akim Gold Mine in Ghana, with an annual gold output of 5.8 tonnes; in October, Zijin Gold International completed the delivery of the Raigorod Gold Mine in Kazakhstan, with an annual gold output of 5.5 tonnes[3].
In 2025, the precious metals market experienced a historic bull market. London spot gold rose by more than 60% for the full year, hitting a record high 50 times, the strongest performance in nearly 40 years; copper prices also broke the $10,000 per tonne mark, hitting a new record high[1]. As China’s largest mineral gold producer and an important global copper producer, Zijin Mining fully benefited from this precious metals bull market.
From the perspective of product price transmission mechanism:
- Rising gold prices directly increase the gross profit margin of the mine’s gold production business
- Rising copper prices contribute significant profit growth to the copper business segment
- Synchronous increases in prices of associated metals such as silver and zinc boost comprehensive earnings
The underlying logic of Zijin Mining’s market cap growth lies in its unique “counter-cyclical M&A” strategy. The company’s Chairman Chen Jinghe boldly deployed and accurately bottom-fished high-quality assets during industry downturns[1][2].
| Time | Target | Amount | Strategic Significance |
|---|---|---|---|
| 2015 | Australia’s Phoenix Gold, Norton Gold Fields, etc. | - | Counter-cyclical expansion during industry winter |
| 2019 | Buriticá Gold Mine in Colombia | CAD 1.33 Billion | Acquired one of the highest-grade gold mines in the world |
| 2021 | Canada’s Neo Lithium Corp. (3Q Salt Lake) | RMB 4.939 Billion | Crossed into the new energy mineral sector |
| 2022 | Lagu Cuo Salt Lake in Tibet | RMB 7.682 Billion | Laid out salt lake lithium resources |
| 2024 | Akim Gold Mine in Ghana | RMB 7 Billion | Increased gold resource reserves |
| 2025 | Zangge Mining (Controlling Stake) | RMB 13.729 Billion | Largest single investment in history |
According to Frost & Sullivan data, from 2019 to 2024, the average acquisition cost of Zijin Mining’s acquired mines was approximately $61.3 per ounce, while the industry average acquisition cost during the same period was approximately $92.9 per ounce, 52% higher than Zijin Mining’s[1]. The low-cost advantage allows it to obtain excess profits during industry booms.
In September 2025, Zijin Mining successfully spun off its overseas gold assets and listed them on the main board of the Hong Kong Stock Exchange, raising HK$28.7 billion, setting the record for the largest IPO in the global gold industry[2][3]. The independent listing of Zijin Gold International not only created an independent “valuation coordinate system” for overseas gold assets but also triggered a full revaluation of the parent company by the capital market.
The ingenuity of this capital operation lies in: using assets that generate 20% of profits to create a global top 4 gold mining listed company with a market cap of nearly HK$400 billion[3]. Through in-depth empowerment of Zangge Mining, its share price has increased by 137% compared to Zijin Mining’s acquisition price, with its market cap exceeding RMB 130 billion[3].
The company has disclosed its 2026 production targets:
- Mineral Gold: 105 tonnes (16.7% increase from 2025)
- Mineral Copper: 1.2 million tonnes (10.1% increase from 2025)
- Lithium Carbonate Equivalent: 120,000 tonnes (140% increase from 2025)
- Mineral Silver: 520 tonnes
If the above targets are completed on schedule, mineral gold production will exceed 100 tonnes two years ahead of the original plan[3]. The certainty of production capacity release comes from:
| Project | Status | Production Capacity Contribution |
|---|---|---|
| Phase II of Xizang Julong Copper Mine | In Joint Commissioning | Annual Copper Output of 300,000-350,000 Tonnes |
| Kamoa Smelter | In Trial Production Phase | Largest Copper Smelter in Africa |
| Lagu Cuo Lithium Salt Lake in Tibet | Put into Production | Salt Lake Lithium Extraction Capacity |
| 3Q Lithium Salt Lake in Argentina | Put into Production | Lithium Carbonate Production Capacity |
| Hunan Xiangyuan Lithium Mine | Put into Production | Lithium Resource Mining |
After the Phase II of Julong Copper Mine reaches full production, the total daily ore processing capacity of Phase I and II will reach 350,000 tonnes, with annual mineral copper output of 300,000-350,000 tonnes, making the Xizang Julong Copper Mine the largest single copper mine in China[3]. After the Kamoa Smelter is put into production, it can save more than $300 million in transportation costs annually[3].
Lithium resources are called the “white oil” for the future and are core raw materials for the new energy industry. Zijin Mining officially entered the lithium resource sector in 2021, and currently controls lithium resources equivalent to 17.88 million tonnes of lithium carbonate, ranking among the top 10 globally[1].
| Asset | Location | Resource Equivalent | Features |
|---|---|---|---|
| 3Q Salt Lake | Argentina | 7.63 Million Tonnes | High Grade, Low Impurities |
| Lagu Cuo Salt Lake | Tibet | 2.14 Million Tonnes | Salt Lake Lithium Extraction |
| Xiangyuan Lithium Mine | Hunan | 2.16 Million Tonnes | Hard Rock Lithium Mine |
| Mami Cuo Salt Lake | Tibet | (Under Zangge) | Salt Lake Lithium Extraction |
| Longmu Cuo Salt Lake | Tibet | (Under Zangge) | Salt Lake Lithium Extraction |
With the continuous high growth of the new energy vehicle and energy storage industries, demand for lithium resources is expected to remain strong. The successive commissioning of the Lagu Cuo Lithium Salt Lake in Tibet, 3Q Lithium Salt Lake in Argentina, and Hunan Xiangyuan Lithium Mine will contribute new profit growth drivers to Zijin Mining[3].
Zijin Mining has currently formed a “1+3” listing platform structure — parent company, Zijin Gold International, Zangge Mining, and Longking Environmental Protection — with a combined market cap of over RMB 1.5 trillion as of January 14, 2026[2].
Key assets in international layout include:
- Kamoa-Kakula Copper Mine in DRC: One of the largest and highest-grade copper mines in the world
- Pech Copper-Gold Mine in Serbia: Europe’s largest copper-gold mine
- Buriticá Gold Mine in Colombia: One of the highest-grade gold mines in the world
- Norton Gold Fields in Australia: Important gold production base
After spinning off Zijin Gold International, the company’s overseas gold assets have an independent financing platform, which is expected to accelerate overseas resource integration through the capital market in the future.
From cyclical divergence to growth recognition, the market’s valuation logic for Zijin Mining is undergoing a fundamental shift. JPMorgan stated in its latest research report that its preference order for the basic materials sector in 2026 is: Copper/Gold > Aluminum > Lithium > Coal > Steel, and Zijin Mining remains its top pick for this year[2].
The company’s current P/E ratio is 21.71x, which is lower than the average valuation level of mining companies. As the market’s recognition of the company’s growth deepens and the precious metals bull market continues, the valuation center is expected to rise further.
Zijin Mining’s performance is highly correlated with gold and copper prices. If precious metals prices experience a sharp correction, it will directly affect the company’s profitability and valuation level. Currently, gold prices are at a historical high, and there is profit-taking pressure in the market.
The company has a high proportion of overseas assets and faces risks such as geopolitical risks, exchange rate fluctuation risks, and local policy change risks. There are uncertainties in the political stability and business environment of some project-host countries.
The lithium resource industry has obvious cyclical characteristics. The sharp drop in lithium carbonate prices from 2022 to 2023 once impacted the industry. Although Zijin Mining laid out its position at a low point, if lithium prices fall sharply again, the contribution of the lithium business may fall short of expectations.
There is certain uncertainty about whether key projects such as Phase II of Julong Copper Mine and Kamoa Smelter can reach full production on schedule. Mining projects often face multiple challenges such as technology, capital, and personnel from construction to commissioning.
| Indicator | Value | Signal |
|---|---|---|
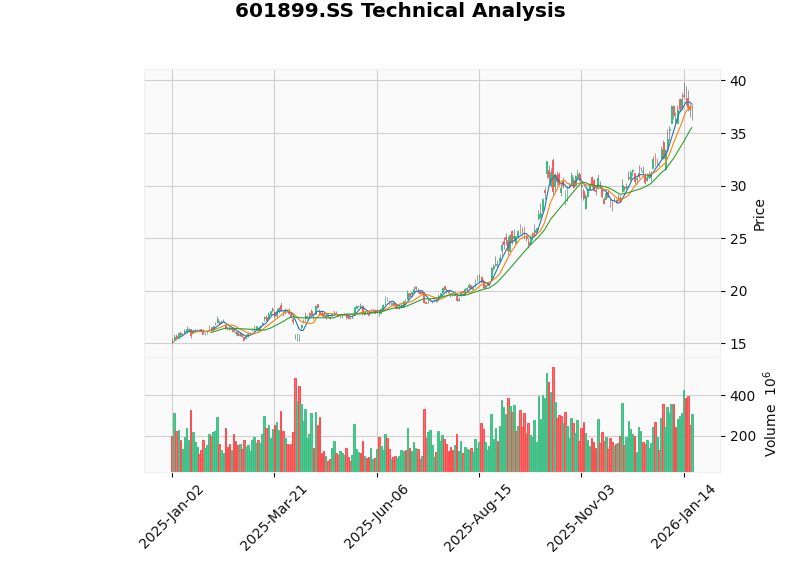
| Latest Closing Price | RMB 37.31 | - |
| 52-Week Range | RMB 15.19 - 39.85 | Close to Historical High |
| MACD | No Death Cross | Neutral Bullish |
| KDJ | K:50.4, D:64.1, J:23.0 | Neutral Bearish |
| RSI (14) | Normal Range | - |
| Beta | 1.35 | Higher Than Market Volatility |
| Support Level | RMB 35.53 | - |
| Resistance Level | RMB 38.03 | - |
From a technical perspective, Zijin Mining is currently in a sideways consolidation phase, with its share price fluctuating within the range of RMB 35.53 - 38.03. The KDJ indicator shows short-term adjustment needs, but the medium-term upward trend remains unchanged. Considering the Beta coefficient of 1.35, the company’s share price has higher volatility than the market, and it has strong excess return capabilities in a precious metals bull market.
The surge in Zijin Mining’s market cap is the result of the resonance of three factors: “strategic vision + execution capability + industry cycle”:
- Strategic Vision: Chen Jinghe carried out counter-cyclical M&As during industry downturns to lock in high-quality resources at low costs
- Execution Capability: Efficiently integrated acquired assets to achieve rapid production capacity release
- Industry Cycle: 2025 precious metals super bull market brought simultaneous growth in volume and price
From the following dimensions, Zijin Mining’s growth has certain sustainability:
| Dimension | Analysis | Conclusion |
|---|---|---|
| Resource Reserves | 73.72 million tonnes of copper, 3,117 tonnes of gold, ranking among global leaders | Long-Term Guarantee |
| Production Capacity Plan | Clear 2026 production targets | High Growth Certainty |
| Lithium Business | Production capacity just released, contribution just started | Second Growth Curve |
| Valuation | 21x P/E, below industry average | Room for Improvement |
| Capital Operation | Strong capabilities in spin-off listing and M&A integration | Continuous Value Creation |
Investors need to pay attention to the following risks: precious metals price correction risk, overseas operation risk, lithium industry cycle risk, and project commissioning schedule risk. The current share price is close to the historical high, so caution is advised when chasing highs.
From RMB 3.15 in 2020 to RMB 39.85 in 2026, Zijin Mining achieved a 10-fold increase in share price over six years. Standing at the new starting point of a trillion-RMB market cap, the company is still expected to maintain a high growth rate in the future, relying on low-cost resource reserves accumulated through “counter-cyclical M&As”, capital operation capabilities of the “1+3” listing platform, and the second growth curve of lithium resources.
As Zheng Youcheng, the company’s Secretary of the Board, said: “Many people consider Zijin Mining a cyclical industry, but the company is a highly growth-oriented enterprise.” The shift in the capital market’s perception of Zijin Mining from cyclical divergence to growth recognition may have just begun[2].

[1] Weikehao - “Surge of RMB 525 Billion! ‘Gold King’ Zijin Mining Earns Over RMB 51 Billion Annual Net Profit” (https://mp.ofweek.com/ai/a556714890637)
[2] The Paper - “Maintaining a Stable Trillion-RMB Market Cap! Zijin Mining Rises to 2nd Place in Global Mining” (https://m.thepaper.cn/newsDetail_forward_32398041)
[3] Zijin Mining Official Website - “Zijin Mining Expects to Achieve Net Profit Attributable to Parent Shareholders of Approximately RMB 51-52 Billion in 2025, a Year-on-Year Increase of 59%-62%” (https://www.zjky.cn/news/news-detail-122505.htm)
[0] Jinling AI Financial Database (Real-Time Market, Financial Data, Technical Analysis)
至信股份(603352)财务风险深度分析报告
Insights are generated using AI models and historical data for informational purposes only. They do not constitute investment advice or recommendations. Past performance is not indicative of future results.
About us: Ginlix AI is the AI Investment Copilot powered by real data, bridging advanced AI with professional financial databases to provide verifiable, truth-based answers. Please use the chat box below to ask any financial question.