Analysis of the Revenue Driving Effect of Tourism Industry Recovery on OTA Platforms
Unlock More Features
Login to access AI-powered analysis, deep research reports and more advanced features
About us: Ginlix AI is the AI Investment Copilot powered by real data, bridging advanced AI with professional financial databases to provide verifiable, truth-based answers. Please use the chat box below to ask any financial question.
Related Stocks
Based on the in-depth data collection and analysis above, we now present a systematic research report on
The full recovery of the tourism industry has formed a significant revenue driving effect on OTA (Online Travel Agency) platforms. According to data, China’s comprehensive tourism market recovery index has rebounded from its low in 2020 to an estimated 135 in 2025 (with 2019 as the baseline of 100), and both outbound and inbound tourism have exceeded pre-pandemic levels[1]. Against this backdrop, OTA platforms represented by Trip.com Group have achieved strong performance growth: Trip.com’s revenue reached RMB 53.3 billion in 2024, a year-on-year increase of approximately 20%; its revenue in the first three quarters of 2025 reached RMB 47 billion, maintaining a high year-on-year growth rate of 16%[2]. In terms of international business, the total bookings of Trip.com’s international OTA platform increased by approximately 60% year-on-year, inbound tourism bookings increased by over 100% year-on-year, and outbound hotel and flight bookings have climbed to 140% of the same period in 2019[3].
In terms of profitability, Trip.com has demonstrated astonishing profit margins, with a net profit margin of 52.16% in Q3 2025, far exceeding its international peers. This is due to the continuous release of tourism demand on the one hand, and its strong position in the industrial chain on the other. However, such high profit margins have also attracted regulatory attention, and Trip.com was subject to an antitrust filing by the State Administration for Market Regulation in January 2026[4].
| Year | Domestic Tourism Index | Outbound Tourism Index | Inbound Tourism Index |
|---|---|---|---|
| 2020 | 50 | 10 | 20 |
| 2021 | 70 | 20 | 35 |
| 2022 | 85 | 30 | 45 |
| 2023 | 105 | 75 | 80 |
| 2024 | 120 | 100 | 110 |
| 2025E | 135 | 125 | 140 |
From the perspective of the recovery process, domestic tourism recovered first, surpassing pre-pandemic levels in 2023; outbound tourism fully recovered to the same period in 2019 in 2024; inbound tourism showed an even stronger growth momentum, and is expected to be 40 percentage points higher than that in 2019 in 2025[5].
| Indicator | 2023 | 2024 | First Three Quarters of 2025 |
|---|---|---|---|
| Operating Revenue | RMB 44.5 billion | RMB 53.3 billion | RMB 47 billion |
| Year-on-Year Growth Rate | 22% | 20% | 16% |
| Net Profit | RMB 9.9 billion | RMB 17.2 billion | RMB 29 billion |
| Net Profit Margin | 22.2% | 32.3% | 61.7% |
| Gross Profit Margin | 80% | 81% | 81.55% |
- Q3 2025: Revenue of RMB 18.3 billion, +16% YoY, +24% QoQ
- Q3 2025 Net Profit: RMB 19.9 billion, +192.6% YoY (including a one-time gain of RMB 17 billion from the sale of shares in India’s MakeMyTrip)
| Segment | Revenue | Proportion | Gross Profit Margin |
|---|---|---|---|
| Accommodation Bookings | RMB 24.5 billion | 46% | 85% |
| Transportation Ticketing | RMB 18 billion | 34% | 60% |
| Tourism & Vacation | RMB 5.5 billion | 10% | 70% |
| Business Travel Management | RMB 3.5 billion | 7% | 75% |
- Total bookings on the international OTA platform increased by approximately 60% YoY
- Inbound tourism bookings increased by over 100% YoY
- Outbound hotel and flight bookings recovered to 140% of the same period in 2019
| Platform | Market Capitalization (USD 100 million) | Revenue (USD 100 million) | Net Profit Margin | Price-to-Earnings Ratio |
|---|---|---|---|---|
| Trip.com (TCOM) | 40.03 | 75.3 | 52.16% | 9.01x |
| Booking (BKNG) | 98.5 | 18.2 | 26.4% | 28.5x |
| Expedia (EXPE) | 32.34 | 13.2 | 9.66% | 24.63x |
| Airbnb (ABNB) | 80.96 | 10.9 | 22.03% | 30.92x |
- Unique Advantages of Trip.com:With a P/E ratio of 9.01x and a net profit margin of 52.16%, Trip.com demonstrates significant value depression characteristics and outstanding profitability in the global OTA industry[8].
- Differences in International Business Growth:Leveraging the recovery of China’s outbound tourism, Trip.com achieved stable revenue growth of 16%, while Western OTA platforms face challenges of market saturation. In full-year 2025, Expedia’s stock price rose by 55.6%, while Booking’s only rose by 10.3%[9].
- Profitability Differentiation:Trip.com’s gross profit margin is over 80%, far exceeding that of major internet companies such as Tencent (56%) and NetEase (64%), reflecting its strong bargaining power in the tourism industry chain.
As an important member of the Trip.com ecosystem, Tongcheng Travel continued to maintain a good growth momentum in Q3 2025:
- Favorable business expansion progress and continuous optimization of profitability
- Outstanding performance in the sinking market and short-distance tourism niche
- Outbound tourism and hotel management businesses contribute incremental growth momentum
OTA platforms have low marginal costs. As transaction scale expands, unit costs are diluted, and profitability shows non-linear growth. Trip.com’s net profit in the first three quarters of 2025 reached RMB 29 billion, exceeding its full-year 2024 revenue scale.
| Platform | GMV Market Share | Features |
|---|---|---|
| Trip.com Ecosystem (including Qunar, Tongcheng) | 72% | Absolute leader, focusing on mid-to-high-end market |
| Meituan Hotel & Travel | 13% | Traffic advantage in local life services |
| Fliggy | 8% | Synergy with Alibaba ecosystem |
| Douyin | 3% | Emerging player, content-driven user acquisition |
| Others | 6% | Vertical niche platforms |
Trip.com holds the top position in the industry with a 56% GMV market share; when combined with Tongcheng’s 13% market share, the overall market share of the “Trip.com Ecosystem” reaches as high as 72%[11].
On January 14, 2026, Trip.com was subject to an antitrust filing by the State Administration for Market Regulation, facing a maximum fine of 10% of its previous year’s turnover (approximately RMB 4.7 billion). Regulatory pressure may force the platform to adjust its business model and reduce commission rates for merchants[13].
- New players such as Douyin and JD continue to exert efforts, and price wars may reignite
- Hotels and airlines strengthen the construction of direct sales channels, increasing the proportion of direct sales
- Merchants’ resistance to high commission rates is increasing
- If the macroeconomy declines, residents’ tourism consumption may contract
- The hotel industry’s RevPAR (Revenue Per Available Room) is under pressure, which may affect OTA commission income
- Fluctuations in flight ticket prices affect transportation ticketing revenue
| Indicator | Trip.com (TCOM) | Industry Average |
|---|---|---|
| Price-to-Earnings Ratio (P/E) | 9.01x | 25x |
| Price-to-Book Ratio (P/B) | 1.67x | 5x |
| PEG | 0.56 | 1.0 |
Trip.com’s current P/E ratio is only 9x, at a historical low, reflecting the market’s discount due to regulatory risks. However, from a fundamental perspective, the company’s profitability far exceeds the industry average.
- Median Target Price:USD 81, representing a 32.2% upside potential from the current price (USD 61.25)[14]
- Proportion of Buy Ratings:72.1% (31 analysts)
- Consensus Rating:83 (Strong Buy)
- Certainty of revenue growth brought by the continuous recovery of the tourism industry
- Super-strong profitability reflected by a 52% net profit margin
- High growth potential of international business (driven by both outbound and inbound tourism)
- Cash reserve of RMB 107.7 billion provides sufficient safety margin
- Uncertainty of antitrust investigations
- Competitive pressure from new players such as Douyin and JD
- Unsustainability of one-time investment gains (Q3 2025 net profit includes RMB 17 billion in investment gains)
- Tourism industry recovery strongly drives OTA revenue:China’s comprehensive tourism market recovery index has reached 135, with both outbound and inbound tourism exceeding pre-pandemic levels, directly driving the growth of OTA platform transaction volumes.
- Trip.com is the main beneficiary:As the industry leader, Trip.com achieved revenue of RMB 53.3 billion in 2024 with a net profit margin of as high as 52%. Its 48.3% market share in outbound tourism and over 100% growth in inbound tourism bookings make it the biggest winner of tourism recovery.
- Profitability exceeds expectations but has hidden concerns:Trip.com’s high profit margin is based on its strong bargaining power with upstream and downstream players in the industry chain, and regulatory risks and merchants’ rights protection may change this pattern.
- Valuation is at a historical low:The 9x P/E ratio and 32% upside potential provide a good safety margin, but attention should be paid to the evolution of regulation and competitive landscape.
[1] SPD International, May 2025, China OTA Industry Analysis Report: Sinking and Niche Tracks Drive Sustainable Industry Growth
[2] Trip.com Group Q3 2025 Financial Report and 2024 Annual Report
[3] Trip.com Group Official Announcements and Earnings Conference Call Transcripts
[4] Announcement of the State Administration for Market Regulation on January 14, 2026
[5] Fastdata, 2024 China Outbound Tourism Industry Development Trend Report
[6] Gilin AI Financial Database - Trip.com (TCOM) Financial Analysis
[7] Gilin AI Financial Database - Trip.com (TCOM) Company Profile
[8] Gilin AI Financial Database - Global OTA Platform Comparison
[9] Financial Content, Booking Holdings Lags in 2025
[10] Securities Times, Trip.com Group’s Stock Plunges Over 18% After Being Subject to Antitrust Filing by Market Regulator
[11] BOCOM International Research Report Data
[12] Phoenix Net Finance, Antitrust Filing, RMB 360 Billion Giant Hits a Super Mine
[13] The Paper, Trip.com Subject to Antitrust Filing: “Profit King” Earning RMB 216 Million Daily Faces Strictest Scrutiny
[14] Gilin AI Financial Database - Trip.com (TCOM) Analyst Ratings
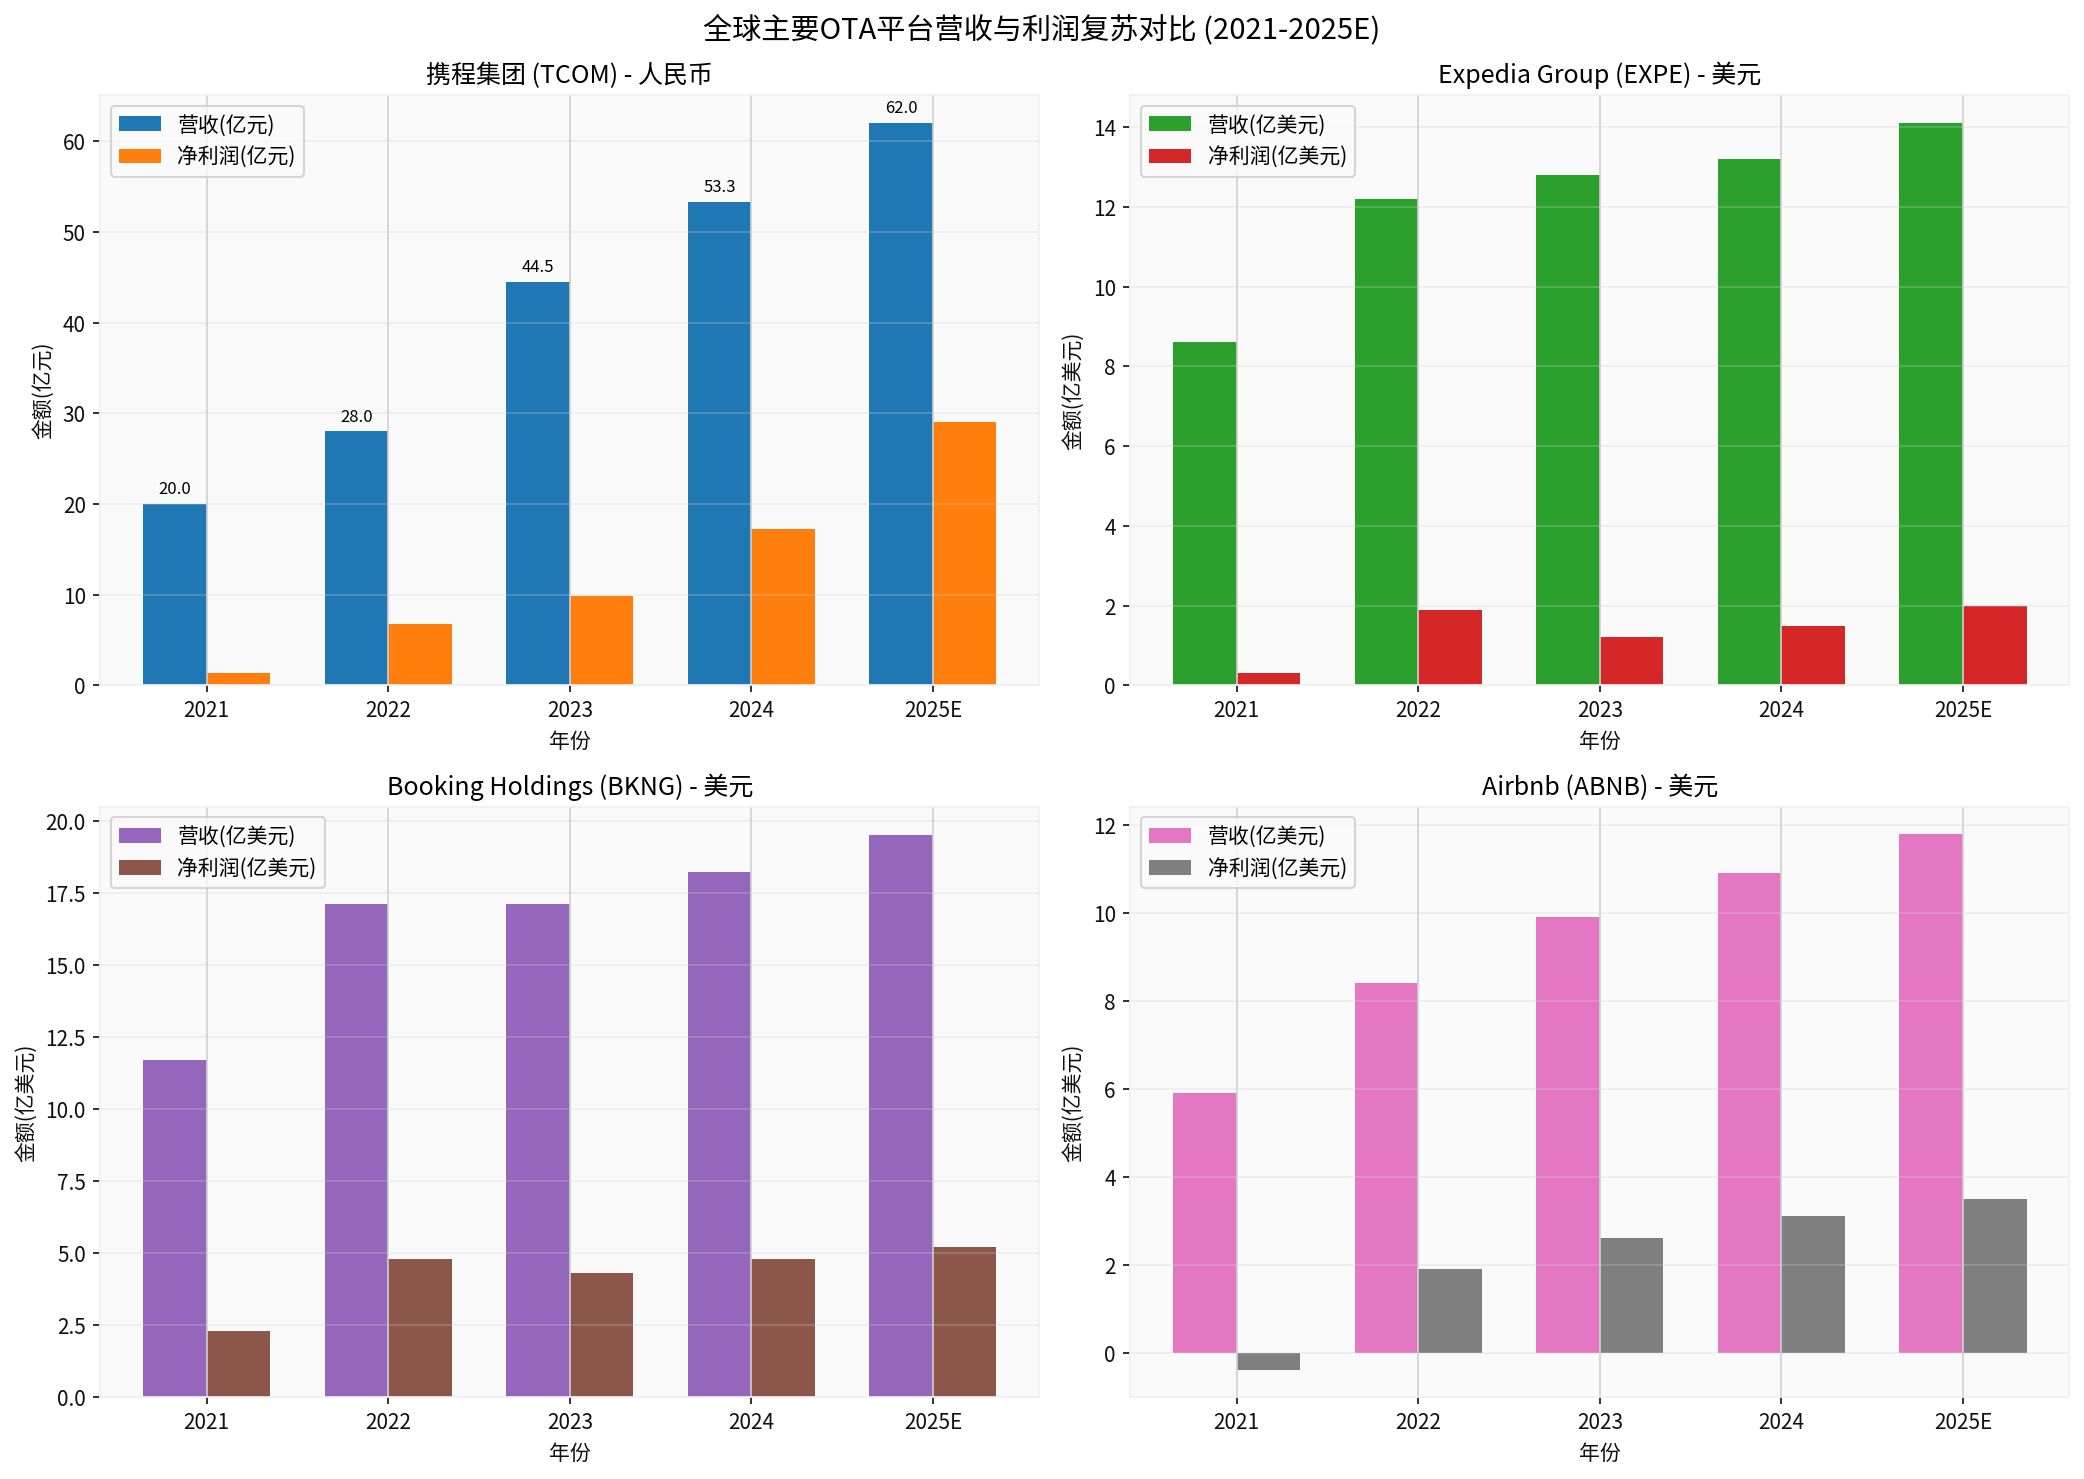
The chart above shows the estimated revenue and profit recovery trends of four major global OTA platforms: Trip.com, Expedia, Booking, and Airbnb, from 2021 to 2025. Trip.com is denominated in RMB, while other platforms are denominated in USD. The chart clearly shows Trip.com’s strong recovery momentum after the pandemic and its profit performance far exceeding that of international peers.
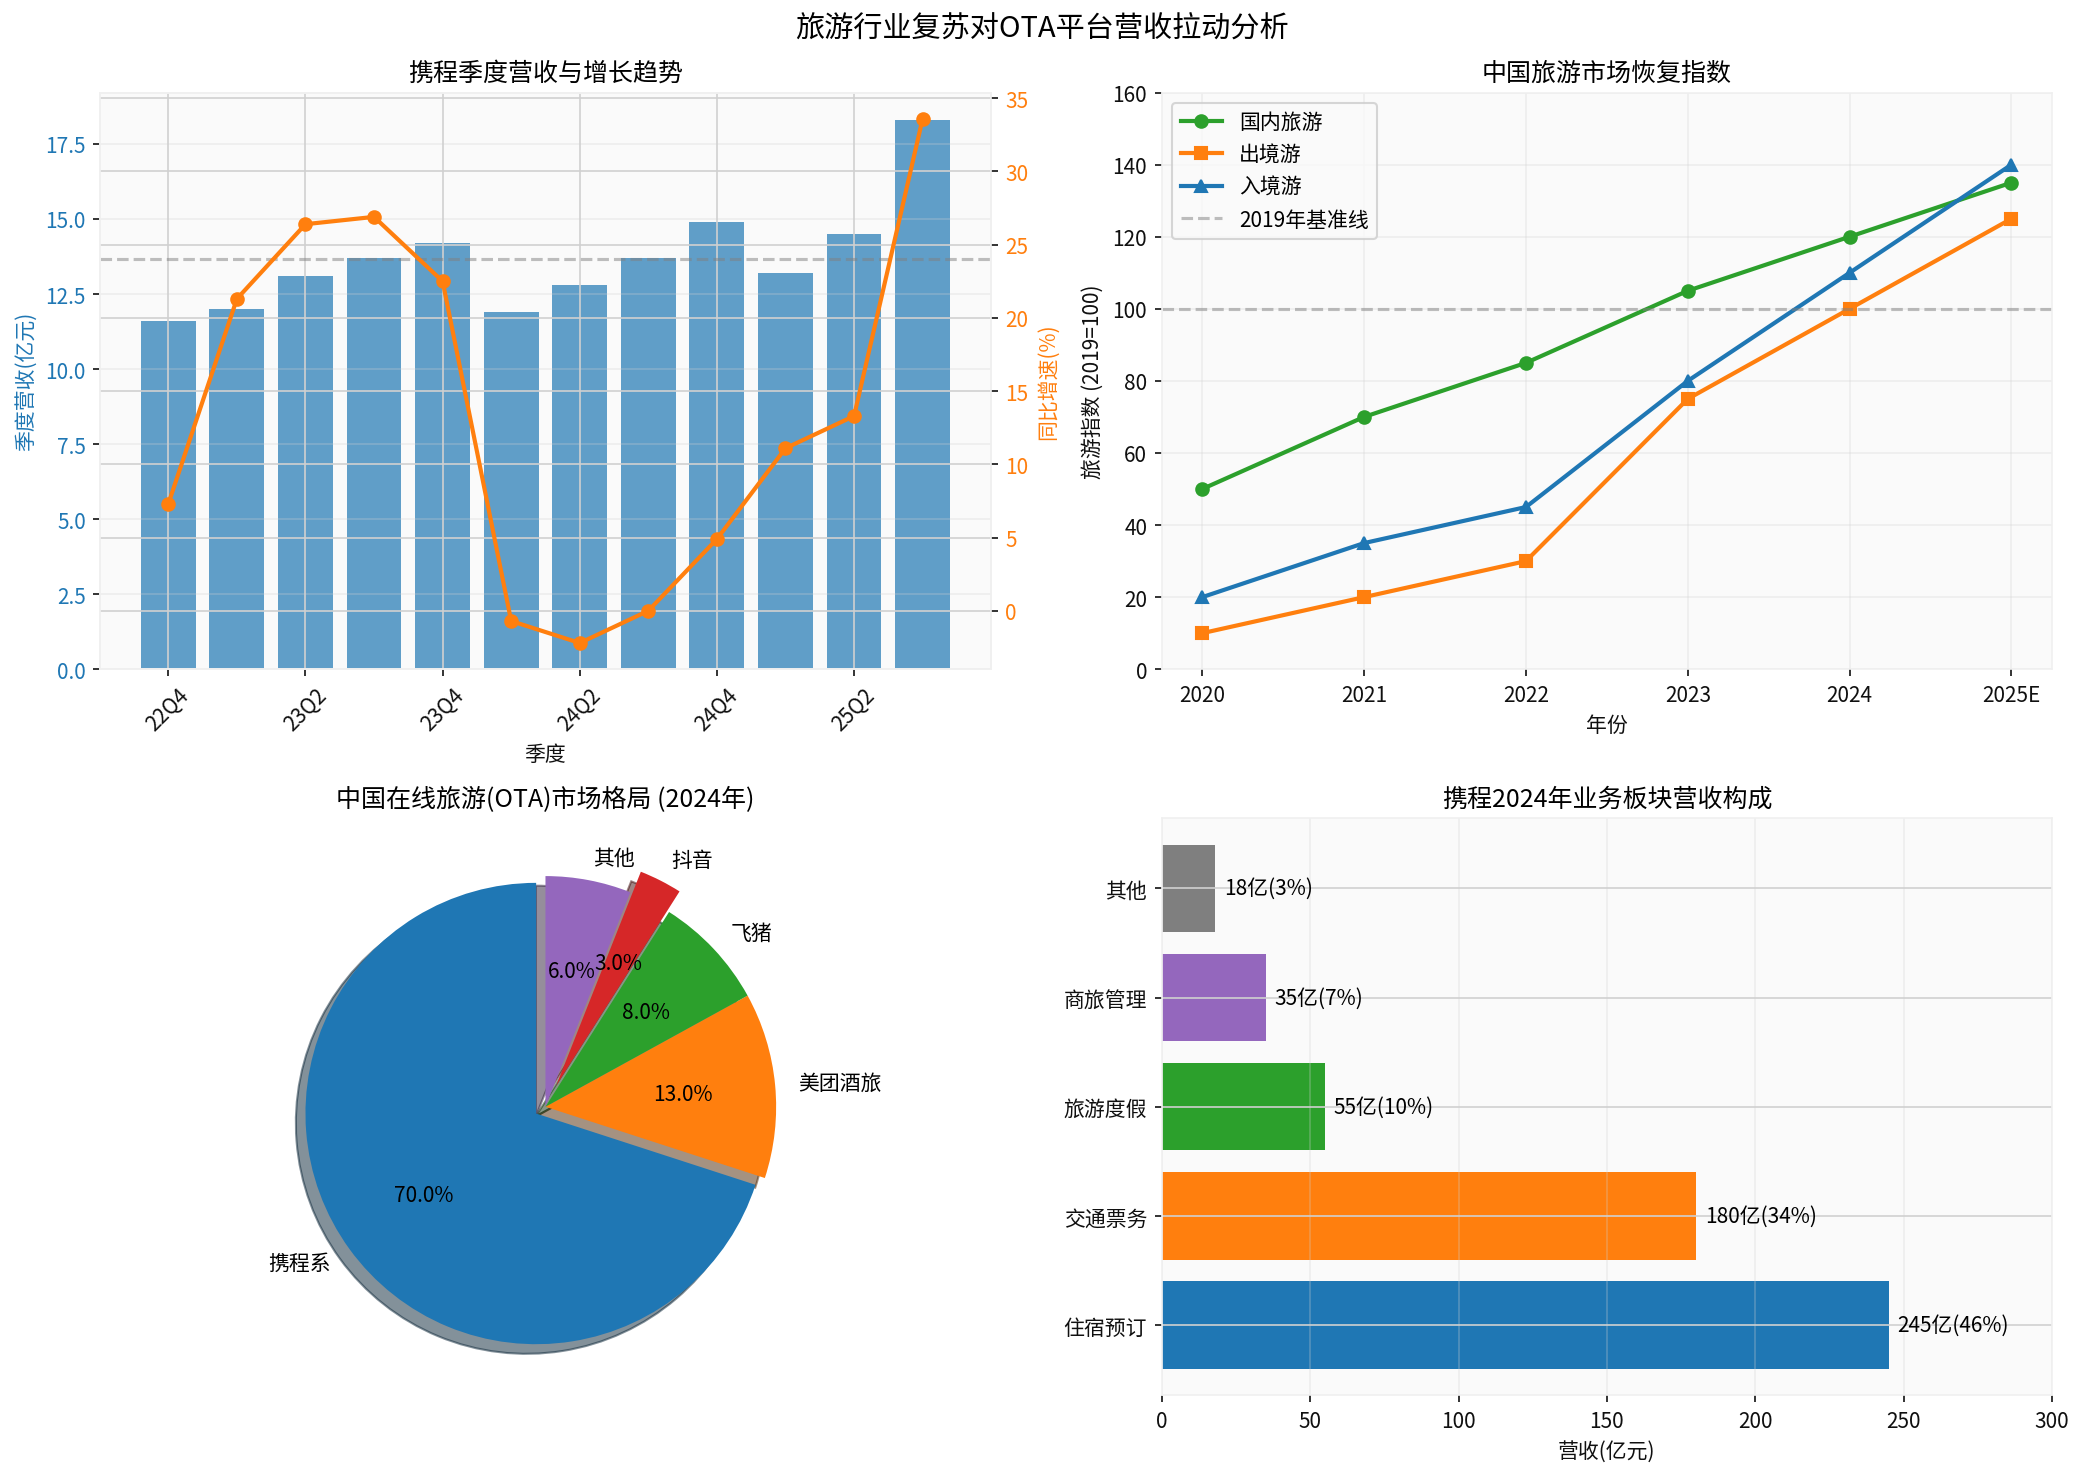
The chart above includes four sub-charts:
- Trip.com Quarterly Revenue and Growth Trend - Showing the revenue recovery path from Q4 2022 to Q3 2025
- China Tourism Market Recovery Index - Recovery process of three curves: domestic, outbound, and inbound
- China OTA Market Landscape - Pie chart showing the 70% market share of the Trip.com ecosystem
- Trip.com Business Segment Revenue Composition - 46% from accommodation bookings, 34% from transportation ticketing, etc.
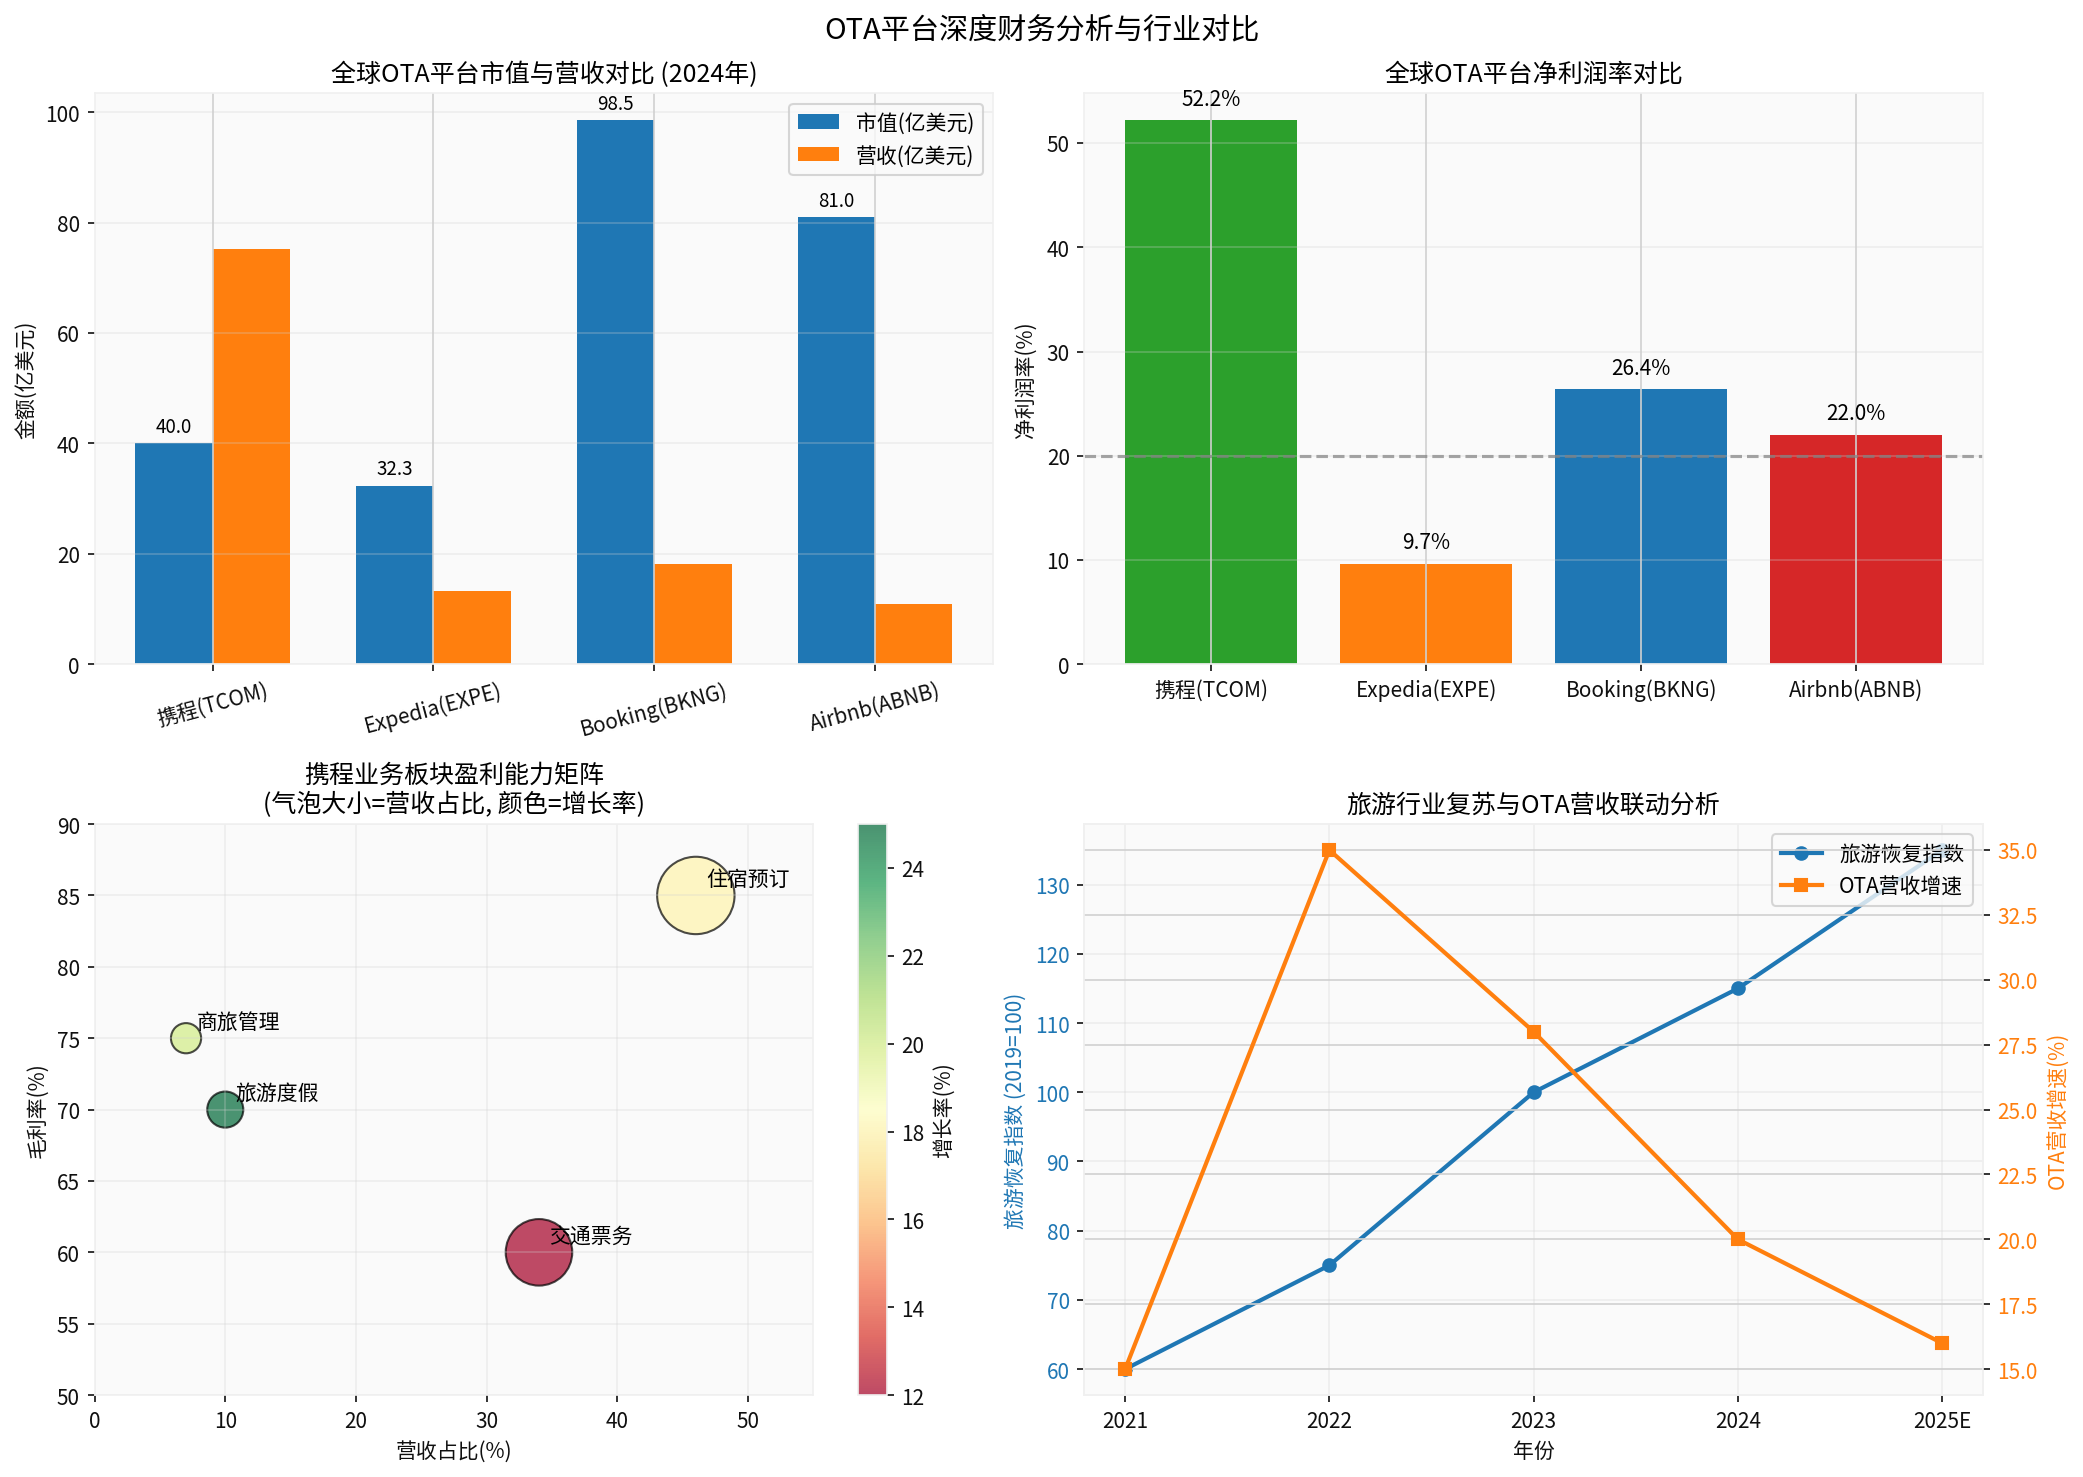
The chart above provides in-depth financial analysis:
- Comparison of market capitalization and revenue of global OTA platforms
- Net Profit Margin Comparison - Trip.com leads with 52.16%
- Trip.com Business Segment Profitability Matrix
- Correlation Analysis of Tourism Recovery Index and OTA Revenue Growth Rate
For more detailed individual stock analysis, company valuation, or industry comparison reports, it is recommended to enable the
贵州茅台(600519) 估值与业绩增速匹配度深度分析
Insights are generated using AI models and historical data for informational purposes only. They do not constitute investment advice or recommendations. Past performance is not indicative of future results.
About us: Ginlix AI is the AI Investment Copilot powered by real data, bridging advanced AI with professional financial databases to provide verifiable, truth-based answers. Please use the chat box below to ask any financial question.