In-Depth Analysis of Zijin Mining's Investment Value: Multi-Metal Mining Leader with 9 Consecutive Years of Growth in a Decade, Significantly Undervalued at 12x PE
Unlock More Features
Login to access AI-powered analysis, deep research reports and more advanced features
About us: Ginlix AI is the AI Investment Copilot powered by real data, bridging advanced AI with professional financial databases to provide verifiable, truth-based answers. Please use the chat box below to ask any financial question.
Related Stocks
Based on multi-dimensional data analysis, I now present to you an in-depth investment analysis report on Zijin Mining (601899.SS).
Zijin Mining is one of China’s largest mining companies and also one of the world’s most influential multinational mining giants. Its main business covers the exploration, mining, smelting and sales of multi-metal mineral resources such as gold, copper, zinc, lithium, molybdenum, etc. According to the latest data, the company’s market capitalization has reached approximately
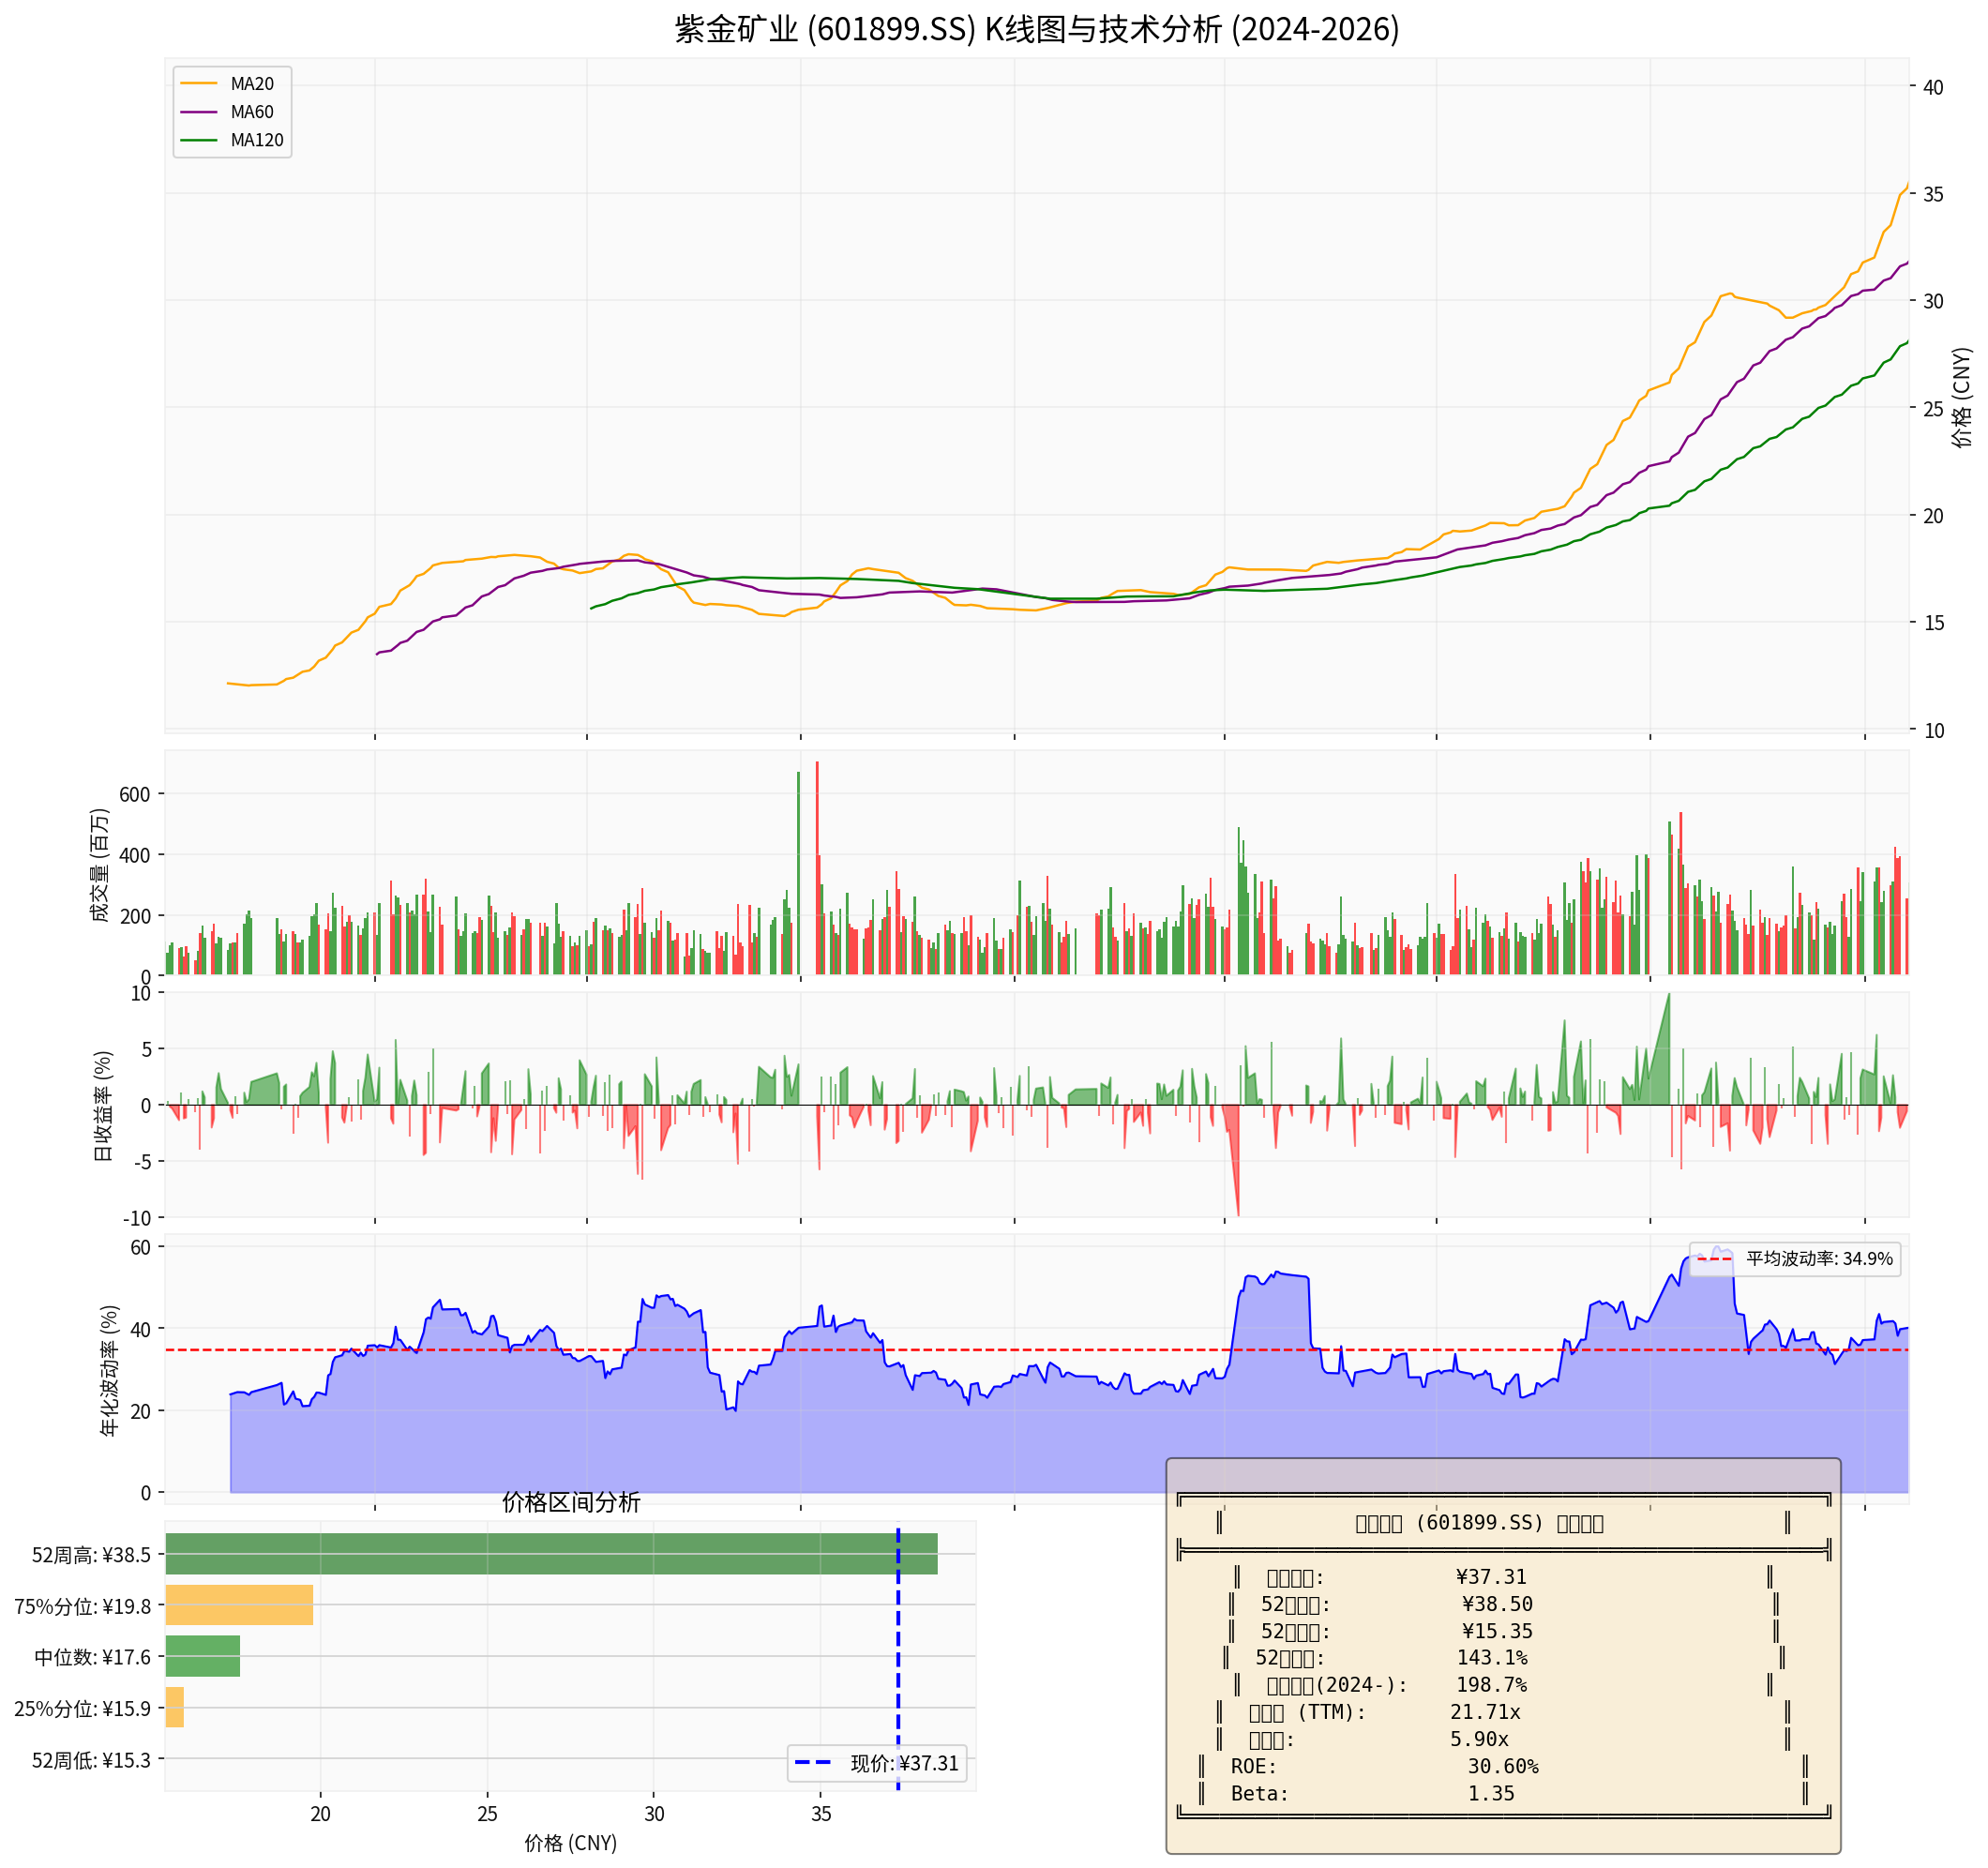
As can be seen from the K-line chart, Zijin Mining’s stock price has risen from approximately RMB 12.4 at the beginning of 2024 to the current RMB 37.31, with a cumulative increase of
Zijin Mining has industry-leading mineral resource reserves:
| Mineral Type | Resource Volume/Production Capacity | Industry Position |
|---|---|---|
| Gold (Mined) | ~90 t/year (2025) | Accounts for 24% of China’s total mined gold output |
| Copper (Mined) | ~1.09 million t/year (2025) | Accounts for 65% of China’s total copper output |
| Zinc (Lead) | 12.98 million t in proven reserves | 4th globally, 1st in China |
| Lithium Resources | 17.88 million t LCE | “Two Lakes and Two Mines” layout |
| Molybdenum Resources | 4.94 million t in proven reserves | Shapinggou Molybdenum Mine in Anhui is the world’s largest |
The company’s unique
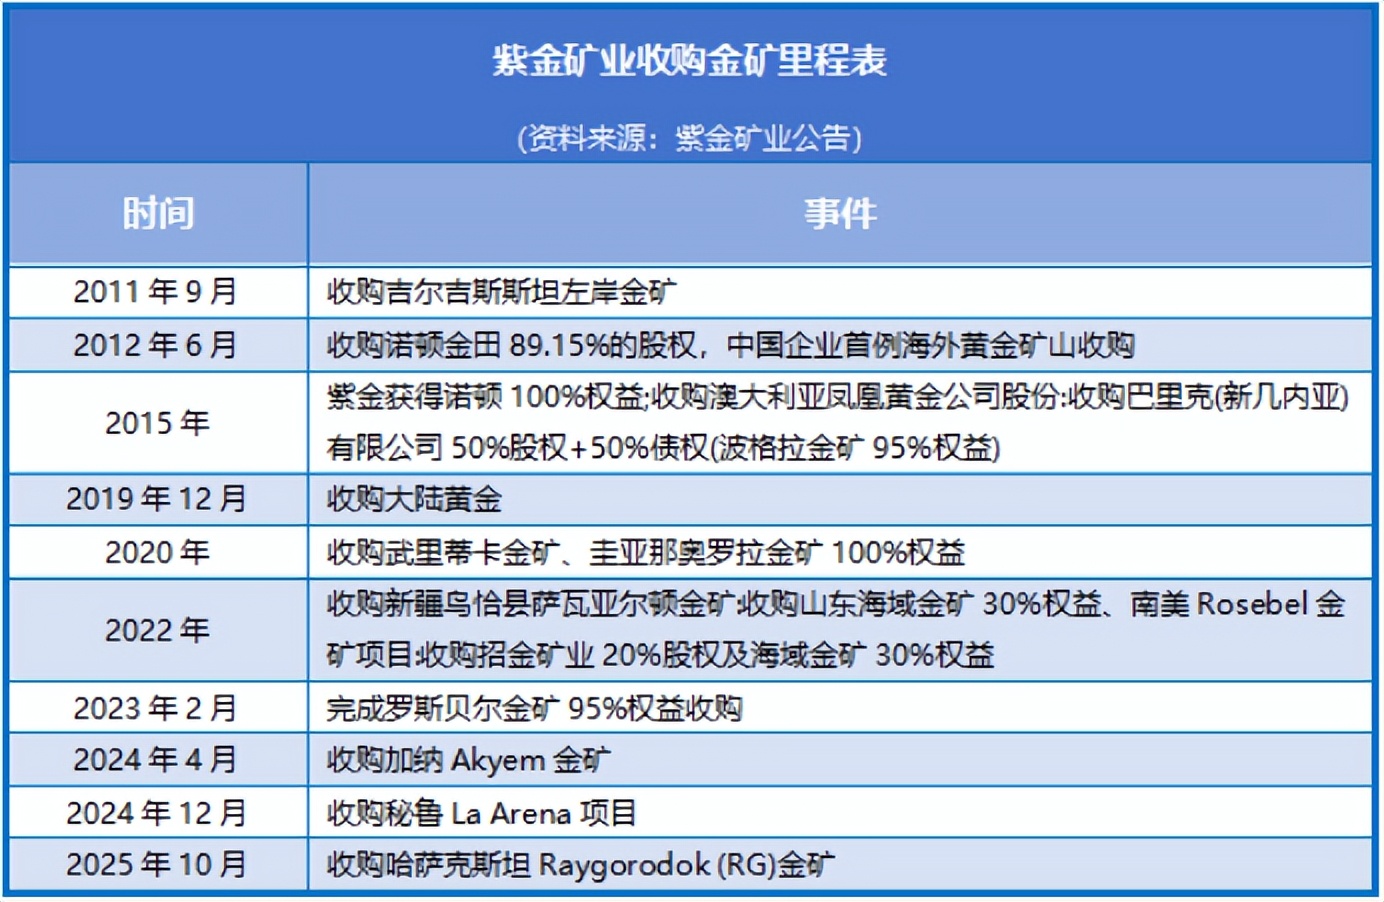
Zijin Mining’s M&A strategy is textbook-worthy:
- Acquisition of Tibet Cangge Mining in 2025: Achieved absolute control of the Julong Copper Mine, and the target’s stock price has increased by137%compared to the acquisition price
- Ghana’s Akim Gold Mine, Kazakhstan’s Raigorod Gold Mine: Rapidly expanded gold production capacity
- Cooperation with Jinduicheng Molybdenum Co., Ltd. in 2026: Transferred 24% equity of the Shapinggou Molybdenum Mine in Jinzhai, Anhui for RMB 1.731 billion, partnering with Jinduicheng Molybdenum to fill the gap in molybdenum smelting and deep processing
The M&A projects contributed a total of over
From 2015 to 2024, Zijin Mining achieved 9 consecutive years of earnings growth, creating a miracle in the non-ferrous metals industry:
| Indicator | 2015 | 2024 | Growth Multiple | CAGR (Compound Annual Growth Rate) |
|---|---|---|---|---|
| Net Profit Attributable to Shareholders | RMB 1.656 billion | RMB 32.1 billion | 19.4x |
34.9% |
| Revenue | — | — | — | 16.93% |
2025 is an exceptional year with both volume and price surges:
- Mined gold output is approximately 90 tonnes, a year-on-year increase of23%
- Mined copper output is approximately 1.09 million tonnes, growing steadily
- The annual increase in international gold prices exceeded 67%, and the LME copper price increased by42%
- Net profit attributable to shareholders is expected to reach RMB 51-52 billion
The company’s market capitalization crossed four RMB 100 billion milestones within the year, approaching the RMB 1 trillion threshold at one point [1][2].
| Financial Indicator | Value | Industry Comparison |
|---|---|---|
| ROE (Return on Equity) | 30.60% |
Far exceeds industry average |
| Net Profit Margin | 13.91% |
At a historical high |
| Gross Profit Margin | Approximately 20% |
Gross profit margin of gold and copper businesses is better |
| Asset-Liability Ratio | Medium level | Sound financial status |
Financial analysis shows that the company adopts a
| Mineral Type | 2025 Actual | 2026 Target | Growth Rate |
|---|---|---|---|
| Mined Gold | ~90 t | 105 t |
+17% |
| Mined Copper | ~1.09 million t | 1.2 million t |
+10% |
- Papua New Guinea’s Porgera Gold Mine: Full resumption of production, expected to contribute approximately 5 tonnes of attributable output
- Suriname’s Rosebel Gold Mine: Annual gold output will reach 10 tonnes after completion of technical transformation
- Haiyu Gold Mine: Commissioned at the end of 2025, with stable gold output of 15-20 tonnes in 2026
- Ghana’s Akim Gold Mine, Xinjiang’s Sawayaerden Gold Mine: Full production release
- Phase II of Tibet Julong Copper Mine: Completed and commissioned at the end of 2025, adding 110,000 tonnes of capacity after reaching full production
- Phase III of Kamoa-Kakula Copper Mine in the Democratic Republic of the Congo: Trial production
- Serbia’s Timok Copper-Gold Mine, Bor Copper Mine: Technical transformation completed
- Juno Copper Mine: New production capacity released [1][2]
| Indicator | Value | Evaluation |
|---|---|---|
| P/E Ratio (TTM) | 21.71x |
Moderate |
| P/B Ratio | 5.90x |
Slightly high but supported |
| 2025E PE | Approximately 12.4x |
Significantly undervalued |
| EV/OCF | 16.76x | Reasonable range |
| Company Type | 2025E PE |
|---|---|
| Zijin Mining | 12.4x |
| Global Mining Giants Average | 15-18x |
| Pure Gold Companies | 20-25x |
| Pure Copper Companies | 18-22x |
Zijin Mining’s 2025 forward P/E ratio of 12.4x is not only lower than the average of global mining giants, but also significantly lower than the valuations of pure gold and pure copper companies. The main reason is that the market has not fully priced in its
- Lithium Business: Production capacity is expected to reach 60,000-80,000 tonnes in 2026, with a target of 250,000-300,000 tonnes in 2028, and a compound annual growth rate of over 100%
- Zinc and Molybdenum Businesses: Combined revenue exceeded RMB 15 billion in 2025, and each is a leading player in its respective segment when independently evaluated
- Spin-off Expectations: Referring to the case where Luoyang Molybdenum’s valuation increased by 29% after spinning off its potassium business, Zijin Gold International was spun off and listed in September 2025, with assets contributing 20% of profits supporting a market capitalization of nearly HKD 400 billion
| Indicator | Value | Signal |
|---|---|---|
| Current Price | ¥37.31 | — |
| MA20 | ¥35.53 | Short-term moving average trending upward |
| MA60 | ¥31.82 | Medium-term moving average trending upward |
| MACD | No crossover | Bullish bias |
| KDJ | K:50.4, D:64.1 | Neutral to slightly bearish |
| RSI | Normal range | — |
| Beta | 1.35 |
Higher volatility than the broader market |
- 20-day annualized volatility: 40.15%(slightly high)
- 52-week price range: ¥15.19 - ¥39.85
- Current price is at the upper endof the 52-week range
The stock’s Beta coefficient is 1.35, meaning that for every 1% fluctuation in the broader market, Zijin Mining fluctuates by approximately 1.35%, making it a high-volatility target [0].
- Continuous Rise in Gold Prices: Institutions such as Goldman Sachs and JPMorgan are optimistic about the gold trend in 2026, and JPMorgan predicts that the gold price may hit$5,000/oz
- Expectations of Fed Interest Rate Cuts: If an interest rate cut cycle starts in 2026, a weaker US dollar will continue to support gold prices
- Copper Supply-Demand Gap: Global energy transformation drives rigid demand for copper, and supply-demand tightness cannot be quickly resolved
- Production Capacity Release: Multiple key projects will be commissioned in 2026, with continuous production growth
- Spin-off and Listing Expectations: If high-quality assets such as lithium, zinc, and molybdenum are listed independently, it will activate valuation restructuring
- Cost Pressure: In the first three quarters of 2025, the unit costs of mined gold and mined copper increased by 15.2% and 14.4% respectively
- Price Volatility: A sharp correction in commodity prices will impact performance
- Geopolitics: Overseas projects face uncertainties such as policy and labor issues
- Valuation Correction: If current market enthusiasm fades, it may face valuation compression
| Dimension | Rating | Explanation |
|---|---|---|
| Resource Reserves | ★★★★★ | World-class, comprehensive categories |
| Growth | ★★★★★ | Continuous production expansion, high-speed profit growth |
| Profitability | ★★★★☆ | Excellent ROE, cost control requires attention |
| Valuation Level | ★★★★★ | Significantly undervalued at 12x PE |
| Technicals | ★★★☆☆ | At a relatively high level, with high volatility |
- Zijin Mining is not only the “Gold King of China”, but also a multi-metal mining leader
- Driven by both volume and price surges, profit growth momentum is strong in 2025-2026
- The forward PE of 12x is at a historical low, with sufficient safety margin
- Diversified metal matrix effectively hedges against cyclical risks of single commodities
- Buy Range: ¥32-35 (near MA60)
- Target Price: ¥45-50 (based on 2026 performance forecast)
- Stop-Loss Price: ¥28 (if below MA120)
- Position Suggestion: Core holding allocation, position ratio of 15-25%
[0] Jinling AI Financial Database - Zijin Mining Real-Time Market, Financial Analysis, Technical Analysis (2026-01-20)
[1] Caifuhao - “Earn RMB 4.3 Billion Monthly! Zijin Mining’s Performance Has Surged Continuously for a Decade” (2026-01-20)
https://caifuhao.eastmoney.com/news/20260120104340976132690
[2] Caifuhao - “Zijin at 19.7x PE: Far More Undervalued Than Just Its Gold and Copper Businesses?” (2026-01-19)
https://caifuhao.eastmoney.com/news/20260119090342269765870
[3] China Energy Network - “Excellent M&A Skills! Zijin Mining Rises for 4 Consecutive Days, 15 Funds of This Institution collectively Earn Over RMB 100 Million” (2026-01)
https://www.cnenergynews.cn/article/4PygQ2iH5ZN
[4] JPMorgan Global Research - “Gold Price Predictions” (2025-12)
https://www.jpmorgan.com/insights/global-research/commodities/gold-prices
[5] Discovery Alert - “Zijin Frontrunner to Acquire Barrick’s Ivory Coast Gold Mine” (2025)
https://discoveryalert.com.au/zijin-mining-bid-tongon-gold-mine-2025-acquisition/
Insights are generated using AI models and historical data for informational purposes only. They do not constitute investment advice or recommendations. Past performance is not indicative of future results.
About us: Ginlix AI is the AI Investment Copilot powered by real data, bridging advanced AI with professional financial databases to provide verifiable, truth-based answers. Please use the chat box below to ask any financial question.