Wall Street Rally Extends to Second Day as Small Caps Achieve Historic Milestones
Unlock More Features
Login to access AI-powered analysis, deep research reports and more advanced features
About us: Ginlix AI is the AI Investment Copilot powered by real data, bridging advanced AI with professional financial databases to provide verifiable, truth-based answers. Please use the chat box below to ask any financial question.
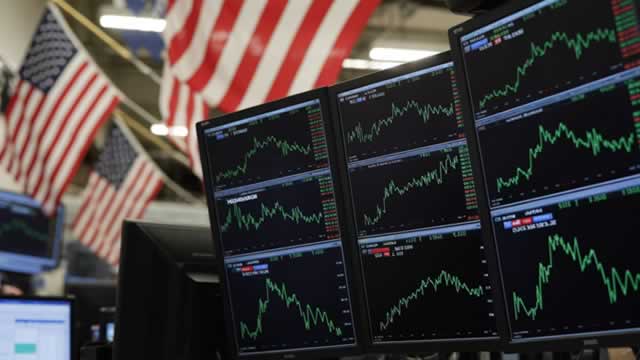
Wall Street recorded its second consecutive day of broad-based gains on January 22, 2026, with technology stocks, small caps, and the Dow Jones Industrial Average advancing, while longer-term Treasury yields eased for a second straight session [1]. The small-cap Russell 2000 index reached its eighth record closing high of 2026, achieving a remarkable 13-session winning streak that ties the 2008 record [2]. This market movement reflects a significant rotation from mega-cap technology stocks toward domestically focused small-cap companies, supported by strong U.S. economic fundamentals including 4.4% GDP growth in Q3 2025—the strongest quarterly expansion in two years [1]. Portfolio managers characterized the broader stock market as “healthy” despite geopolitical-related volatility, with the two-day surge recovering most of the sharp losses experienced on January 20, 2026 [1].
The January 21-22 rally demonstrated remarkable breadth across market segments, building on the previous day’s strong gains. The technology-heavy Nasdaq Composite posted its best two-day performance since at least December 19, 2025, while the S&P 500 recorded similar strength [1]. The Dow Jones Industrial Average advanced by approximately 300 points across the two-day period, reflecting broad-based participation from blue-chip equities [1].
The small-cap Russell 2000’s performance represented the most striking aspect of this rally. The index not only hit its eighth record closing high of 2026 but also achieved a historic 13-session winning streak that ties the 2008 record, with the index gaining nearly 15% in less than three weeks [2]. Perhaps most remarkably, small-cap stocks outperformed the S&P 500 for the 14th consecutive trading day—the longest such streak since 1996, when it reached 16 consecutive days [1][2]. In fact, small-cap stocks have outperformed larger peers every trading day in 2026 to date, demonstrating an extraordinary and sustained shift in market leadership [1].
Sector analysis on January 22 revealed a notable rotation away from defensive, rate-sensitive sectors and into economically sensitive areas [0]. Basic Materials led all sectors with a 1.15% gain, followed by Consumer Cyclical (+0.60%) and Healthcare (+0.55%), reflecting optimism about domestic economic growth prospects [0]. In contrast, Utilities suffered the steepest decline at -2.70%, followed by Real Estate (-0.46%) and Communication Services (-0.29%) [0].
This sector rotation aligns with the broader “Great Rotation” from mega-cap technology names—the so-called “Magnificent Seven”—toward domestically focused small-cap companies [2]. The iShares Russell 2000 ETF (IWM) hit new all-time highs above $2,650, validating strong institutional interest in this shift [2]. Traditional technology stocks experienced modest pressure on the second day of the rally, with the sector declining 0.17%, suggesting that market participants were actively reallocating capital from previously dominant mega-cap names [0].
Longer-term Treasury yields eased for a second consecutive day, with the 10-year Treasury yield falling back to 4.25% after briefly hitting 4.3% earlier in the week [1]. Despite the two-day decline, yields remained up nearly 10 basis points since the start of 2026 and stayed above the 200-day moving average, a key technical reference level [1]. Analysts framed the yield movement as a sign of stronger economic growth rather than heightened fiscal concerns [1].
The unusual aspect of this equity rally was its occurrence alongside somewhat elevated Treasury yields—small-cap stocks typically struggle with higher rates due to weaker balance sheets and higher floating-rate debt burdens. However, the combination of the Federal Reserve’s 2025 easing cycle and exceptionally strong domestic economic growth has offset these traditional rate-sensitive headwinds for smaller companies [1].
The rally occurred against a backdrop of robust U.S. economic fundamentals. U.S. GDP grew at a 4.4% annual pace in Q3 2025—the strongest quarterly growth in two years—providing a strong foundation for corporate earnings expectations [1]. Consumer spending remained solid despite persistent inflation pressures, while initial jobless claims stayed low, signaling continued labor market stability [1].
Additional catalysts supported market sentiment, including President Trump’s announcement of tariff relief for European nations and a framework for future deals regarding Greenland, which eased investor concerns about international trade tensions [1]. The “One Big Beautiful Bill” Act provided tax relief that particularly benefits service-heavy small-cap companies, further enhancing their relative attractiveness [2].
The Federal Reserve’s preferred inflation gauge—the personal consumption expenditures price index—rose to 2.8% year-over-year in November 2025, up from 2.7% in October [1]. Despite this elevated inflation reading, positive growth signals and policy developments prevented the data from derailing the equity rally, suggesting investors are prioritizing growth prospects over near-term inflation concerns.
The current market environment features a potentially structural shift in market leadership that analysts have characterized as a “Great Rotation” from concentrated mega-cap technology stocks toward smaller, domestically focused companies [2]. This rotation is supported by several converging factors that create a compelling fundamental case for small-cap outperformance.
First, the Federal Reserve’s 2025 easing cycle has significantly reduced interest costs for small-cap companies, which typically carry more floating-rate debt than their larger counterparts [2]. Second, the projected earnings trajectory for Russell 2000 companies shows approximately 60% growth in 2026, compared to roughly 18% for mega-cap technology names—a differential that justifies the leadership shift [2]. Third, recent tax policy developments have disproportionately benefited the service-heavy small-cap sector [2].
The sustainability of this rotation will depend on small-cap companies’ ability to deliver on these aggressive earnings projections. While the historical earnings growth differential is notable, a 60% annual growth rate represents an ambitious target that could be vulnerable to economic disruptions or execution challenges.
The remarkable breadth of the current rally—with small caps outperforming on 14 consecutive trading days—suggests healthy market participation beyond the concentrated gains that characterized much of 2024 and early 2025. Portfolio managers characterized the broader stock market as “healthy” despite the geopolitical-related volatility that created sharp swings earlier in the week [1].
However, analysts highlighted a “push-and-pull” sentiment in markets—optimism around strong economic growth is balanced by skepticism that higher rates could lower equity valuations [1]. The tension between these competing narratives may create continued volatility as investors assess the sustainability of current valuation levels across market capitalizations.
The Russell 2000’s 13-session winning streak represents an extraordinary run that ties the 2008 record [2]. While historical comparisons should be approached with caution, this milestone underscores the exceptional nature of current market conditions. The index’s nearly 15% gain in less than three weeks reflects both the magnitude of the rotation and the rapidity of capital reallocation from mega-cap to small-cap names [2].
The current small-cap leadership appears to have medium-term sustainability given the convergence of policy support, earnings growth trajectories, and economic fundamentals. However, investors should monitor several upcoming data points that could influence the rotation’s duration: upcoming Federal Reserve communications, Q4 2025 earnings reports, and any developments in trade policy.
- Dow Jones Industrial Average: +300 points across two days (+0.6% on January 22)
- S&P 500: +0.93% across two days
- Nasdaq Composite: +0.88% across two days (best two-day performance since December 19, 2025)
- Russell 2000: +2.18% across two days, eighth record closing high of 2026
- 13-session winning streak (tied 2008 record)
- 14 consecutive trading days of outperformance vs. S&P 500 (longest since 1996)
- IWM ETF hit new all-time highs above $2,650
- 10-year Treasury yield: 4.25%
- Above 200-day moving average
- Up nearly 10 basis points year-to-date
- Q3 2025 GDP growth: 4.4% annual (strongest in two years)
- PCE inflation: 2.8% year-over-year (November 2025)
- Consumer spending: Solid despite inflation pressures
- Labor market: Initial jobless claims remain low
- Russell 2000: +60% projected earnings growth
- Mega-cap technology: ~18% projected earnings growth
The two-day rally recovered most of the sharp losses from January 20, 2026, demonstrating the market’s resilience and the underlying strength of current economic fundamentals [1]. The key question for investors is whether small-cap companies can deliver on aggressive earnings projections to sustain this leadership change through the first half of 2026.
Insights are generated using AI models and historical data for informational purposes only. They do not constitute investment advice or recommendations. Past performance is not indicative of future results.
About us: Ginlix AI is the AI Investment Copilot powered by real data, bridging advanced AI with professional financial databases to provide verifiable, truth-based answers. Please use the chat box below to ask any financial question.