In-Depth Analysis of the Sustainability of Goldwind Science & Technology (002202.SZ)'s Limit-Up and the Investment Value of the Wind Power Sector
Unlock More Features
Login to access AI-powered analysis, deep research reports and more advanced features
About us: Ginlix AI is the AI Investment Copilot powered by real data, bridging advanced AI with professional financial databases to provide verifiable, truth-based answers. Please use the chat box below to ask any financial question.
Related Stocks
Based on the obtained data, I provide you with a systematic and comprehensive analysis:
Goldwind Science & Technology surged to a limit-up on January 22, 2026, closing at RMB 29.58, with a single-day gain of 10.00%. From a technical analysis perspective, the stock has shown an extreme short-term upward trend [0]:
| Time Horizon | Gain | Performance Evaluation |
|---|---|---|
| 1-Day | +10.00% | Strong Limit-Up |
| 5-Day | +9.39% | Upward Trend Continues |
| 1-Month | +75.13% | Notable Increase |
| 3-Month | +96.28% | Nearly Doubled |
| 6-Month | +194.33% | Substantial Increase |
| 1-Year | +197.29% | Nearly 3x Gain |
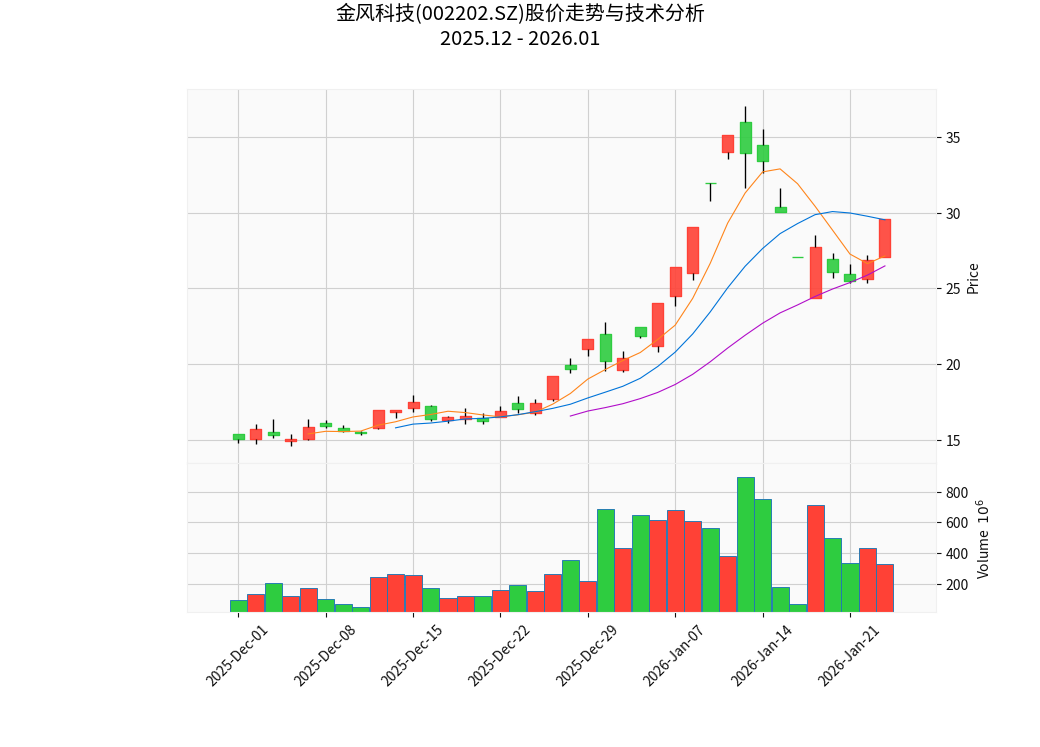
Chart: Goldwind Science & Technology’s K-line Chart from December 2025 to January 2026, Overlaid with 5-Day, 10-Day, and 20-Day Moving Averages
| Indicator | Value | Market Positioning |
|---|---|---|
| Current Price | RMB 29.58 | Approaching 80% of the 52-week high (RMB 37.03) |
| 52-Week Range | RMB 7.64 - 37.03 | At a Relatively High Level |
| Price-to-Earnings Ratio (P/E) | 46.64x | Above Industry Average |
| Price-to-Book Ratio (P/B) | 3.22x | Moderately High |
| Price-to-Sales Ratio (P/S) | 1.81x | Moderate |
| Market Capitalization | RMB 124.88 Billion | Large-Cap Stock |
According to technical analysis tools [0]:
| Indicator | Value | Signal Interpretation |
|---|---|---|
MACD |
No Crossover | Bearish Signal |
KDJ |
K:31.3, D:38.4, J:17.0 | Death Cross, Bearish |
RSI(14) |
Normal Range | Not Overbought |
Beta Coefficient |
0.68 | Low Volatility Relative to the Market |
Trend Judgment |
Sideways Consolidation | No Clear Direction |
| Level | Price | Implication |
|---|---|---|
Strong Support |
RMB 26.48 | 20-Day Moving Average Level |
Initial Support |
RMB 27.04 | Today’s Opening Price |
Initial Resistance |
RMB 30.73 | Short-Term Resistance Level |
Strong Resistance |
RMB 37.03 | 52-Week High |
- Excessive Short-Term Gains: A 96.68% increase in the past 30 days brings pullback pressure
- KDJ Death Cross: Short-term technical indicators show correction needs
- Approaching Strong Resistance Level: Significant pressure at RMB 30.73
- Bearish MACD: Mid-line trend reversal not yet confirmed
- Strong Moving Average Support: Stock price firmly stays above the 20-day moving average
- Volume Confirmation: Average daily trading volume of 468 million shares indicates active capital participation
- Fundamental Improvement: Latest quarterly EPS exceeded expectations by 45.99%
The recent rise of the wind power sector is mainly supported by the following policy factors:
- Continuous Advancement of Carbon Neutrality Policies: Long-term growth in new energy installed capacity demand is highly certain
- Renewable Energy Subsidy Policies: The economic viability of wind power projects continues to improve
- Mid-Term Evaluation of the 14th Five-Year Plan: Wind power installed capacity targets are expected to be raised
- Green Financial Support: Financing costs for wind power projects have decreased
| Indicator | Trend | Impact |
|---|---|---|
| Wind Curtailment Rate | Continuous Decline | Increased Utilization Hours |
| Wind Turbine Costs | Declining | Improved Gross Profit Margin |
| Offshore Wind Power | Rapid Growth | New Growth Driver |
| Overseas Orders | Increasing | Expanded Market Space |
From the market performance perspective [0]:
- The power generation equipment sector leads the A-share market
- Shows obvious sector rotation characteristics
- Capital is shifting from high-valuation sectors to low-valuation new energy sectors
- Global energy transition drives wind power demand
- China’s wind power installed capacity has ranked first globally for consecutive years
- Offshore wind power is emerging as a new growth pole
- Technological progress continues to reduce levelized cost of electricity (LCOE)
- The beginning of the year is typically the peak season for wind power installation
- Accelerated order delivery by complete machine manufacturers
- Eased raw material cost pressures
| Dimension | Advantages |
|---|---|
Market Position |
Leading wind turbine manufacturer in China with a leading market share |
Technological Strength |
Leading direct-drive permanent magnet technology route |
Overseas Layout |
Significant results from globalization strategy |
Product Portfolio |
Covers onshore and offshore wind power |
| Indicator | Value | Evaluation |
|---|---|---|
| ROE (Return on Equity) | 6.81% | Moderately High |
| Net Profit Margin | 3.84% | Improving |
| Current Ratio | 0.98 | Moderate Short-Term Solvency |
| Quick Ratio | 0.70 | Liquidity Requires Attention |
| Indicator | Goldwind Science & Technology | Industry Average | Evaluation |
|---|---|---|---|
| P/E(TTM) | 46.64x | Approx. 35x | Relatively High |
| P/B | 3.22x | Approx. 2.5x | Relatively High |
- ✅ Clear long-term growth logic, sustained industry prosperity
- ✅ Stable leading position in the industry with obvious competitive advantages
- ✅ Latest financial report exceeded expectations, fundamentals improved
- ⚠️ Excessive short-term gains, relatively high valuation
- ⚠️ Technical indicators show correction needs
| Strategy | Recommendation | Target Price |
|---|---|---|
Short-Term |
Avoid chasing highs, reduce positions on rallies | RMB 30-32 |
Mid-Term |
Position when price pulls back to the RMB 26-27 range | RMB 35-40 |
Long-Term |
Mainly hold positions | Above RMB 50 (subject to performance realization) |
- Valuation Reversion Risk: P/E ratio reaches 46x, significantly higher than the historical average
- Policy Volatility Risk: Changes in new energy subsidy policies
- Raw Material Price Risk: Fluctuations in costs of steel, copper, etc.
- Technological Iteration Risk: Rapid updates in wind turbine technology
- Intensified Market Competition Risk: Risk of price wars among complete machine manufacturers
Goldwind Science & Technology’s limit-up today is mainly driven by short-term market sentiment and sector rotation, and its sustainability
[0] Jinling AI Financial Database - Goldwind Science & Technology Real-Time Quotes, Technical Analysis, and Company Profile
Insights are generated using AI models and historical data for informational purposes only. They do not constitute investment advice or recommendations. Past performance is not indicative of future results.
About us: Ginlix AI is the AI Investment Copilot powered by real data, bridging advanced AI with professional financial databases to provide verifiable, truth-based answers. Please use the chat box below to ask any financial question.