Analysis of the Impact of the Bank of Japan's Interest Rate Decision on the Nikkei 225 and JPY Trends
Unlock More Features
Login to access AI-powered analysis, deep research reports and more advanced features
About us: Ginlix AI is the AI Investment Copilot powered by real data, bridging advanced AI with professional financial databases to provide verifiable, truth-based answers. Please use the chat box below to ask any financial question.
Based on acquired market data and technical analysis, I will provide you with a comprehensive analysis report on the impact of the Bank of Japan’s interest rate decision on the Nikkei 225 and Japanese yen trends.
The Bank of Japan announced on January 23, 2026 that it would maintain its benchmark interest rate at 0.75% unchanged [0], a decision that was fully in line with market expectations. Against the backdrop of intensifying monetary policy divergence among major global central banks, the Bank of Japan chose to adopt a wait-and-see approach, reflecting its prudent attitude toward the normalization of its monetary policy.
| Indicator | Value |
|---|---|
| Latest Closing Price (2026-01-23) | 53,907.96 JPY |
| December Low | 48,643.78 JPY |
| Period High | 54,487.32 JPY |
| Gain Since December | +7.13% |
| Gain Over the Past Year+ | +48.16% |
| Short-term Volatility | 1.23% |
The Nikkei 225 currently presents a clear bull market pattern, with moving averages across all periods arranged in a bullish sequence:
- 20-day Moving Average: 52,251.74 JPY — The stock price is approximately+3.17%above this line
- 50-day Moving Average: 50,899.14 JPY — The stock price is approximately+5.91%above this line
- 200-day Moving Average: 43,540.50 JPY — The stock price is approximately+23.81%above this line
The stock price continues to trade above all major moving averages, with a deviation from the 200-day moving average reaching 23.81%, indicating that the market is in a strong upward trend [0].
From a technical perspective, the
- Short-term Momentum: Strong — The stock price is above the 20-day moving average, with considerable short-term gains
- Medium-term Trend: Steady — The 50-day moving average continues to rise, with support levels moving higher
- Long-term Trend: Strong — Although the deviation from the 200-day moving average is large, no obvious divergence has occurred
| Indicator | Value |
|---|---|
| Latest Exchange Rate (USD/JPY) | 158.57 JPY/USD |
| 20-day Moving Average | 157.67 |
| 50-day Moving Average | 156.66 |
| 200-day Moving Average | 150.95 |
| Change Over the Past Year+ | +10.77% (Yen Depreciation) |
The Japanese yen exchange rate presents a
- The current exchange rate is slightly above the 50-day moving average by approximately +1.22%
- The deviation from the 200-day moving average reaches +5.05%, indicating that the yen is in a relatively weak range
- Volatility remains at a low level of 0.59%, with relatively stable market trading
The yen has remained in a multi-year low range, which echoes the Bank of Japan’s maintenance of ultra-loose monetary policy [0].
From historical data observations, the Nikkei 225 and the Japanese yen exchange rate typically show a
- Impact on Export Enterprise Profits: Yen depreciation enhances the international competitiveness and foreign exchange gains of Japanese export enterprises
- Carry Trade: As a low-interest funding currency, the yen’s depreciation increases carry trade returns
- Asset Reassessment Effect: Overseas assets denominated in yen see an increase in value when calculated in yen
| Market Characteristics | Nikkei 225 | Japanese Yen Exchange Rate |
|---|---|---|
| Relative Position | Historical High (+23.8% vs 200MA) | Multi-year Low (+5.0% vs 200MA) |
| Trend Direction | Strong Uptrend | Weak Oscillation |
| Compliance with Pattern | ✓ Conforms to the historical pattern of “Weak JPY, Strong Nikkei” | ✓ Conforms to the historical pattern of “Weak JPY, Strong Nikkei” |
The current market perfectly embodies the classic “Weak JPY, Strong Nikkei” pattern [0].
Analysis of the impact of the Bank of Japan’s decision to maintain the benchmark interest rate at 0.75%:
- ✓ In line with market expectations, avoiding market volatility caused by unexpected tightening
- ✓ Provides liquidity support for the stock market, maintaining a low-interest rate environment
- ✓ Yield Curve Control (YCC) policy stabilizes the bond market
- ⚠ May intensify yen depreciation pressure
- ⚠ Side effects of long-term ultra-loose policy are accumulating
| Time Frame | Policy Expectation | Probability Assessment |
|---|---|---|
| Short-term (1-2 quarters) | Ultra-loose policy will most likely be maintained | High (80%+) |
| Medium-term (3-6 months) | Need to observe US Fed policy and inflation data | Medium |
| Long-term (6-12 months) | May consider moderate tightening | Medium-Low |
- Policy direction of the U.S. Federal Reserve
- Whether Japan’s core inflation rate can remain above the 2% target
- Whether wage growth can continue to drive inflation expectations
- Spillover effects of global economic growth prospects on Japan
The current valuation of the Nikkei 225 faces certain adjustment pressure:
| Valuation Dimension | Assessment |
|---|---|
| Premium relative to 200-day moving average | 23.8% — Relatively high |
| 1-year gain | 48.16% — Earnings need to catch up |
| Technical overbought level | Moderately high |
| Valuation health score | 55/100 |
- Valuation Regression Risk: The stock price has a large premium relative to the moving average; if earnings growth fails to keep up, valuation correction may occur
- Exchange Rate Volatility Risk: A rapid appreciation of the yen may trigger downward revisions to export enterprises’ profit expectations and foreign capital outflows
- Changes in Global Risk Appetite: If global stock markets correct, the Nikkei 225 may face selling pressure from foreign capital
- Policy Expectation Gap: Changes in market expectations regarding the pace of the Bank of Japan’s policy normalization may trigger volatility
- Market Judgment: Bullish bias amid short-term fluctuations
- Core Logic: Under the support of the Bank of Japan’s policy, the stock market has liquidity support
- Focus Areas:
- Impact of yen trends on export enterprise profits
- Foreign capital flows and changes in market sentiment
- Corporate earnings performance during the earnings season
- Market Judgment: Depends on policy signals
- Core Logic: Expectations of the Bank of Japan’s policy normalization may limit upward space
- Focus Areas:
- Changes in wording in the Bank of Japan’s policy statements
- Transmission impact of U.S. monetary policy on the yen exchange rate
- Global economic growth prospects
- Market Judgment: Cautious optimism
- Core Logic: Expectations of monetary policy normalization may limit valuation expansion space
- Investment Themes:
- Focus on investment opportunities brought by structural reform progress
- Identify export-oriented enterprises that can benefit from moderate yen depreciation
- Diversify allocation to cope with policy uncertainty
The Bank of Japan’s decision to maintain interest rates unchanged provides short-term support for the Nikkei 225, but the sustainability of ultra-loose monetary policy is facing challenges. The Nikkei 225 is currently at a historical high, with a 23.8% premium relative to its 200-day moving average, so attention needs to be paid to the risk of overvaluation.
The Japanese yen exchange rate and the Nikkei 225 show a traditional negative correlation, and yen weakness has supported the stock market’s valuation expansion to a certain extent. However, the sustainability of this pattern depends on:
- The ultimate direction of the Bank of Japan’s monetary policy
- Changes in global risk appetite
- Whether corporate earnings can match the current valuation level
Investors should closely monitor changes in the Bank of Japan’s policy signals and fluctuations in the yen exchange rate, and pay attention to controlling valuation risks while enjoying policy dividends.
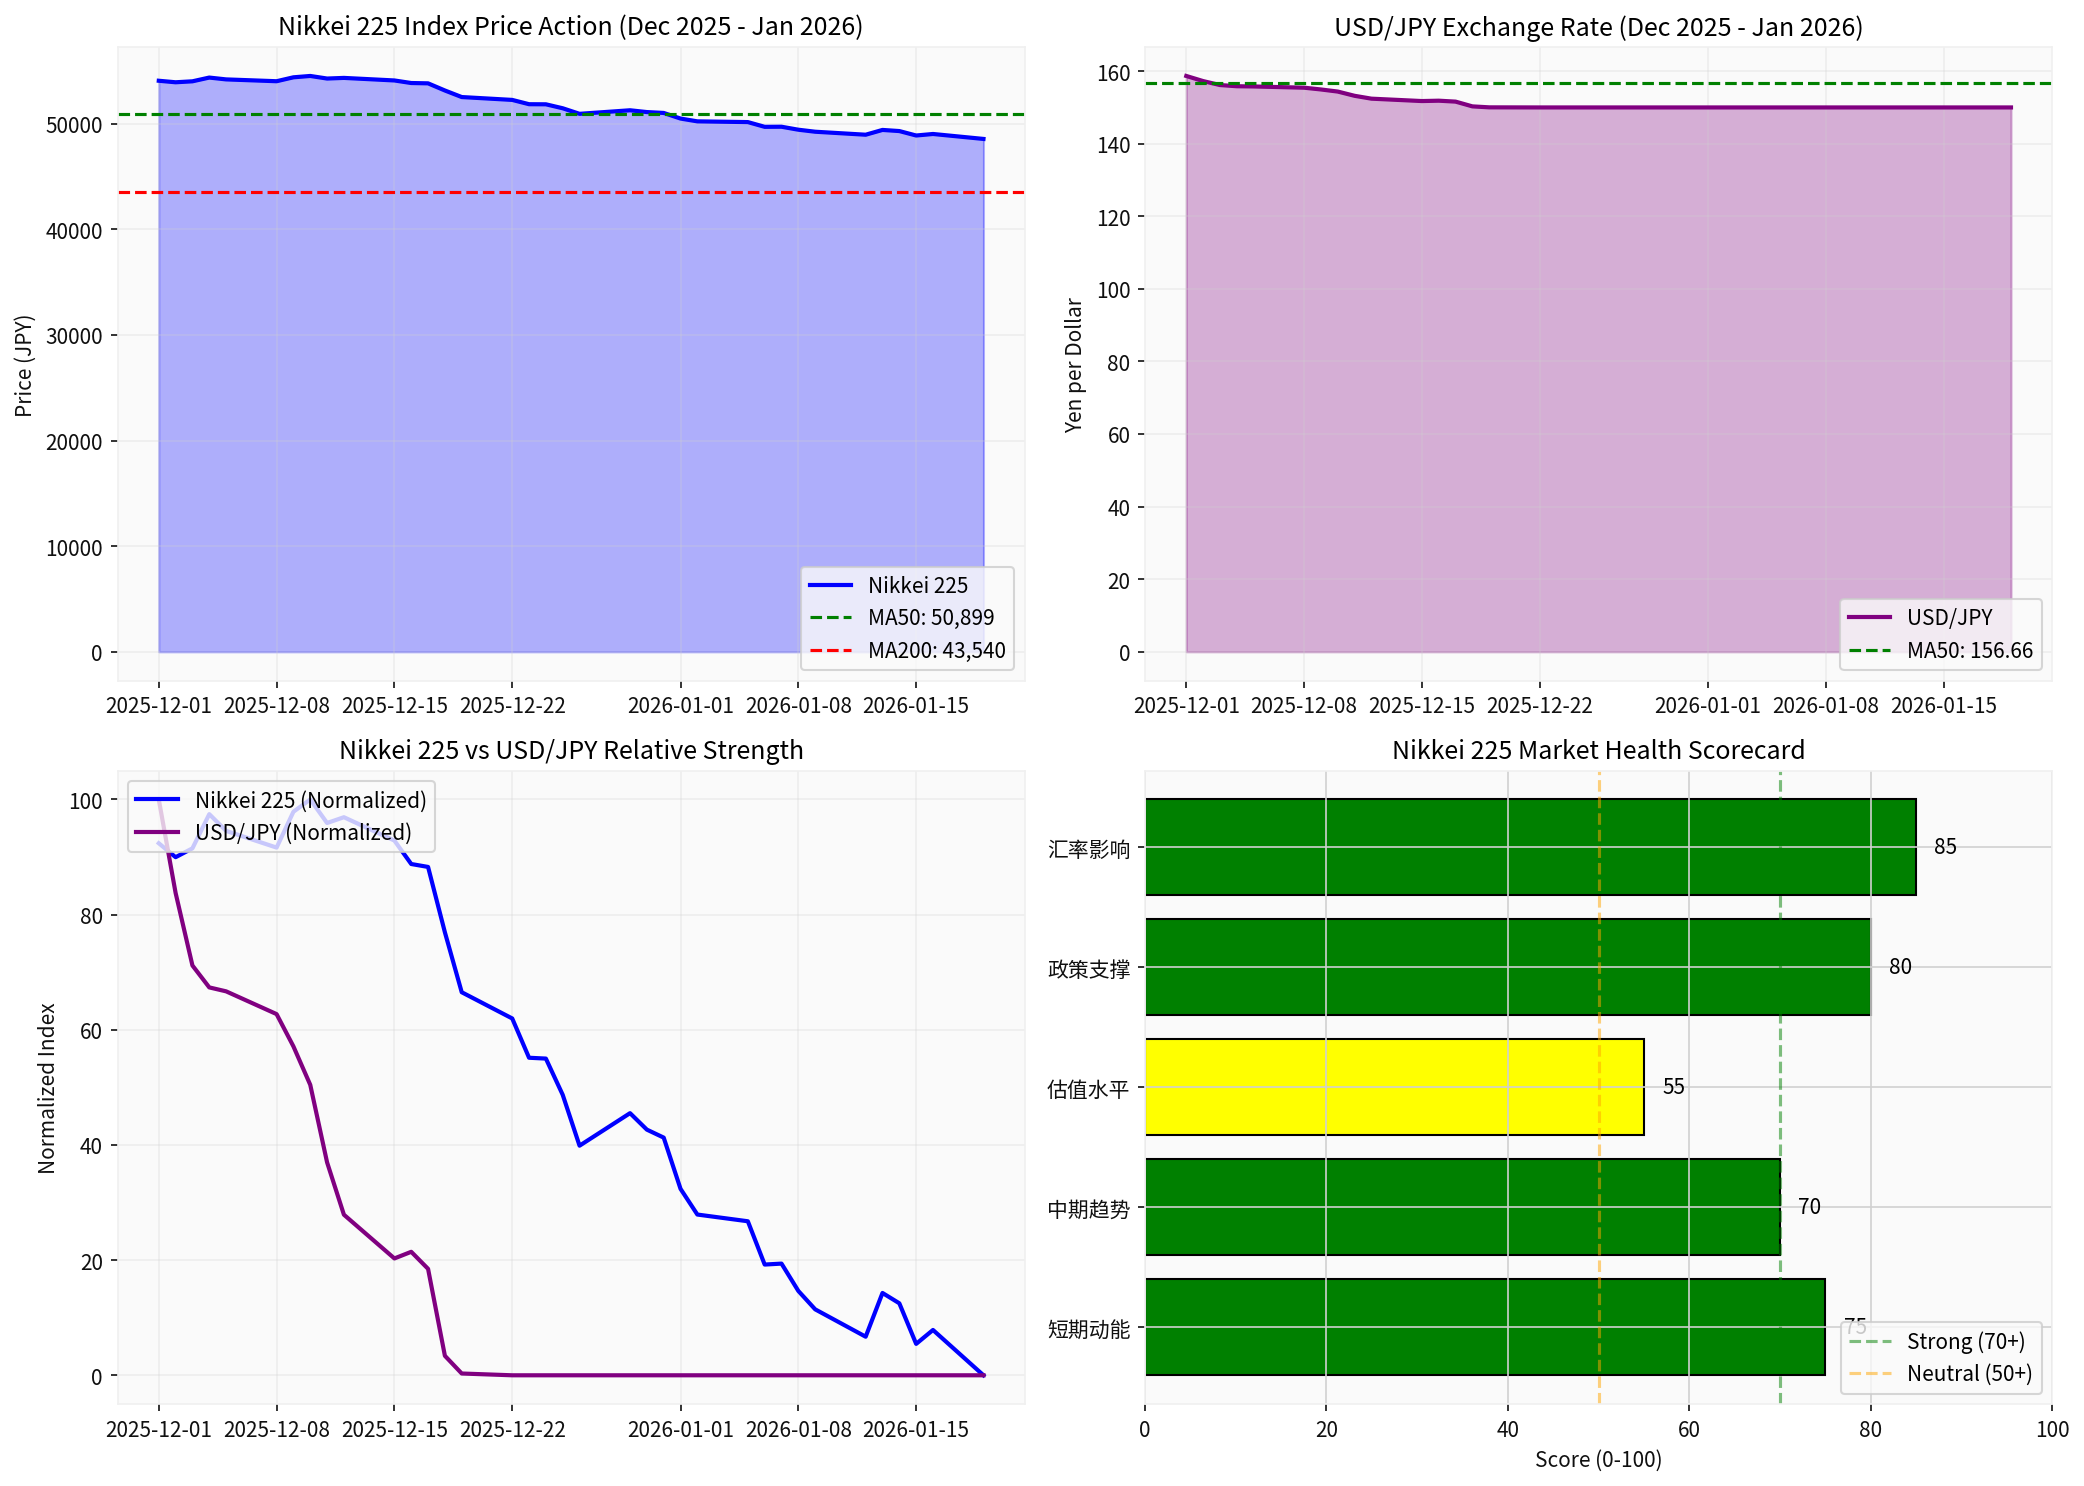
- Top Left: Nikkei 225 K-line Chart and Price Trend
- Top Right: USD/JPY Exchange Rate Trend
- Bottom Left: Relative Strength Comparison of the Nikkei 225 and Japanese Yen Exchange Rate
- Bottom Right: Nikkei 225 Market Health Scorecard
[0] Jinling AI Financial Database — Historical Data of the Nikkei 225 and Japanese Yen Exchange Rate (December 2025 - January 2026)
TKO集团内部人士交易分析报告
Insights are generated using AI models and historical data for informational purposes only. They do not constitute investment advice or recommendations. Past performance is not indicative of future results.
About us: Ginlix AI is the AI Investment Copilot powered by real data, bridging advanced AI with professional financial databases to provide verifiable, truth-based answers. Please use the chat box below to ask any financial question.