Understanding CPI vs PCE: The Two Primary Measures of US Inflation Explained
Unlock More Features
Login to access AI-powered analysis, deep research reports and more advanced features
About us: Ginlix AI is the AI Investment Copilot powered by real data, bridging advanced AI with professional financial databases to provide verifiable, truth-based answers. Please use the chat box below to ask any financial question.
This analysis is based on an educational video explaining the distinction between the Consumer Price Index (CPI) and the Personal Consumption Expenditures (PCE) Price Index, published on January 26, 2026 [1]. The timing of this educational content is particularly relevant given the current economic environment, as the Federal Reserve continues to navigate an inflation landscape that remains above its stated 2% target. The video highlights a fundamental disconnect that persists in public discourse: while CPI dominates media headlines and shapes public perception of inflation, the Federal Reserve’s monetary policy decisions are fundamentally guided by PCE measurements. This divergence creates significant potential for confusion among businesses, households, and financial market participants who may draw incorrect conclusions about the direction of monetary policy based solely on CPI readings.
The current economic context underscores the importance of understanding these measurement differences. Recent Federal Reserve data indicates that core PCE inflation stands at approximately 2.8%, representing a persistent deviation from the central bank’s 2% inflation target [2]. The Fed has responded to these conditions by implementing a series of monetary policy adjustments, having cut interest rates by 25 basis points at three consecutive meetings throughout 2025, bringing the target federal funds rate to a range of 3.50%-3.75% [3]. These policy moves reflect the Fed’s ongoing assessment that inflation is moving toward its target but has not yet arrived, a determination made primarily through analysis of PCE rather than CPI data.
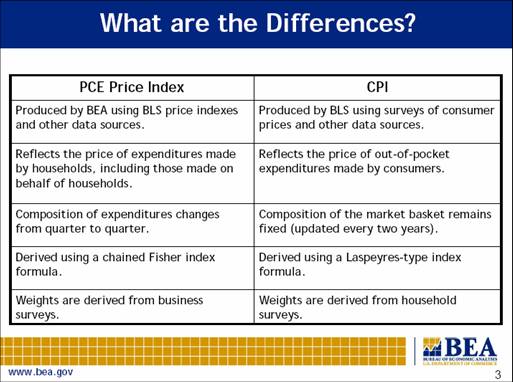
The CPI and PCE indices differ fundamentally in their approach to measuring inflation, and these methodological distinctions have profound implications for how each measure interprets price changes across the economy. The CPI focuses on out-of-pocket spending by urban households, essentially measuring what consumers pay directly for goods and services at the retail level. In contrast, the PCE captures all household consumption, including third-party payments such as employer-sponsored health insurance, Medicare, and Medicaid expenditures [4]. This broader coverage means PCE reflects a more comprehensive view of economic activity, particularly in sectors where third-party payment arrangements are prevalent.
The weighting methodologies employed by each measure further contribute to their divergence. CPI updates its basket weights annually based on the Consumer Expenditure Survey conducted by the Bureau of Labor Statistics, while PCE updates weights quarterly using data from the Bureau of Economic Analysis’s National Income and Product Accounts [4]. This more frequent updating in the PCE allows the measure to adapt more quickly to shifting consumption patterns, such as consumers switching from more expensive to less expensive alternatives when relative prices change. The PCE also employs a chained index methodology that accounts for these substitution effects, whereas CPI uses a fixed basket approach that tends to overstate inflation during periods of rising prices for specific categories.
These methodological differences translate into measurable gaps in the reported inflation rates. Historical analysis reveals that CPI has typically run approximately 0.39 percentage points higher than PCE on average since 2000 [4]. However, this gap can fluctuate significantly based on the composition of price changes across the economy. During the second quarter of 2022, for instance, the divergence between the measures reached 3.4 percentage points—the largest gap on record—driven primarily by sharp increases in shelter and energy costs that receive higher weighting in CPI [5]. Understanding this potential for divergence is essential for interpreting month-to-month changes in either measure and avoiding overreaction to short-term fluctuations.
The Federal Reserve formally adopted PCE as its preferred inflation measure in 2000, with the 2% inflation target explicitly defined in terms of PCE annual change since 2012 [4]. This institutional preference reflects several key advantages that PCE offers for monetary policy analysis. First, PCE’s broader coverage includes rural households and government-provided services that CPI excludes, providing a more complete picture of consumption patterns across the entire economy rather than just urban consumers. This comprehensive scope is particularly important for understanding inflation in healthcare and housing, where government programs and third-party payments play significant roles.
Second, PCE’s more responsive weighting system captures real consumer behavior changes that CPI misses. When relative prices shift, consumers do not continue purchasing the same goods in the same quantities—they adapt by substituting toward less expensive alternatives. The chained PCE index explicitly accounts for these behavioral adjustments, resulting in a measure that more accurately reflects the true cost of maintaining a given standard of living [5]. This substitution accounting is particularly valuable during periods of volatile commodity prices, when the fixed-weight approach of CPI can produce misleading estimates of inflationary pressure.
Third, PCE data benefits from comprehensive revision capabilities that provide more reliable long-run series for policy analysis. The Bureau of Economic Analysis can incorporate more complete source data during periodic benchmark revisions, allowing for more accurate historical comparisons and trend analysis [5]. This revision capability is especially important for central bankers who need to assess the sustainability of inflation trends over extended periods rather than reacting to potentially noisy monthly estimates.
Two categories—healthcare and shelter—account for much of the systematic difference between CPI and PCE, and understanding their treatment in each measure is essential for accurate economic interpretation. Healthcare represents approximately 16.8% of the PCE index but only about 7% of CPI [5]. This disparity reflects PCE’s inclusion of employer-paid health insurance premiums and government healthcare expenditures, which together represent the majority of total healthcare spending in the United States. CPI, by contrast, captures only out-of-pocket healthcare costs paid directly by consumers, missing the substantial portion of healthcare consumption financed through insurance and government programs.
This healthcare weighting difference has significant implications for interpreting inflation trends in the health sector. When healthcare costs rise—particularly through increases in insurance premiums or government program costs—PCE will register a larger impact than CPI, reflecting the broader economic significance of these price changes. Conversely, periods of relatively stable healthcare costs will have a dampening effect on PCE readings compared to CPI. For analysts and policymakers tracking the healthcare sector’s contribution to overall inflation, the choice of measure fundamentally changes the assessment.
Shelter costs represent another significant source of divergence between the measures, though the dynamics differ from healthcare. CPI gives substantially higher weight to shelter—including both rental costs and owners’ equivalent rent—reflecting the importance of housing costs in urban household budgets [4]. PCE underweights shelter relative to its economic significance because the presence of third-party payments in other categories dilutes shelter’s relative share. This has been a key driver of the historical CPI-PCE gap, particularly during periods when housing markets experience rapid price appreciation. The divergence has notable implications for real estate and construction sector analysis, where CPI-based inflation measures may overstate the housing cost pressures facing urban consumers.
The November 2025 reporting period marked a notable development in the relationship between the two measures: core PCE overtook core CPI for the first time since 2021, with the spread narrowing to just -16 basis points [6]. This convergence suggests shifting consumption patterns and relative price changes across categories, potentially indicating that the structural factors driving the traditional CPI-PCE gap may be evolving. For financial market participants, this convergence has important implications for interpreting inflation data and anticipating Federal Reserve policy responses.
As of the December 2025 Federal Open Market Committee projections, the central bank anticipates core PCE inflation will decline to 2.5% by 2026, down from 2.6% in the September projections [3]. The Fed’s medium-term projections indicate reaching the 2% inflation target by 2028, though this timeline depends on the evolution of price pressures across various categories [7]. Some analysts, however, have identified risks to this optimistic trajectory, with estimates suggesting core PCE could rise to 3% in early 2026 due to persistent price pressures in services categories [8].
The practical implication of these dynamics for market participants is that both measures warrant monitoring, but with clear understanding of their distinct roles. PCE releases drive more significant reactions in interest rate-sensitive markets because they provide the Fed’s primary policy-relevant inflation assessment. Meanwhile, CPI remains important for understanding public perception and may influence political and media narratives about economic conditions. The gap between the measures can create trading opportunities for sophisticated participants who understand the timing and magnitude of expected divergences based on the composition of price changes.
The CPI-PCE distinction illuminates a broader theme in economic communication: the tension between measures that are most relevant for policy purposes and those that are most accessible to general audiences. CPI’s dominance in media coverage reflects its intuitive appeal—it measures what consumers actually pay at the register, making its readings easier to understand and relate to personal experience. PCE’s broader scope and methodological sophistication make it more accurate for policy purposes but less intuitive for public communication. This tension creates ongoing challenges for central bank communication efforts, as public perception of inflation may diverge significantly from the measures guiding actual policy decisions.
The healthcare weighting disparity represents perhaps the most significant structural difference with implications beyond inflation measurement. With healthcare comprising nearly 17% of PCE but only 7% of CPI, the two measures are effectively tracking different aspects of the healthcare sector’s inflation dynamics. For healthcare industry analysis, PCE provides a more complete picture of cost pressures, while CPI understates the sector’s contribution to overall inflation by excluding employer and government spending. This has implications for healthcare policy debates, where inflation measures may be cited selectively based on which measure supports a particular narrative.
The recent convergence between core CPI and core PCE in late 2025 suggests that consumption patterns and relative price changes are evolving in ways that reduce the historical gap between measures [6]. Whether this represents a temporary phenomenon or a more persistent shift remains to be seen, but it underscores the importance of ongoing monitoring rather than relying on historical assumptions about the relationship between the measures. Financial market participants should remain attentive to potential regime changes in the CPI-PCE relationship that could affect the interpretation of inflation data.
For financial market participants, the CPI-PCE divergence creates both risks and opportunities that require careful navigation. The primary risk lies in misinterpreting inflation data based on the wrong measure, potentially leading to incorrect expectations about Federal Reserve policy actions. Investors who focus exclusively on CPI headlines may overestimate inflationary pressure relative to the Fed’s actual policy assessment, potentially resulting in inappropriate positioning in interest-rate-sensitive assets. Similarly, businesses making planning decisions based solely on CPI may overestimate cost pressures facing their customers if their particular consumption patterns align more closely with the PCE basket.
The opportunity dimension arises from the predictable patterns in CPI-PCE divergences based on the composition of price changes. When shelter costs are rising rapidly, CPI tends to exceed PCE by a wider margin, potentially creating trading opportunities for participants who can accurately anticipate this relationship. The reverse occurs when healthcare costs are the primary inflation driver, as PCE will show more significant impacts. Sophisticated quantitative traders have developed strategies explicitly targeting these relationships, though such strategies carry execution risks and require sophisticated modeling capabilities.
For business planning purposes, the key opportunity lies in using the appropriate measure for the relevant decision context. Companies engaged in wage negotiations or cost-of-living adjustments should note that CPI remains the measure embedded in most such agreements and labor contracts, making it more relevant for setting wage and benefit levels. Conversely, businesses seeking to understand broader economic inflationary pressures and their implications for monetary policy should focus primarily on PCE trends, as these are the measures guiding Federal Reserve decision-making. This nuanced understanding allows for more accurate forecasting of both input cost pressures and demand conditions.
The CPI and PCE represent two distinct approaches to measuring inflation in the United States, each with different coverage, methodology, and policy relevance. CPI focuses on urban household out-of-pocket spending and receives greater media attention, while PCE captures broader consumption including third-party payments and serves as the Federal Reserve’s official inflation gauge for monetary policy decisions. The average historical gap of approximately 0.39 percentage points between the measures reflects fundamental differences in coverage and methodology, with the gap capable of widening significantly during periods of volatile shelter and energy prices.
Core PCE inflation at approximately 2.8% remains above the Fed’s 2% target, with the central bank having implemented three consecutive rate cuts in 2025 to support economic growth while inflation normalizes [2][3]. The Fed projects inflation will decline to 2.5% by 2026 and reach the 2% target by 2028, though some analysts identify near-term risks of upward pressure persisting into early 2026 [7][8]. The structural differences in healthcare weighting (16.8% in PCE versus 7% in CPI) and shelter treatment contribute to systematic divergences between the measures that require careful interpretation depending on the analytical context.
For stakeholders across the economy, understanding the CPI-PCE distinction is essential for accurate economic assessment. Media headlines emphasizing CPI may overstate inflation concerns relative to the Fed’s actual policy gauge, while PCE’s substitution accounting provides a more accurate measure of consumers’ changing purchasing patterns. Both measures track similar long-term trends despite short-term divergences, but their different characteristics make each more or less relevant for specific analytical purposes. This understanding enables more informed interpretation of economic data and more accurate anticipation of monetary policy implications.
Insights are generated using AI models and historical data for informational purposes only. They do not constitute investment advice or recommendations. Past performance is not indicative of future results.
About us: Ginlix AI is the AI Investment Copilot powered by real data, bridging advanced AI with professional financial databases to provide verifiable, truth-based answers. Please use the chat box below to ask any financial question.