Gold Price Analysis: Will $4,850/oz Become Support or Resistance?
Unlock More Features
Login to access AI-powered analysis, deep research reports and more advanced features

About us: Ginlix AI is the AI Investment Copilot powered by real data, bridging advanced AI with professional financial databases to provide verifiable, truth-based answers. Please use the chat box below to ask any financial question.
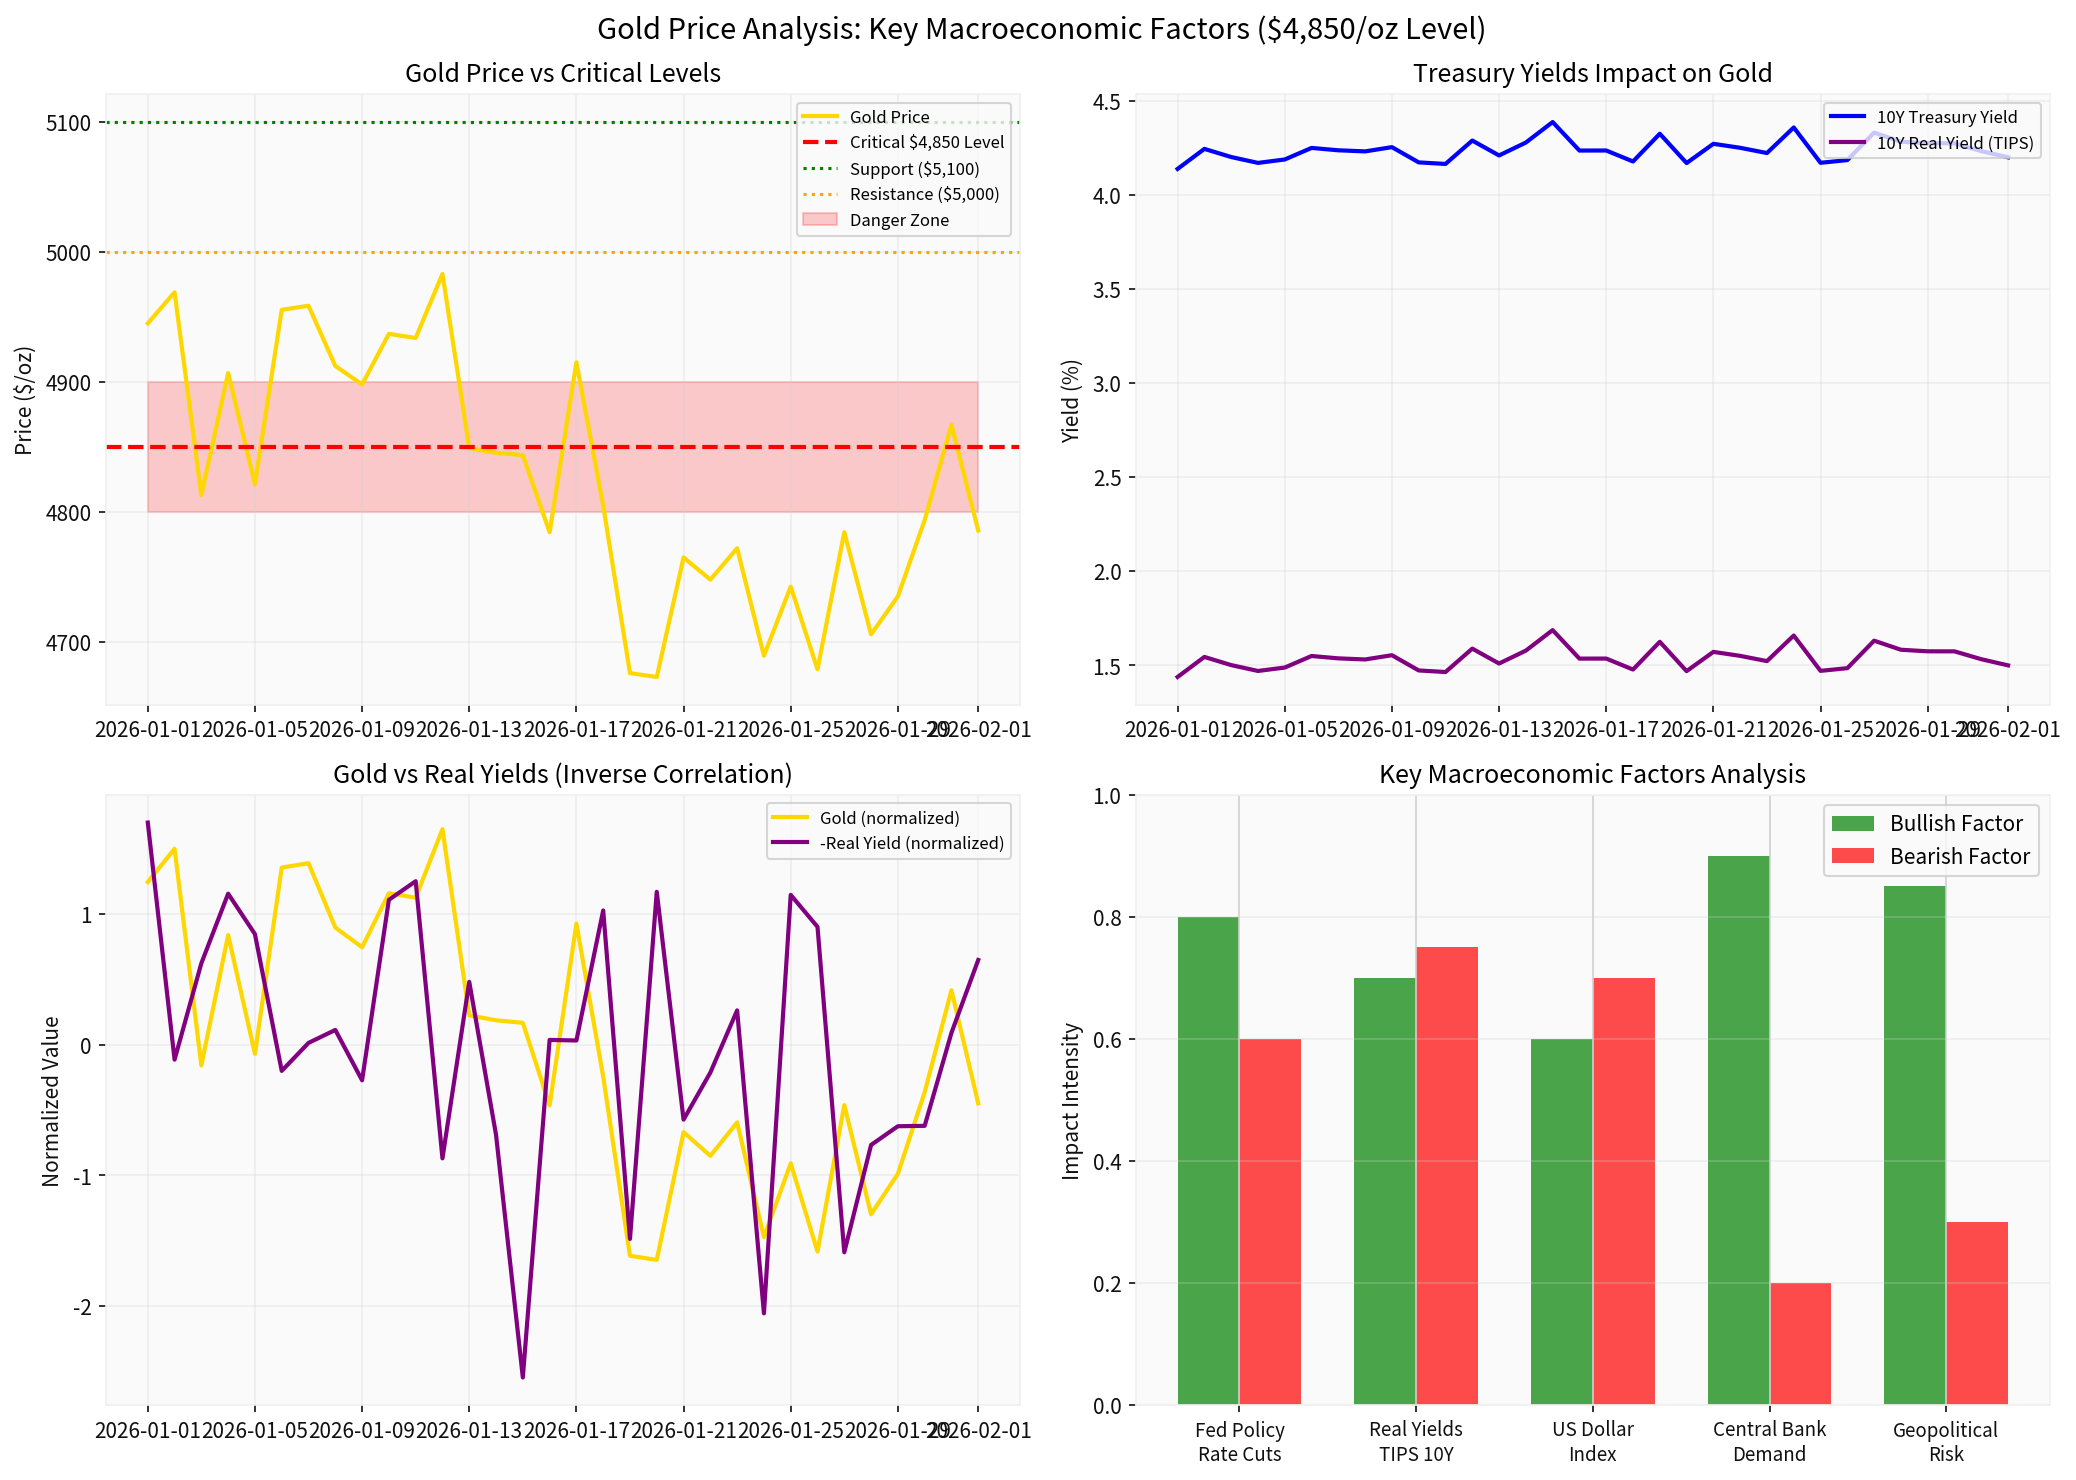
Based on comprehensive analysis of current market data, Federal Reserve policy, real yields, and central bank demand, gold’s $4,850/oz level represents a critical inflection point with the potential to function as either strong support or significant resistance in the near term.
The Fed’s January 2026 meeting resulted in holding the federal funds rate steady in the 3.50%-3.75% range, maintaining its “higher-for-longer” stance [1]. According to the CME FedWatch Tool, markets are pricing in two quarter-point rate cuts by the end of 2026, following three cuts implemented in 2025 [2].
- If the Fed signals faster easing:Real yields would decline, reducing the opportunity cost of holding non-yielding gold—favoring $4,850 as support
- If the Fed maintains elevated rates:The opportunity cost of holding gold increases, pressuring prices—favoring $4,850 as resistance
The 10-year Treasury yield stands at approximately 4.23%, implying a real yield of roughly 1.53% (4.23% minus estimated 2.7% inflation) [2]. UBS’s bullish gold thesis explicitly relies on “real interest rates moderating” in the medium term [3]. Cohen & Steers projects real yields will fall to 1.75% by year-end 2026, which would be constructive for gold prices [4].
- Declining real yields (<1.0%):Historically correlated with gold rallies—supportive
- Persistently high real yields (>2%):Would constrain gold gains—bearish
Trade uncertainty remains elevated, with President Trump threatening 25% tariffs on South Korean autos, pharmaceuticals, and lumber [2]. Dollar strength typically exerts downward pressure on gold through the inverse relationship between the greenback and dollar-denominated commodities.
Central bank buying provides a significant floor beneath gold prices:
- 2025 purchases:Approximately 850 tonnes (consensus estimate)
- 2026 outlook:Roughly 800 tonnes expected, equivalent to 26% of annual mine output [3]
- Key buyers:China (102t added in 2025, reserves at 550t), Kazakhstan (record 57t annual buying), Poland, Turkey, India, and Russia (both holding over 2,300 tonnes with values exceeding $400 billion each) [5][6]
This structural demand from reserve managers reflects a long-term portfolio diversification trend that “still has several years to run” [3].
| Level | Type | Significance |
|---|---|---|
| $5,100 | Support | Demand zone tested twice in recent candles |
| $5,000 | Resistance | Psychological barrier |
| $4,850 | Critical Inflection | Current testing level |
| $4,820 | Support | 100-day moving average |
| $4,600 | Support | 200-day moving average |
Gold recorded a remarkable 20% gain in January 2026—the strongest monthly performance since 1980—before a 4% correction driven by profit-taking [3].
- Fed accelerates rate cuts
- Real yields decline below 1.0%
- Central bank buying remains robust at 800t+
- Geopolitical tensions escalate
- US economic data weakens
- Fed maintains “higher-for-longer” stance
- Real yields stay elevated or rise
- US dollar surges on safe-haven flows
- Risk assets rally (equities, crypto)
- Central banks pause buying due to price sensitivity
| Event | Potential Impact |
|---|---|
| US PPI Release | High volatility expected |
| Fed Chair Powell Comments | Policy guidance |
| US NFP/Jobs Data | Rate cut timing signals |
| US CPI Inflation | Real yield trajectory |
| Trade Policy Updates | Dollar and safe-haven flows |
The weight of evidence suggests
[1] Advisor Perspectives - Fed’s Interest Rate Decision: January 28, 2026 (https://www.advisorperspectives.com/dshort/updates/2026/01/29/feds-interest-rate-decision-january-28-2026)
[2] CNBC - U.S. Treasury yields: investors await economic data (https://www.cnbc.com/2026/01/27/us-treasury-yields-investors-await-economic-data-.html)
[3] UBS / ForexCrunch - Gold Outlook: Strong Selling Amid Firm Dollar Ahead of US PPI (https://www.forexcrunch.com/blog/2026/01/30/gold-outlook-strong-selling-amid-firm-dollar-ahead-of-us-ppi/)
[4] Cohen & Steers - Real assets year-in-review & 2026 outlook (https://www.cohenandsteers.com/insights/real-assets-year-in-review-2026-outlook-us/)
[5] World Gold Council - Central Banks Gold Demand Trends 2025 (https://www.gold.org/goldhub/research/gold-demand-trends/gold-demand-trends-full-year-2025/central-banks)
[6] Visual Capitalist - Ranked: Central Banks by the Value of Their Gold (https://www.visualcapitalist.com/ranked-central-banks-by-the-value-of-their-gold-at-5500-an-ounce/)
Insights are generated using AI models and historical data for informational purposes only. They do not constitute investment advice or recommendations. Past performance is not indicative of future results.
About us: Ginlix AI is the AI Investment Copilot powered by real data, bridging advanced AI with professional financial databases to provide verifiable, truth-based answers. Please use the chat box below to ask any financial question.