Spot Gold Surge to $4,970/oz - Comprehensive Analysis
Unlock More Features
Login to access AI-powered analysis, deep research reports and more advanced features

About us: Ginlix AI is the AI Investment Copilot powered by real data, bridging advanced AI with professional financial databases to provide verifiable, truth-based answers. Please use the chat box below to ask any financial question.
Now I have comprehensive data to provide a detailed analysis. Let me synthesize all findings into a professional financial report.
Spot gold has exhibited extraordinary volatility in late January and early February 2026, reaching an all-time high of approximately
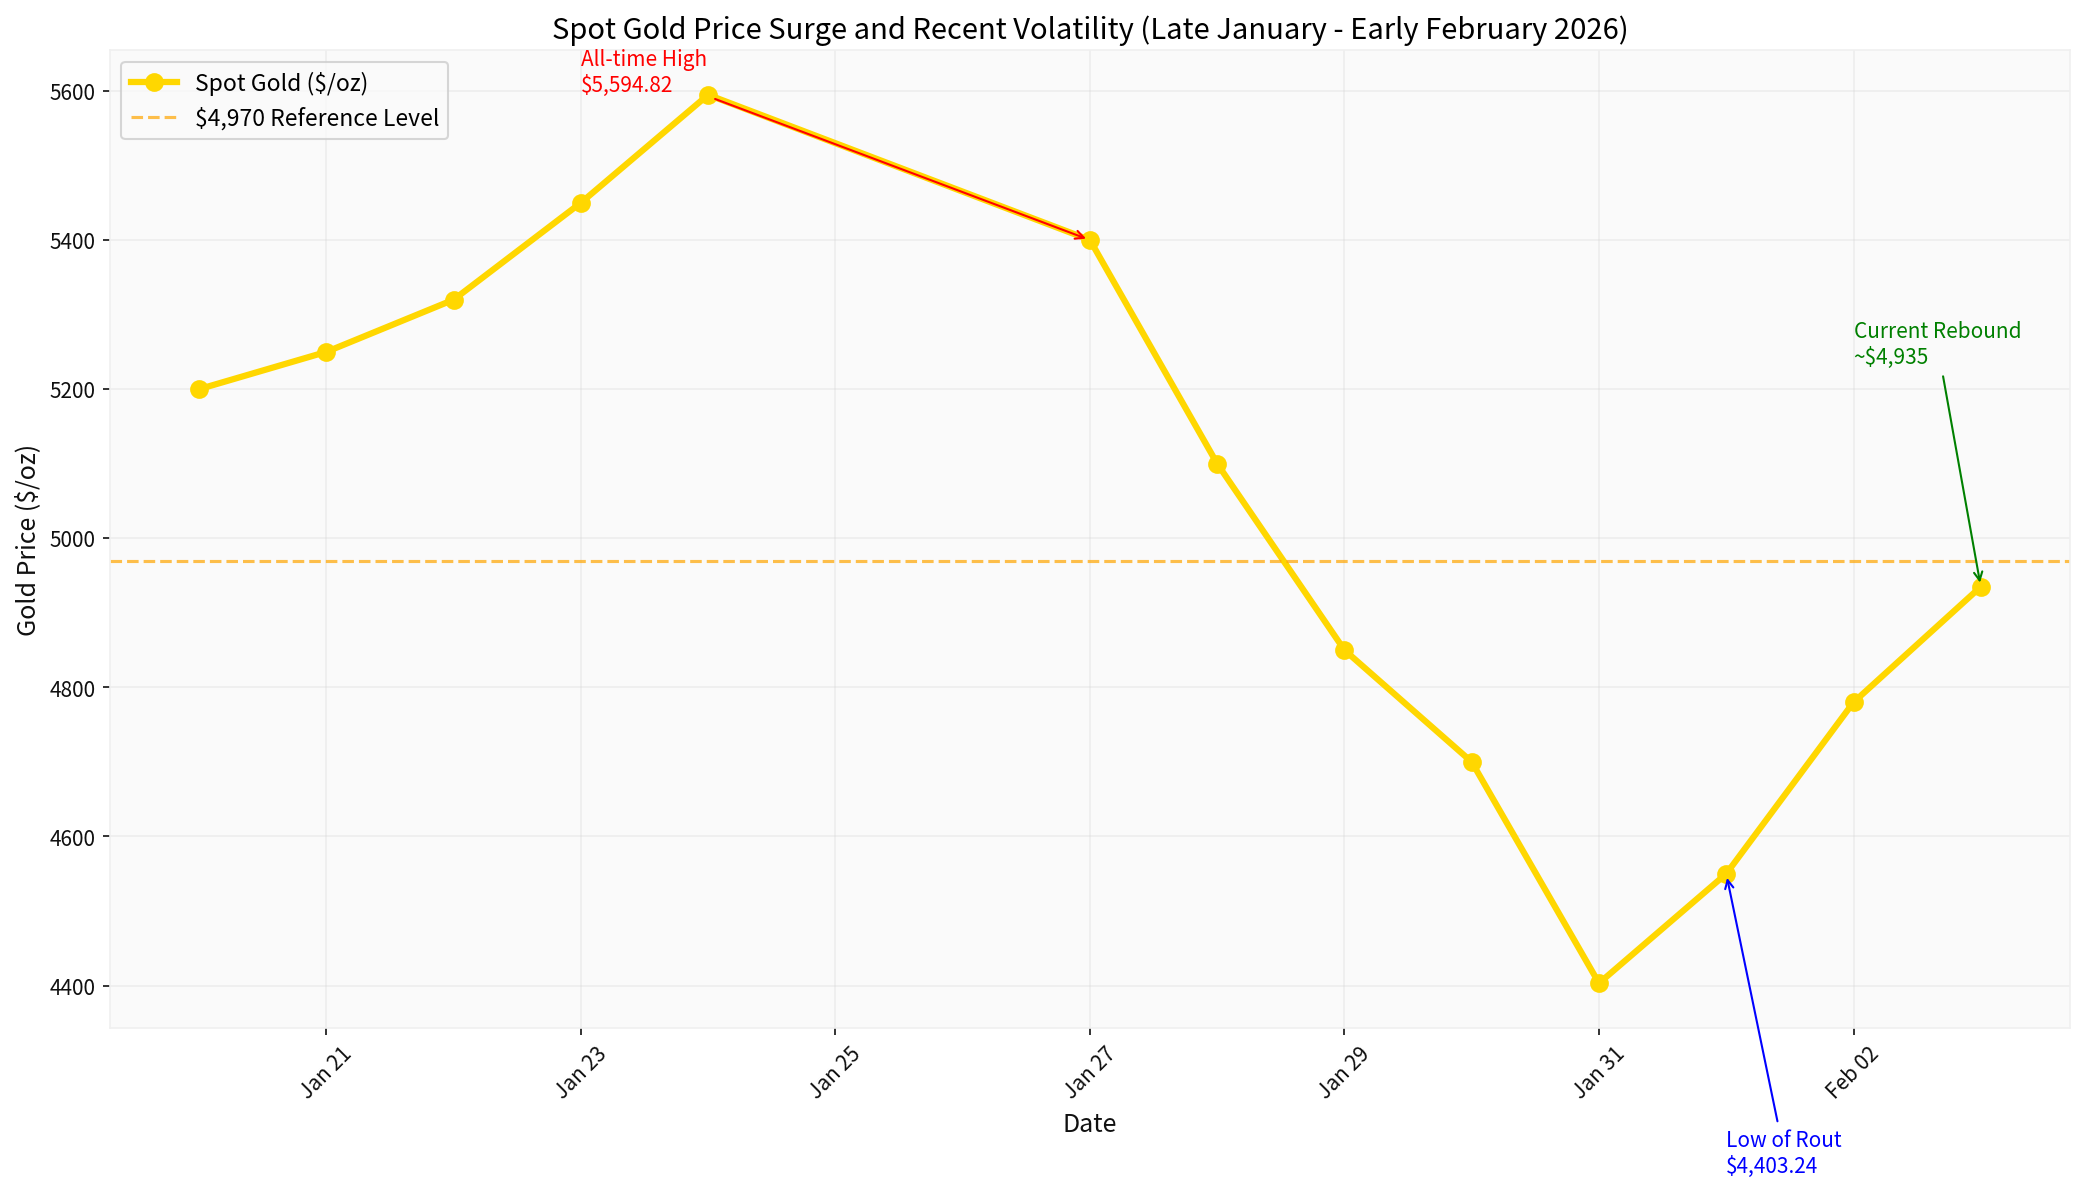
The chart above illustrates the dramatic price action, showing the rapid ascent to record highs, the sharp correction, and the subsequent recovery. The orange dashed line at $4,970 represents the reference level mentioned in market reports.
Central banks, particularly those in emerging markets, have been the most significant structural driver behind gold’s record-breaking rally. In 2025, central banks collectively purchased
- Sanctions risk: Nations facing potential Western sanctions have sought to reduce dollar-denominated reserve holdings
- Currency volatility: Emerging market central banks have increased gold allocation as a hedge against local currency depreciation
- “Anti-fiat” asset preference: Growing skepticism toward paper currencies has boosted gold’s appeal as a store of value
- De-dollarization trends: BRICS nations and other emerging economies have accelerated gold purchases as part of broader efforts to reduce reliance on the US dollar [4]
Analysts project continued aggressive demand from central banks in 2026, providing fundamental support for elevated gold prices [3].
Multiple ongoing geopolitical flashpoints have sustained safe-haven demand throughout 2025 and into 2026:
- Ukraine conflict: Prolonged hostilities continue to drive European and global investors toward safe-haven assets
- Middle East tensions: The Gaza conflict and broader regional instability have maintained geopolitical risk premiums
- US trade disputes: Tariff implementation and trade policy uncertainty under the new administration have created economic policy uncertainty
- US-Canada tensions: Concerns over proposed tariffs on Canadian goods contributed to gold’s surge to $5,000 per ounce in late January [5]
These factors have collectively kept risk aversion elevated, supporting gold’s traditional role as a portfolio hedge [3].
The US dollar has experienced notable weakness against major currencies, which has provided significant tailwinds for dollar-denominated gold prices. A weaker dollar makes gold more affordable for holders of other currencies, thereby increasing demand from international buyers. The dollar’s weakness has been attributed to:
- Rising inflation expectations and sovereign debt levels
- Growing concerns about US fiscal sustainability
- Shifting global reserve allocations away from dollar assets [3]
The combination of dollar weakness and elevated inflation has reinforced gold’s appeal as an inflation hedge.
Persistently elevated inflation remains a key supporting factor for gold prices. US inflation has remained at approximately
- Real interest rates have declined, making non-yielding assets like gold relatively more attractive compared to interest-bearing securities
- Inflation hedging demandhas remained robust from both institutional and retail investors
- Global debt levelscontinue to rise, increasing concerns about currency debasement [3]
Gold’s historical role as an inflation hedge has been reinforced in this environment, attracting investors seeking protection against purchasing power erosion.
Gold’s performance has been characterized by a divergence between physical demand and ETF inflows:
- Strong ETF inflowshave outpaced physical supply, creating potential disconnects in pricing
- Physical demandhas remained robust, particularly from Asian markets
- This divergence has raised concerns about short-term volatility and potential price corrections [3]
The significant inflow into gold-backed ETFs has contributed to price discovery challenges and exaggerated price movements in both directions.
The Federal Reserve concluded its first meeting of 2026 on January 28th, leaving the
- Inflation data remains elevated at 2.7% YoY, above the 2% target
- The labor market continues to be described as “reasonably strong”
- The Fed noted it would “carefully assess incoming data, the evolving outlook, and the balance of risks” when considering future policy adjustments
- Some Federal Reserve officials, including Christopher Waller, expressed preferences for rate cuts [6]
Betting markets continue to anticipate rate cuts sometime in 2026, though the timing and magnitude remain uncertain [5].
The Federal Reserve’s monetary policy stance is a critical determinant of gold’s price trajectory:
- If the Fed maintains current rates or moves toward easing, gold is likely to remain attractive
- Lower interest rates reduce the opportunity cost of holding non-yielding assets like gold
- Expectations of rate cuts have historically been positive for gold prices
- A more accommodative Fed would reinforce real yield compression, supporting gold prices
- Unexpected rate increases would strengthen the dollar and raise yields on competing assets
- Higher real yields increase gold’s carrying costs relative to yield-bearing alternatives
- A hawkish Fed stance could trigger significant gold price corrections
- President Trump’s nomination of Kevin Warshas Fed Chair to replace Jerome Powell introduces policy uncertainty
- Markets initially interpreted this nomination positively, contributing to dollar strength and a temporary gold correction [2][5]
- The Warsh nomination may signal a more inflation hawkish stance, which could limit gold’s upside
- Most analysts expect interest rates to remain in a “holding pattern” until the second half of 2026 [7]
- Bank of America has forecasted two Fed interest rate cuts in 2026 [8]
- The uncertainty surrounding Fed policy trajectory is likely to contribute to gold price volatility
The extreme price movements in late January and early February 2026 reveal important market dynamics:
-
Margin Requirement Changes: CME Group raised margin requirements on precious-metal futures, adding selling pressure during the correction phase [2]
-
Data Uncertainty: The US Bureau of Labor Statistics delayed the January employment report due to a partial federal shutdown, creating information asymmetry and uncertainty [2]
-
Market Sentiment: Analysts characterized the two-week period as “irrational” behavior, suggesting that prices had diverged from fundamental values before the correction [2]
-
Fair Value Assessment: Post-correction prices are viewed by some analysts as approaching “fair value,” suggesting potential for further upside if fundamentals remain supportive [2]
Based on the recent price action:
- Strong support: $4,400-$4,500 zone (demonstrated during the correction)
- Immediate resistance: $5,000 psychological level
- Major resistance: $5,594.82 all-time high
- Long-term bullish targets: Some analysts anticipate gold reaching $5,600-$6,300 in the medium term [2]
- Central bank buying remains robust throughout 2026
- Fed implements rate cuts in the first half of 2026
- Geopolitical tensions escalate further
- US dollar weakness accelerates
- Inflation proves more persistent than expected
- Potential price target: $5,600-$6,300 per ounce
- Central bank buying moderates to sustainable levels
- Fed maintains rates with gradual easing later in 2026
- Geopolitical tensions remain elevated but contained
- Dollar stabilizes with modest fluctuations
- Expected price range: $4,500-$5,500 per ounce
- Fed signals prolonged high-rate stance or implements rate hikes
- Geopolitical risk premiums decline significantly
- Dollar rallies on safe-haven flows
- Central bank demand moderates
- Downside risk: Return to $4,000-$4,500 range
For investors considering gold exposure, several factors merit consideration:
- Portfolio diversification: Gold’s low correlation with equities and bonds makes it a valuable diversification tool
- Position sizing: Given elevated volatility, appropriate position sizing is essential
- Investment vehicle selection: Physical gold, gold ETFs, and mining stocks each offer different risk-reward profiles
- Dollar sensitivity: Given gold’s inverse relationship with the dollar, currency hedging may be appropriate for international investors
- Long-term perspective: Historical gold performance has been characterized by boom-and-bust cycles; long-term investors should maintain appropriate expectations [5]
The surge in spot gold prices to approximately $4,970 per ounce reflects a confluence of powerful macroeconomic forces, led by aggressive central bank diversification, persistent geopolitical tensions, US dollar weakness, and inflation concerns. The Federal Reserve’s stance on interest rates remains a critical swing factor: continued rate stability or easing would likely support gold prices, while an unexpected shift toward higher rates could trigger significant corrections.
The extraordinary volatility of recent weeks—featuring a $1,200 price range within two weeks—underscores the importance of maintaining a disciplined, long-term perspective when considering gold investments. As the global monetary landscape continues to evolve and central bank policies diverge across major economies, gold’s role as a diversifier and hedge is likely to remain relevant throughout 2026 and beyond.
[1] Economic Times - “Gold prices rebound nearly 6% today: Why is gold gaining again” (https://m.economictimes.com/news/international/us/gold-prices-rebound-nearly-6-today-why-is-gold-gaining-again-and-is-this-the-best-time-to-buy-the-dip-as-gold-prices-eye-6300-next/articleshow/127884947.cms)
[2] Al Arabiya - “Gold set for biggest daily gain since 2008 after two-session rout” (https://english.alarabiya.net/amp/business/banking-and-finance/2026/02/03/gold-set-for-biggest-daily-gain-since-2008-after-twosession-rout)
[3] AInvest - “Gold Price Volatility in 2026: What Drives the Surge” (https://www.ainvest.com/news/gold-price-volatility-2026-drives-surge-2601/)
[4] Golden Mart - “End of the Dollar Empire: Gold Price Forecast 2026 - De-Dollarization” (https://golden-mart.com/wp-content/uploads/2025/09/End-of-the-Dollar-Empire-—-Gold-Price-Forecast-2026-De-Dollarization-the-Rise-of-BRICS.png)
[5] Fisher Investments - “This Week in Review | Fed Developments, 2026 Outlook, Gold” (https://www.fisherinvestments.com/en-us/insights/videos/fisher-investments-this-week-in-review-2026-01-30)
[6] Advisor Perspectives - “Fed’s Interest Rate Decision: January 28, 2026” (https://www.advisorperspectives.com/dshort/updates/2026/01/29/feds-interest-rate-decision-january-28-2026)
[7] Investing News - “Gold Price Breaks Above US$5300 as Fed Holds Rates” (https://investingnews.com/federal-reserve-gold-price/)
[8] Norada Real Estate - “Bank of America Forecasts Two Fed Interest Rate Cuts in 2026” (https://www.noradarealestate.com/wp-content/uploads/2025/12/bank-of-america-forecasts-two-fed-interest-rate-cuts-in-2026.jpg)
Insights are generated using AI models and historical data for informational purposes only. They do not constitute investment advice or recommendations. Past performance is not indicative of future results.
About us: Ginlix AI is the AI Investment Copilot powered by real data, bridging advanced AI with professional financial databases to provide verifiable, truth-based answers. Please use the chat box below to ask any financial question.