Gold Intraday Volatility as Sentiment Indicator Analysis
Unlock More Features
Login to access AI-powered analysis, deep research reports and more advanced features

About us: Ginlix AI is the AI Investment Copilot powered by real data, bridging advanced AI with professional financial databases to provide verifiable, truth-based answers. Please use the chat box below to ask any financial question.
Based on current market data from December 2025 through February 2026, this analysis examines how marginal intraday volatility in gold prices serves as a barometer for broader market sentiment regarding
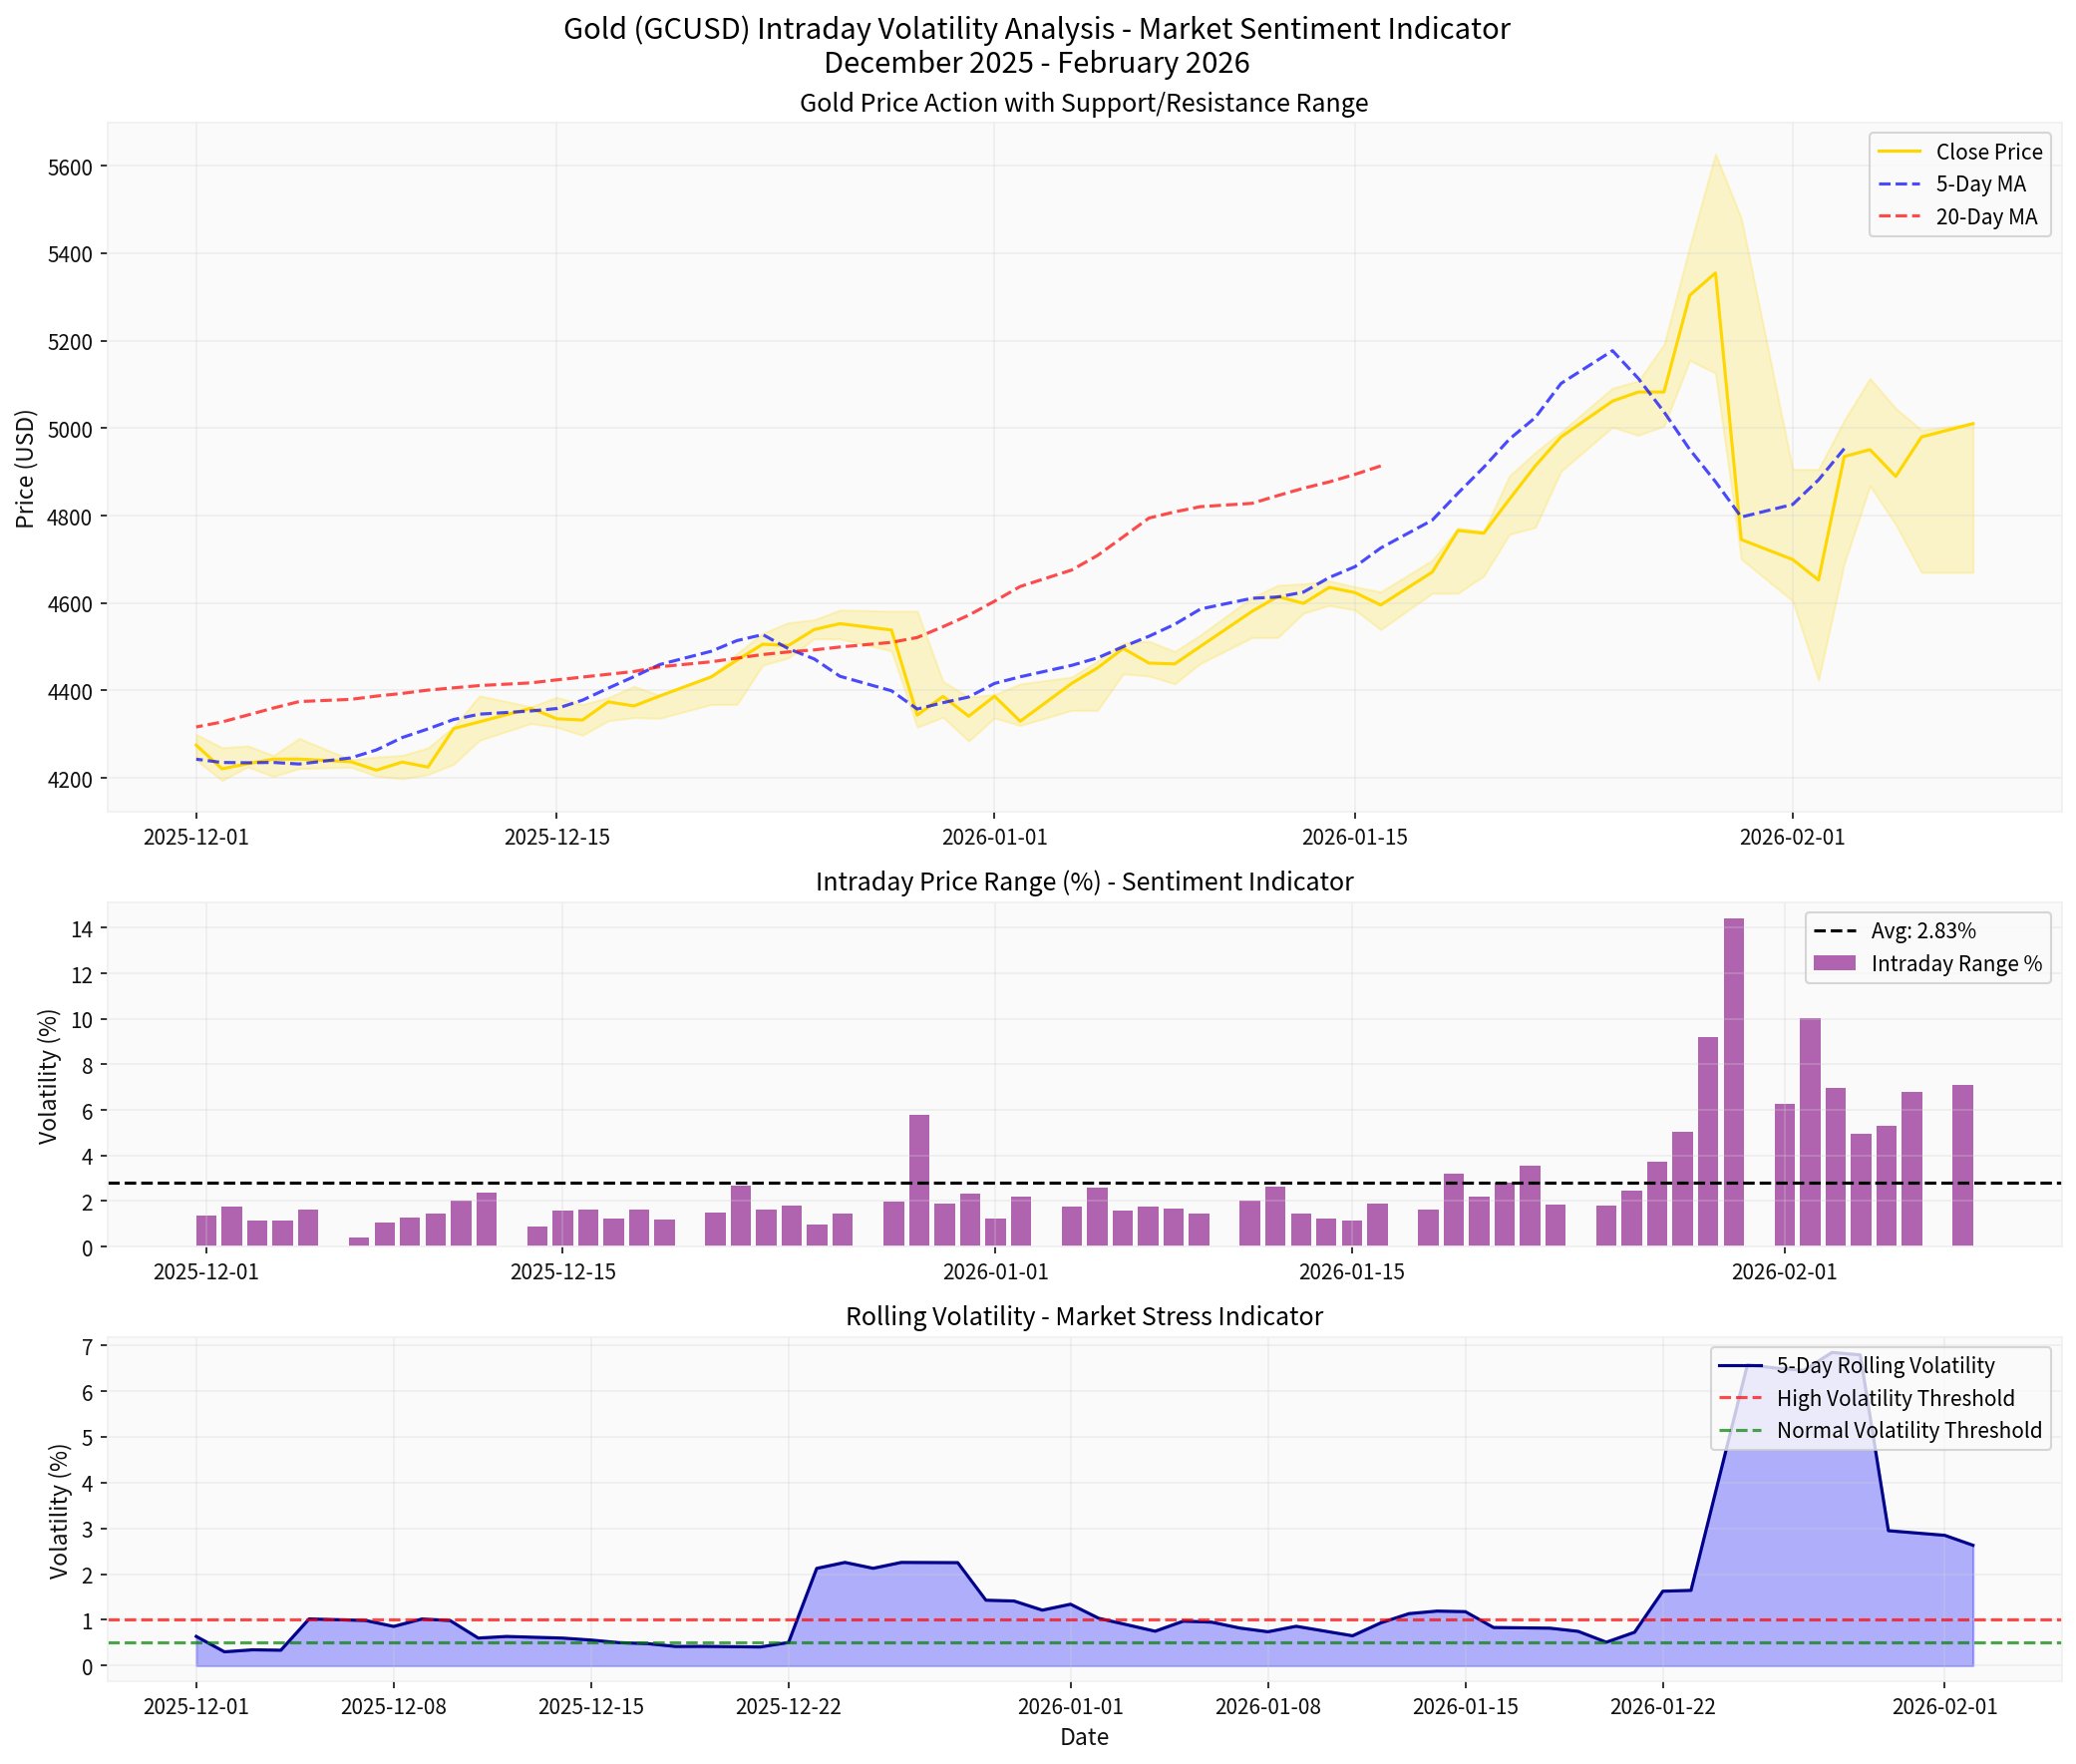
As of February 8, 2026, gold is trading in a volatile range with significant intraday price swings reflecting elevated market uncertainty. Recent data indicates:
| Metric | Value | Interpretation |
|---|---|---|
| Current Price | ~$4,275/oz | Elevated from historical averages |
| 5-Day Rolling Volatility | 0.64% | Currently in “complacent” regime |
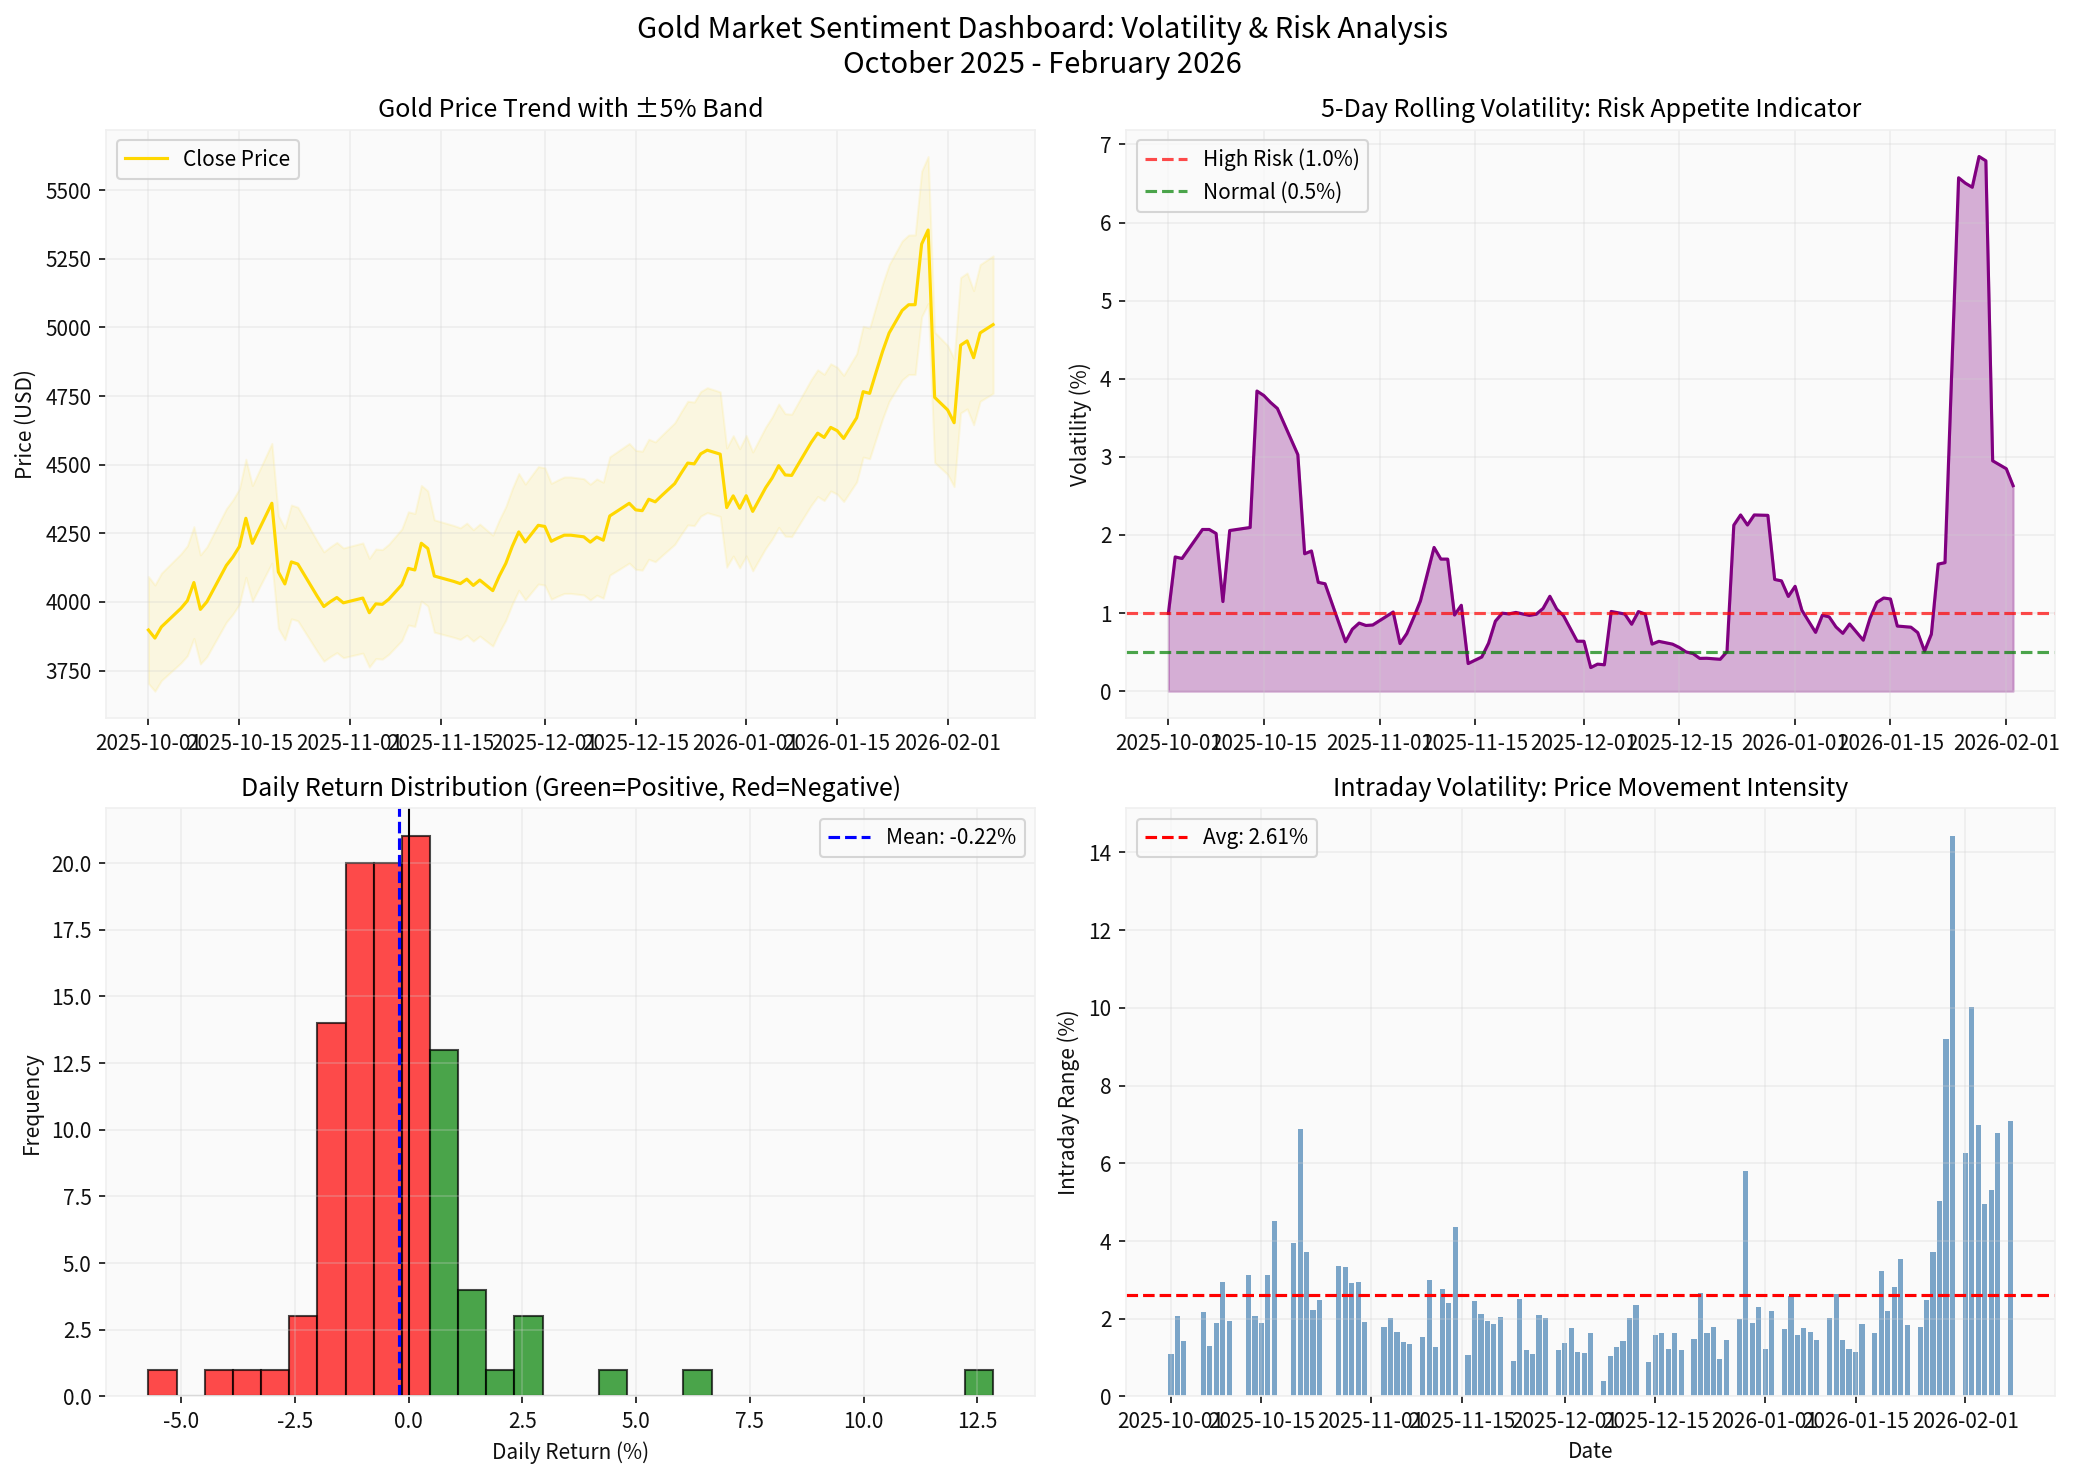
| Average Intraday Range | 2.83% | Moderate price movement intensity |
| Gap Open Volatility | 3.48% | Significant overnight news impact |
| Days with Significant Gaps (>1%) | 33 out of 60 | 55% of trading days show overnight shifts |
Gold has historically served as an
| Volatility Pattern | Inflation Sentiment Implication |
|---|---|
Elevated volatility with price decline |
Market pricing in higher rates; reduced inflation hedge demand |
Sustained narrow range with upward bias |
Inflation concerns; defensive positioning |
Wide intraday swings with no clear direction |
Uncertainty about Fed trajectory; conflicting inflation signals |
Low volatility with declining prices |
Confidence in inflation moderation; complacency |
The data reveals a
- Recent 10-day performance: -1.21% cumulative decline with 5 negative days versus 4 positive days
- Volatility ratio: 0.40 (current volatility vs. average) indicatesreduced inflation anxiety
- Average gap opening: -0.40% suggests overnight repricing towarddeflationary expectations
This pattern indicates that markets are currently
- Federal Reserve projections of limited additional rate cuts through 2026 [1]
- PCE inflation stabilization since September 2023 [2]
- Growth expectations revised higher to ~2.3% [3]
Gold’s status as a
| Indicator | Current Reading | Risk Assessment |
|---|---|---|
| Gap Open Volatility | 3.48% | Elevated – frequent overnight news shocks |
| Max Intraday Range | 14.41% | Extreme event – major news driver |
| Days with >1% Gap | 55% of trading sessions | Persistent uncertainty |
| Current Volatility Regime | Complacent (0.40 ratio) | Short-term risk discount |
- Sudden Volatility Spikes: Typically correlate with geopolitical developments (e.g., conflicts, sanctions, diplomatic crises)
- Sustained Elevated Volatility: Indicates prolonged uncertainty period (regional conflicts, trade wars)
- Narrowing Ranges: Suggests risk appetite normalization or diplomatic de-escalation
The data shows
| Regime | Volatility Level | Market Psychology |
|---|---|---|
Low |
< 0.5% | Complacent; diminished perceived risks |
Normal |
0.5% - 1.0% | Balanced risk assessment |
Elevated |
1.0% - 2.0% | Cautious; elevated uncertainty |
High |
> 2.0% | Fearful; crisis-level risk aversion |
- Short-term geopolitical risks are being discounted
- Inflation expectations are well-anchored
- Market attention may be shifting to other factors (earnings, economic data)
- Defensive positioning reduced: Low volatility suggests markets believe inflation is under control
- Rate cut expectations: JPMorgan forecasts suggest potential rate cutting cycles of 150-200 basis points through 2026, which could reignite gold demand [6]
- Real yield environment: Negative real rates historically support gold; current normalization may explain reduced volatility
- Structural support remains: Despite low volatility, the elevated gap frequency indicates underlying geopolitical tensions
- Central bank buying: Steady official sector accumulation provides structural support regardless of headline volatility [7]
- Regime shift potential: Low volatility regimes can quickly transition to elevated states upon geopolitical triggers
- Marginal intraday volatility serves as a real-time sentiment gaugefor both inflation expectations and geopolitical risks
- Current low volatility (0.64%) indicates market complacencytoward immediate inflation concerns
- Elevated gap opening frequency (55%) reveals persistent geopolitical uncertaintybeneath the surface
- Volatility regime transitions—from current complacent state to elevated regimes—typically precede significant price movements
- ** JPMorgan’s $6,300/oz target** by Q4 2026 suggests institutional conviction in continued structural support despite current volatility compression [8]
[0] Ginlix API Data - Gold (GCUSD) intraday and historical price analysis
[1] American Hartford Gold - “Uncertain Fed: Holding Rates, Shifting Leadership” (https://www.americanhartfordgold.com/uncertain-fed-holding-rates-shifting-leadership/)
[2] Reuters Graphics - Inflation Indicators Chart (https://graphics.reuters.com/USA-FED/INFLATION/gkvlgnaywpb/chart.png)
[3] American Hartford Gold - Fed Policy Analysis (https://www.americanhartfordgold.com/uncertain-fed-holding-rates-shifting-leadership/)
[4] AGF Investments - “Seven Reasons to Keep the Faith in Gold” (https://perspectives.agf.com/seven-reasons-to-keep-the-faith-in-gold/)
[5] BNN Bloomberg - “How Gold Came to Trade Like a Meme Stock” (https://www.bnnbloomberg.ca/markets/gold/2026/02/06/how-the-worlds-most-boring-investment-started-trading-like-a-meme-stock/)
[6] Discovery Alert - “Investors Predict Gold $5000 in 2026: Bank Forecasts” (https://discoveryalert.com.au/central-bank-diversification-gold-forecasts-2026/)
[7] AGF Perspectives - Geopolitical and Central Bank Analysis (https://perspectives.agf.com/seven-reasons-to-keep-the-faith-in-gold/)
[8] TheStreet - “J.P. Morgan Revises Gold Price Target for 2026” (https://www.thestreet.com/investing/j-p-morgan-revises-gold-price-target-for-2026)
Insights are generated using AI models and historical data for informational purposes only. They do not constitute investment advice or recommendations. Past performance is not indicative of future results.
About us: Ginlix AI is the AI Investment Copilot powered by real data, bridging advanced AI with professional financial databases to provide verifiable, truth-based answers. Please use the chat box below to ask any financial question.