Expedia Group (EXPE): Outperform Rating Analysis & Competitive Positioning
Unlock More Features
Login to access AI-powered analysis, deep research reports and more advanced features

About us: Ginlix AI is the AI Investment Copilot powered by real data, bridging advanced AI with professional financial databases to provide verifiable, truth-based answers. Please use the chat box below to ask any financial question.
Related Stocks
Evercore ISI has maintained its
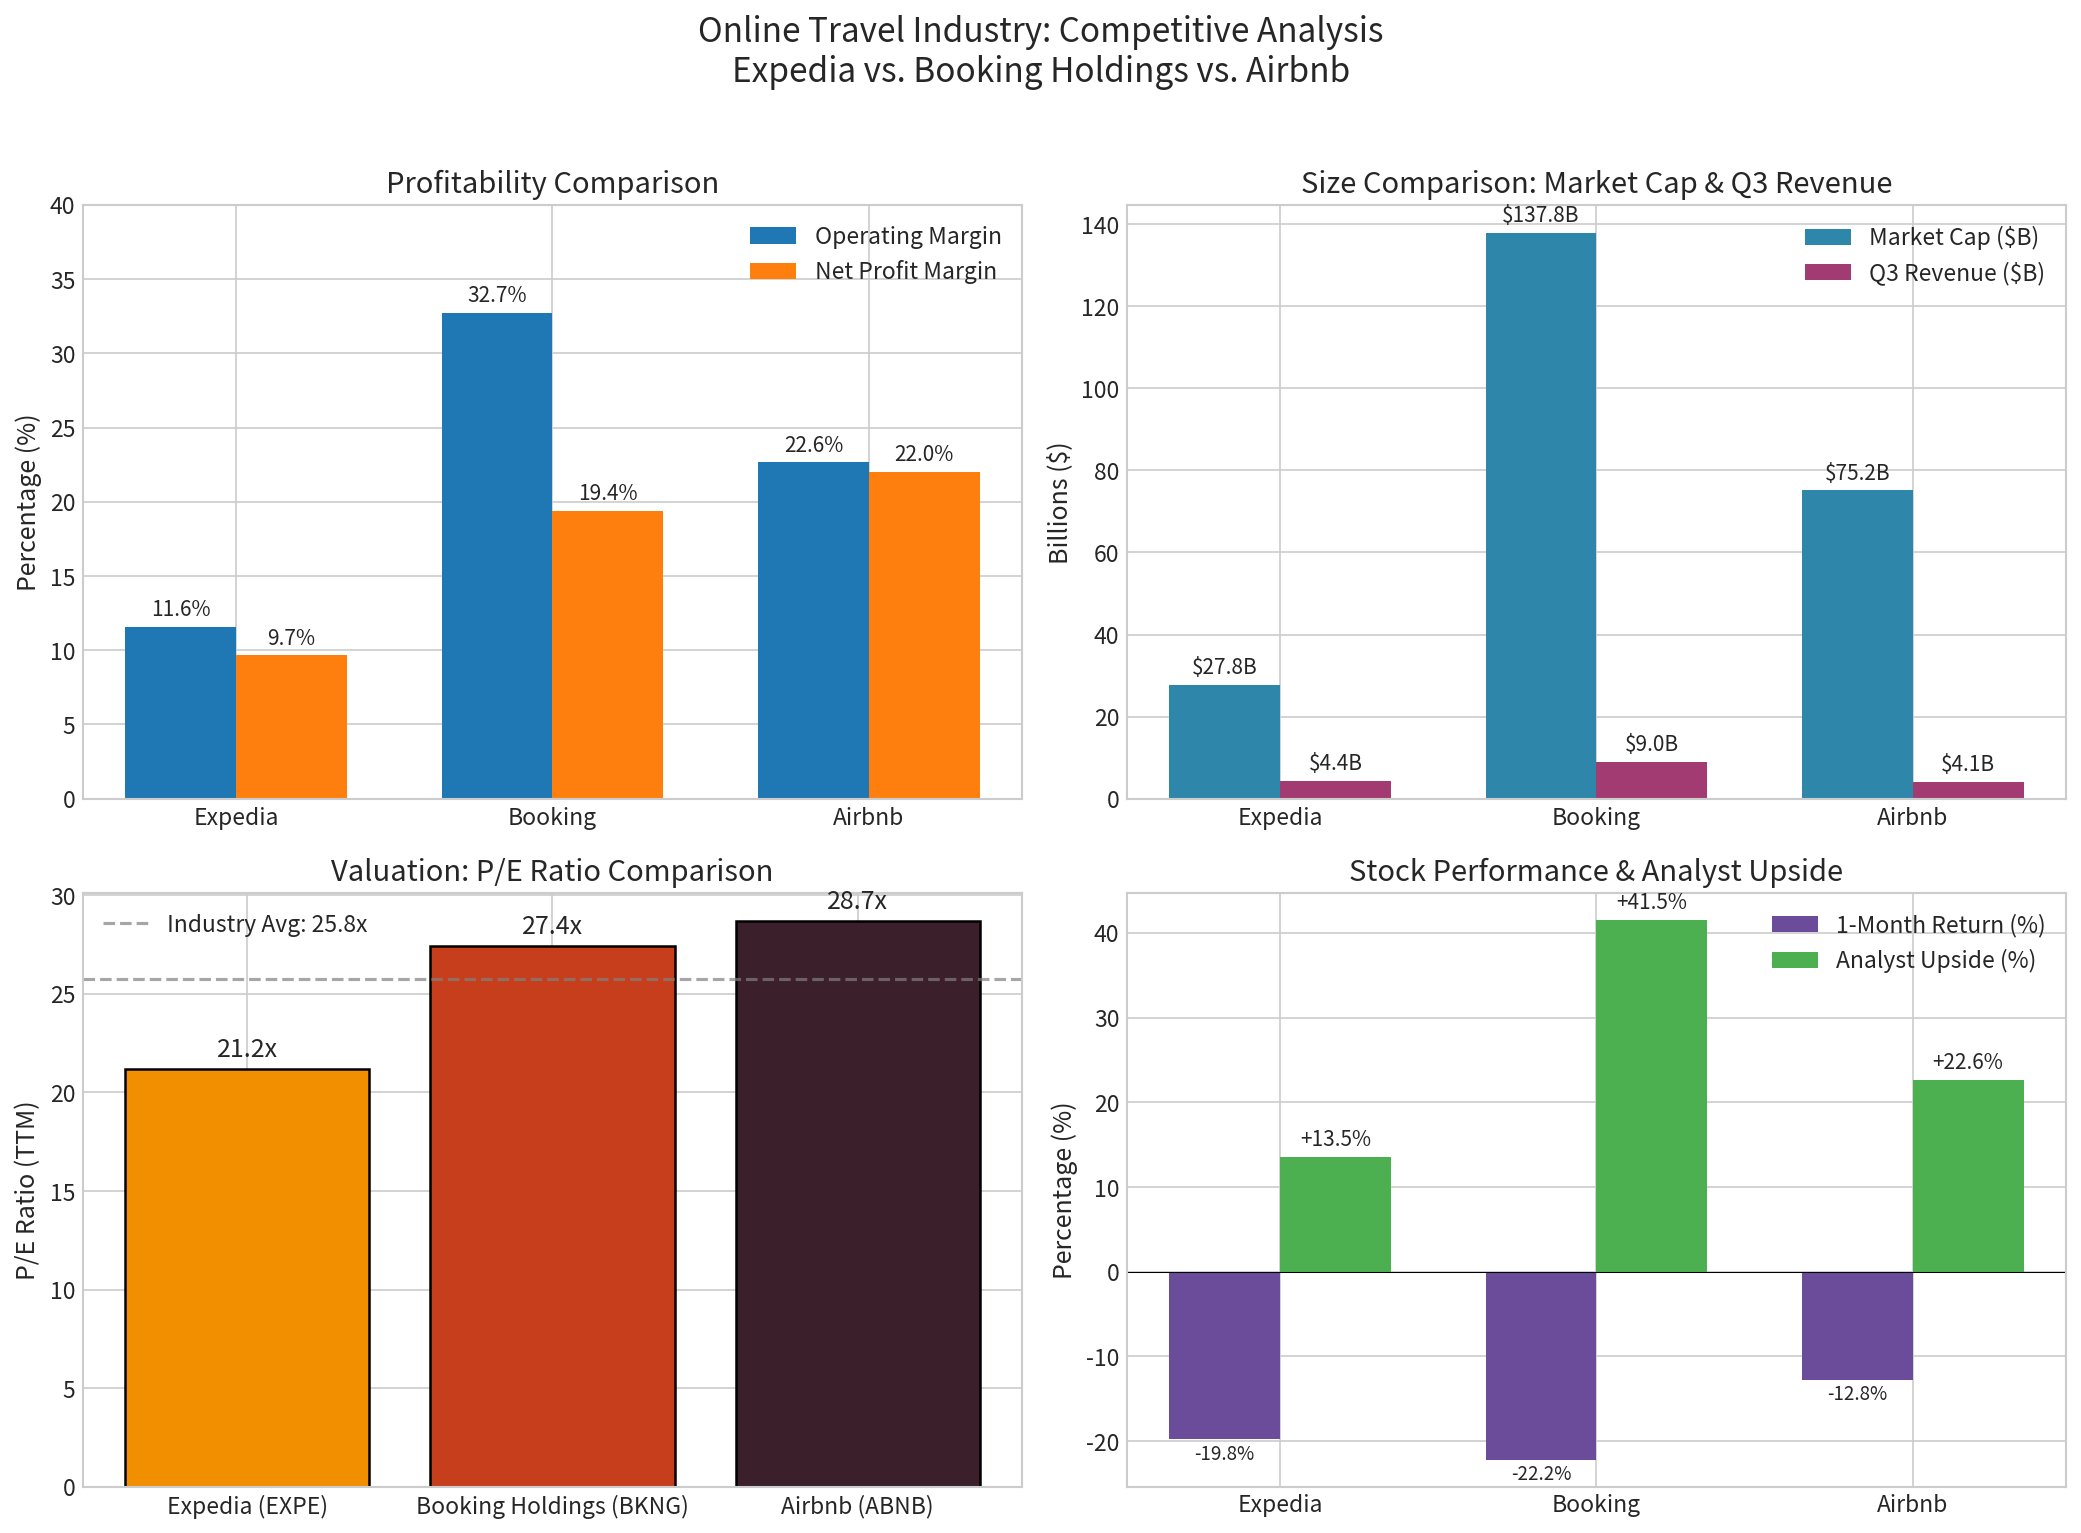
Expedia trades at
| Company | P/E Ratio | Relative Valuation |
|---|---|---|
Expedia (EXPE) |
21.19x |
Most undervalued |
| Booking Holdings (BKNG) | 27.44x | 29% premium |
| Airbnb (ABNB) | 28.70x | 35% premium |
Evercore notes that Expedia’s valuation remains approximately
Expedia’s new CEO Ariane Gorin has driven meaningful operational improvements in 2025[3]:
- Q3 FY2025 Revenue: $4.41 billion (+3.0% vs. estimates)
- Q3 FY2025 EPS: $7.57 (+8.6% vs. $6.97 estimate)
- Stronger room night growthcompared to prior periods
- Improved marketing efficiencyreducing customer acquisition costs
The company’s 2025 turnaround has demonstrated clear recovery momentum, with the CEO projecting 2026 will be “very big” for U.S. tourism[3][4].
Despite industry-wide challenges, Expedia has delivered superior returns[0]:
| Metric | EXPE | BKNG | ABNB |
|---|---|---|---|
1-Year Return |
+17.14% |
-13.01% | -10.15% |
| 1-Month Return | -19.75% | -22.17% | -12.75% |
| YTD Return | -15.96% | -19.70% | -8.65% |
Expedia’s
- Evercore ISI Target: $350.00 (47% upside from current levels)
- Consensus Target: $270.00 (13.5% upside)
- Target Range: $200.00 - $330.00[0][2]
With 44.6% of analysts rating EXPE a “Buy” and a consensus price target suggesting meaningful upside, the stock offers compelling risk-reward.
The online travel agency (OTA) industry shows clear market leadership dynamics[5][6]:
| Company | Market Share | Position |
|---|---|---|
| Booking Holdings | ~40% | Market Leader |
| Airbnb | ~18-19% | Growing Sharply |
Expedia Group |
~15% | #2 Position Under Pressure |
| Trip.com Group | Regional | Asian Markets |
| Metric | EXPE | BKNG | Implication |
|---|---|---|---|
Market Cap |
$27.82B | $137.78B | BKNG is 5x larger |
Operating Margin |
11.60% | 32.74% | BKNG 2.8x more efficient |
Net Margin |
9.66% | 19.37% | BKNG 2x profitability |
Current Ratio |
0.74 | 1.33 | BKNG better liquidity |
P/E Ratio |
21.19x | 27.44x | EXPE 23% discount |
- Trades at significant discount to market leader
- Stronger presence in North American market
- More diverse brand portfolio (Expedia, Hotels.com, Vrbo)
- Superior profitability and margins
- Better liquidity position
- Dominance in international markets
- Higher ROE (when positive)
| Metric | EXPE | ABNB | Implication |
|---|---|---|---|
Q3 Revenue |
$4.41B | $4.09B | Similar scale |
Operating Margin |
11.60% | 22.65% | ABNB 2x more efficient |
Net Margin |
9.66% | 22.03% | ABNB significantly higher |
ROE |
1.16% | 32.14% | ABNB vastly superior |
Beta |
1.38 | 1.10 | ABNB less volatile |
P/E Ratio |
21.19x | 28.70x | EXPE 26% discount |
- Lower valuation multiple
- Broader service offerings (lodging + air + packages)
- Established brand portfolio
- Superior profitability metrics
- Better return on equity
- Lower volatility profile
- Stronger EMEA presence (48% of revenue)[0]
┌────────────────────────┬──────────┬──────────┬──────────┐
│     Factor             │  EXPE    │   BKNG   │   ABNB   │
├────────────────────────┼──────────┼──────────┼──────────┤
│ Valuation Attractiveness│   ★★★    │    ★★    │    ★★    │
│ Margin Profile         │    ★★    │   ★★★    │   ★★★    │
│ Market Share           │    ★★    │   ★★★    │   ★★★    │
│ Liquidity              │    ★     │   ★★★    │   ★★★    │
│ Growth Momentum        │   ★★★    │    ★★    │    ★★    │
│ Balance Sheet Strength │    ★★    │   ★★★    │   ★★★    │
│ Analyst Sentiment      │   ★★★    │   ★★★    │    ★★    │
├────────────────────────┼──────────┼──────────┼──────────┤
│ OVERALL RATING         │   19/28  │  23/28   │  22/28   │
└────────────────────────┴──────────┴──────────┴──────────┘
- Trend: Sideways/No clear trend
- Support Level: $232.11
- Resistance Level: $267.47
- Beta: 1.38 (vs. SPY)
- Trading Range: $232-$267
The stock is currently trading near the bottom of its established range, potentially offering a favorable entry point.
- Market Share Erosion: Expedia continues to lose ground to Booking Holdings and Airbnb[6]
- Margin Pressure: Operating margin (11.6%) significantly lags peers (22-33%)
- Liquidity Concerns: Current ratio of 0.74 indicates potential short-term financial stress
- Marketing Intensity: Heavy advertising spend required to compete with larger rivals
- Google Canvas/SEO Risk: Competition from Google’s travel search features
Evercore ISI’s
- Valuation Arbitrage: Trading at 21.2x P/E (vs. 27-29x for peers) with ~20% upside to consensus
- Turnaround Validation: New leadership delivering earnings beats and improved operational metrics
- Relative Strength: Outperforming peers on a one-year basis despite competitive pressures
- Recovery Catalyst: 2026 expected to be a strong year for travel demand
While Expedia faces margin and market share challenges versus Booking Holdings and Airbnb, its
[0] 金灵API - Expedia Group Company Overview
[1] Intellectia.ai - Evercore ISI Names Amazon and Expedia as Top Long Picks for 2026
[2] Investing.com - Expedia Stock Rating Reiterated at Outperform by Evercore
[3] Hospitality Today - Expedia’s 2025 Turnaround Gains Momentum
[4] Fortune - Expedia Group CEO on 2026 Outlook
[5] CSIMarket - EXPE Market Share vs Competitors Q3 2025
[6] Skift - 10 Biggest Online Travel Agencies
[7] 金灵API - Expedia Technical Analysis
Insights are generated using AI models and historical data for informational purposes only. They do not constitute investment advice or recommendations. Past performance is not indicative of future results.
About us: Ginlix AI is the AI Investment Copilot powered by real data, bridging advanced AI with professional financial databases to provide verifiable, truth-based answers. Please use the chat box below to ask any financial question.