Tech Sector Pullback Analysis: Smart Money Rotation Patterns and Strategic Implications
Unlock More Features
Login to access AI-powered analysis, deep research reports and more advanced features
About us: Ginlix AI is the AI Investment Copilot powered by real data, bridging advanced AI with professional financial databases to provide verifiable, truth-based answers. Please use the chat box below to ask any financial question.
Related Stocks
The February 9, 2026 analysis arrives at a pivotal moment for U.S. equity markets, following an early February selloff that created significant sector dislocation. From February 3-5, 2026, the NASDAQ Composite declined -1.74% and -1.35% on consecutive days, establishing the technical backdrop that Jay Woods identifies as the beginning of a broader tech sector correction [0][1]. This timing is particularly relevant given that technology stocks had delivered years of outperformance, with price-to-earnings ratios reaching unsustainable levels of 40-50 for many momentum names [1].
The current market environment demonstrates classic characteristics of sector rotation following extended periods of concentrated gains. Recent trading data reveals sector performance patterns consistent with Woods’ thesis: the Utilities sector emerged as the best performer on February 9, advancing +2.21%, while Consumer Defensive lagged at -0.75% [0]. The NASDAQ Composite recovered +1.37% and the S&P 500 gained +0.80% on the same day, suggesting the tech pullback represents a correction within an ongoing uptrend rather than a definitive trend reversal [0].
Woods’ characterization of technology stocks as “digesting gains” receives substantial validation from Microsoft Corporation (MSFT) performance metrics. Over the analyzed period, MSFT declined -10.97%, experienced a 22.34% price range with elevated daily volatility of 3.26%, and traded near 12-month lows while fighting to maintain position above the 40-week moving average [0][1]. These metrics confirm meaningful weakness in at least one major tech constituent.
However, Apple Inc. (AAPL) presents a more complex picture, demonstrating +5.00% gains over the same period with significantly lower volatility of 1.75% and a narrower 12.74% price range [0]. This divergence between major tech names suggests the rotation thesis applies more accurately to certain categories of technology companies—particularly those with higher valuations and greater sensitivity to interest rate movements—while quality names with strong cash flows and established market positions continue to attract institutional support [1].
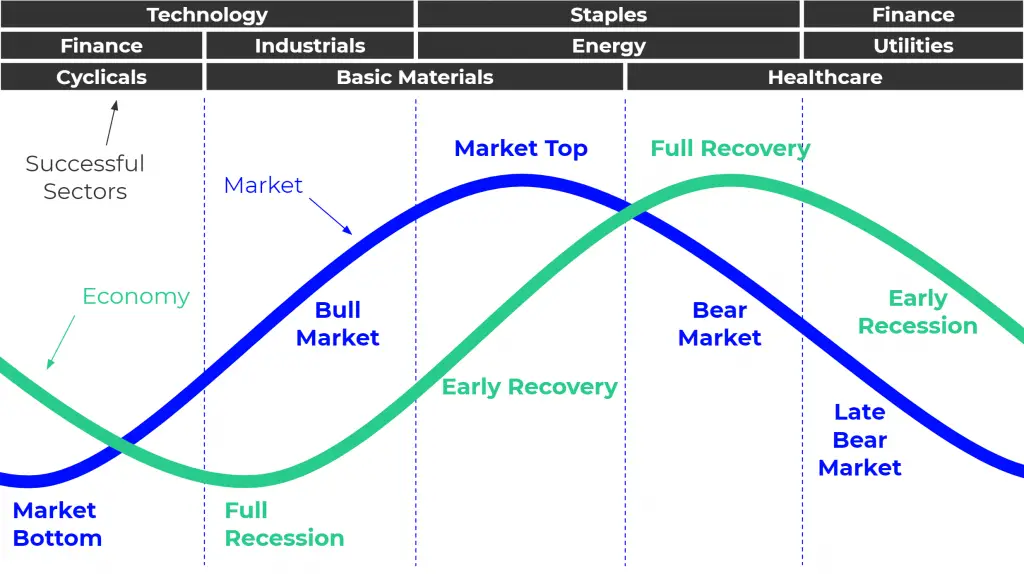
The analysis identifies four primary sectors receiving institutional inflows: Financials, Utilities and Energy, Consumer Staples, and Healthcare. Current market data provides mixed validation for these rotation targets [1].
The rotation pattern reflects several interconnected market dynamics. First, extended tech outperformance created concentrated risk exposures that institutional investors are actively managing through diversification into sector laggards [1]. Second, Federal Reserve policy expectations influence sector rotations, with financials benefiting from anticipated rate normalization while rate-sensitive growth stocks face multiple compression [1]. Third, energy sector strength reflects both traditional defensive positioning and specific policy tailwinds affecting infrastructure investments [1].
The timing of this rotation appears connected to AI capital expenditure sustainability concerns. Woods notes uncertainty regarding whether productivity gains from AI investments justify current valuations, creating reluctance among institutional investors to maintain or increase tech sector allocations at current price levels [1]. This uncertainty drives the search for alternatives offering more attractive risk-reward profiles.
The integration of technical, fundamental, and flow-based analysis reveals strong correlations supporting the rotation thesis while highlighting important nuances. Technical indicators confirm sector weakness in high-valuation tech names—the MSFT 22% price range and elevated volatility represent meaningful deviation from historical norms [0]. Simultaneously, fundamental sector analysis supports the financial and utility rotation themes based on valuation differentials and anticipated catalyst timing [1].
The consumer staples and healthcare rotation thesis requires more careful interpretation. Current sector performance data suggests these rotations remain nascent or face headwinds that may delay institutional capital deployment. Decision-makers should distinguish between rotation themes with immediate validation (financials, utilities) and those requiring longer observation periods (healthcare, consumer staples) [0].
Woods projects a specific timeline for sector rotation effectiveness: near-term volatility in technology through April 2026, anticipated tech bottom around May 2026, followed by “sub-quarter pops” in rotation sectors during Q2-Q3 2026 [1]. This timeline provides a framework for monitoring rotation effectiveness, though multiple factors could alter the projected course.
The early February 2026 selloff established dislocation that created entry opportunities for rotation strategies, but the NASDAQ Composite’s +1.37% recovery on February 9 demonstrates that risk appetite remains present in equity markets [0]. This recovery suggests the tech correction may be shallower than historical averages if institutional support returns quickly.
The divergence between MSFT (-10.97%) and AAPL (+5.00%) performance reveals critical insight about technology sector composition. Not all technology companies face equal pressure—quality names with strong balance sheets, established market positions, and sustainable business models demonstrate relative resilience [0]. This suggests rotation within the technology sector toward quality may be occurring alongside broader sector rotation into financials and utilities [1].
The following indicators warrant close observation: 40-week moving average levels for major technology names; 200-day simple moving average support levels for rotation sectors; sector fund flow data for confirmation of rotation thesis; upcoming employment and inflation reports affecting Federal Reserve expectations; and quarterly earnings reports validating sector fundamentals [1].
This analysis presents market data and expert interpretation regarding sector rotation dynamics as of February 9, 2026. Technology sector digestion following years of outperformance represents the primary market theme, with Microsoft Corporation demonstrating significant correction metrics while Apple Inc. shows relative resilience. Institutional “smart money” rotation appears active in financial services and utilities/energy sectors, validated by JPMorgan Chase (+4.34%) and NextEra Energy (+9.32%) performance [0].
The Consumer Staples and Healthcare rotations remain in earlier stages based on current sector performance data, requiring additional observation for thesis confirmation [0]. The projected timeline anticipates technology sector bottoming around May 2026, with subsequent sector leadership rotation to financials, utilities, healthcare, and consumer staples during Q2-Q3 2026 [1].
All observations are based on market data as of the event timestamp and analyst interpretations. Investment decisions should incorporate additional research, risk tolerance assessment, and consultation with qualified financial professionals as appropriate.
Insights are generated using AI models and historical data for informational purposes only. They do not constitute investment advice or recommendations. Past performance is not indicative of future results.
About us: Ginlix AI is the AI Investment Copilot powered by real data, bridging advanced AI with professional financial databases to provide verifiable, truth-based answers. Please use the chat box below to ask any financial question.