Post-Market Recap: February 09, 2026
Unlock More Features
Login to access AI-powered analysis, deep research reports and more advanced features

About us: Ginlix AI is the AI Investment Copilot powered by real data, bridging advanced AI with professional financial databases to provide verifiable, truth-based answers. Please use the chat box below to ask any financial question.
Related Stocks
U.S. equity markets demonstrated resilience on February 9, 2026, with all major indices closing higher despite ongoing sector rotation and elevated uncertainty surrounding upcoming economic data releases. The Nasdaq Composite led gains with a 0.9% advance, reflecting a modest rebound in technology stocks following several sessions of pronounced weakness. The S&P 500 rose 0.5%, breaking above key moving average resistance levels and approaching all-time highs. The Dow Jones Industrial Average added marginal gains, remaining within striking distance of the historic 50,000 milestone achieved earlier in the week.
Market breadth improved throughout the session, with advancing issues outpacing declining stocks across both exchanges. However, beneath the surface-level positivity, significant sector rotation continued as institutional investors maintained a defensive posture. Consumer staples, energy, and industrials attracted capital flows, while information technology and communication services faced persistent headwinds. The Consumer Staples Select Sector SPDR Fund has generated a 13% year-to-date return, starkly contrasting with the Nasdaq-100’s 20% year-to-date decline during the same period [0].
After-hours trading featured notable earnings releases from Becton Dickinson, Arch Capital Group, and ON Semiconductor, producing mixed reactions that underscored ongoing volatility in individual stock selection. The labor market’s health remains a central concern for investors, with the delayed December 2025 JOLTS data scheduled for release and January CPI inflation data set to arrive on February 13, 2026, at 8:30 AM ET [1]. These upcoming economic reports are expected to provide critical guidance for Federal Reserve policy decisions in 2026, with markets increasingly pricing in the probability of rate cuts as labor market indicators show signs of softening.
| Index | Close (Feb 9, 2026) | Change | Status |
|---|---|---|---|
| S&P 500 | 6,964.82 | +32.52 (+0.5%) | Higher |
| Dow Jones Industrial Average | 50,135.87 | +20.20 (<0.1%) | Higher |
| Nasdaq Composite | 23,238.67 | +207.46 (+0.9%) | Higher |
| Russell 2000 | 2,689.05 | +18.71 (+0.7%) | Higher |
| Security | Yield | Change |
|---|---|---|
| 10-Year Treasury | 4.22% | +1.0 bps |
| 2-Year Treasury | Monitored for yield curve signals |
| Indicator | Current Reading | Interpretation |
|---|---|---|
| Fear & Greed Index | 14 (Feb 2, 2026) | Extreme Fear |
| S&P 500 Momentum (Daily) | Negative | Bearish signal |
| S&P 500 Momentum (Weekly) | Negative | Bearish signal |
| Nasdaq-100 RSI | 31.5-34.5 | Oversold conditions |
| Leading Sectors | YTD Performance | Lagging Sectors | YTD Performance |
|---|---|---|---|
| Consumer Staples | +13% | Information Technology/Software | -20% |
| Energy | Strong performer | Communication Services | Under pressure |
| Industrials | Benefiting from reflation | ||
| Materials | Strong gains |
The February 9, 2026 regular trading session exhibited a constructive tone across U.S. equity markets, with all four major indices recording positive closes. The S&P 500’s gain of 32.52 points, representing a 0.5% increase, brought the index to 6,964.82—within striking distance of its all-time high reached earlier in the week [0]. The index successfully broke above key technical resistance levels, including the 50-day and 20-day moving averages, signaling potential short-term technical strength despite underlying concerns about market breadth and sector concentration.
The Nasdaq Composite’s standout performance, advancing 207.46 points or 0.9% to close at 23,238.67, indicated a meaningful rebound in technology shares following an extended period of pronounced weakness [0]. This tech-focused rally provided relief for investors who had endured significant losses in growth-oriented positions throughout early February. The magnitude of the Nasdaq’s advance exceeded that of the S&P 500 by a factor of nearly two, suggesting that market participants were beginning to selectively reallocate capital into quality technology names at discounted valuations.
The Dow Jones Industrial Average’s modest gain of 20.20 points, bringing the index to 50,135.87, reflected the index’s price-weighted calculation methodology and the mixed performance of its 30 constituent components [0]. Despite the minimal percentage change, the Dow remained firmly entrenched above the psychologically significant 50,000 level—a milestone that captured substantial media attention and represented a symbolic achievement for U.S. equity markets. The Russell 2000’s 0.7% advance, adding 18.71 points to close at 2,689.05, suggested renewed interest in small-capitalization stocks, though the index remains well below its 2025 highs.
:max_bytes(150000):strip_icc()/GettyImages-479930734-59961901aad52b0010e6e17d.jpg)
Federal Reserve officials continued to emphasize a data-dependent approach to monetary policy throughout the session, reinforcing market expectations that 2026 rate cuts remain contingent upon incoming economic information [0]. The Fed’s communication strategy has positioned upcoming labor market and inflation data as critical determinants of the policy path, creating an environment of heightened anticipation surrounding scheduled releases. Investors have adjusted their expectations accordingly, with probability calculations for rate cuts increasing as multiple labor market indicators suggest gradual softening. The Treasury market’s yield movements—particularly the 10-year’s position at 4.22% with minimal change—reflect investor uncertainty about the inflation trajectory and the Fed’s ultimate policy path [0].
The Michigan Consumer Sentiment index exceeded market expectations, providing a boost to risk appetite during the session [0]. Consumer confidence data serves as a timely indicator of household economic outlook and spending intentions, and the positive surprise helped offset concerns about the broader economic trajectory. However, consumer sentiment readings can diverge from actual spending behavior, and the improvement in sentiment stands in contrast to some underlying economic fundamentals that have shown mixed signals in recent weeks. The disconnect between sentiment and fundamentals underscores the importance of monitoring actual economic data rather than relying solely on survey-based indicators.
Margin-driven liquidations in commodities, particularly precious metals and cryptocurrencies, contributed to elevated trading volatility during the session [0]. Bitcoin’s breach of the $65,000 support level triggered automated selling programs and exacerbated downside pressure on digital asset-related equities [0]. The cascade effect extended to related sectors, including mining companies and blockchain-adjacent technology firms, creating additional headwinds that partially offset strength in other market segments. The correlation between cryptocurrency weakness and equity market risk appetite has strengthened in recent months, making digital asset technical levels an increasingly relevant indicator for traditional equity traders.
The Consumer Staples sector’s continued outperformance represents one of the most significant sector rotation stories of early 2026, with the Consumer Staples Select Sector SPDR Fund registering a 13% year-to-date return that dramatically outpaces the broader market [0]. This defensive rotation reflects investor preference for companies with stable earnings profiles, predictable cash flows, and pricing power that can navigate an environment of elevated uncertainty. The magnitude of this sector dispersion—XLP’s +13% return versus the Nasdaq-100’s -20% decline—represents an extreme reading that suggests the rotation may have overshot equilibrium levels [0]. Such pronounced sector divergence typically cannot be sustained indefinitely, though timing the reversal remains challenging given legitimate fundamental concerns driving the current allocation patterns.
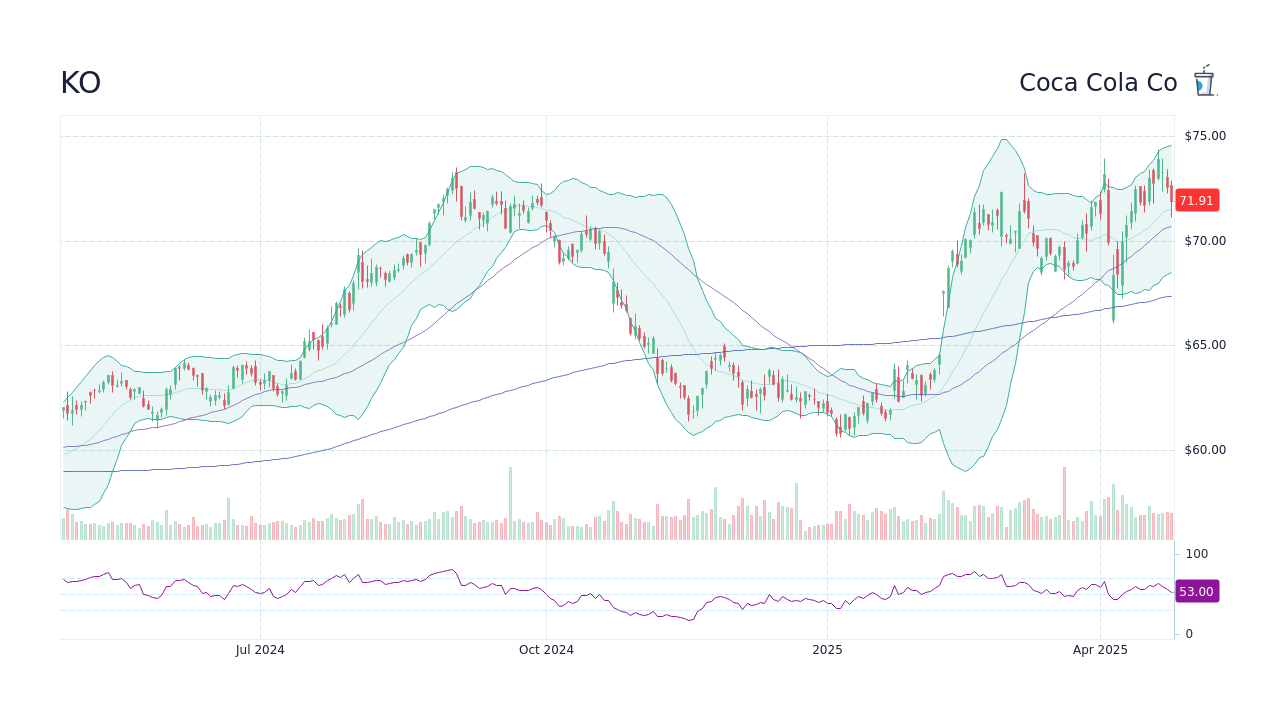
Within the consumer staples sector, individual company performance has varied significantly. Coca-Cola’s surge to a record high of $79.03 on February 6, 2026—representing a 17% gain over five weeks—demonstrates the sector’s appeal as a defensive haven during periods of market stress [0]. The beverage giant has attracted substantial institutional interest, with major holders including Berkshire Hathaway and Vanguard maintaining substantial positions. Despite modest concerns about Frito-Lay North America volumes dipping 2% in early 2026, the broader consumer staples sector’s fundamentals remain intact, supported by relatively inelastic demand for essential household products.
Energy stocks maintained their strong year-to-date performance, benefiting from continued supply concerns and geopolitical tensions that have supported elevated crude oil prices [0]. The sector’s correlation with inflation expectations and its role as a traditional inflation hedge have made energy an attractive allocation for investors seeking protection against potential price pressures. Major energy companies have reported solid earnings beats, with integrated majors and exploration-and-production companies alike benefiting from favorable pricing environments.
Industrials and materials sectors continued to attract capital flows as investors positioned for a potential reflation narrative [0]. The industrial sector’s exposure to infrastructure spending, manufacturing activity, and economic reopening themes has resonated with participants who believe the economy will achieve a “soft landing” despite mounting headwinds. Materials companies, particularly those with exposure to industrial metals and construction-related end markets, have benefited from infrastructure spending initiatives and supply constraints that have supported pricing power.
The technology sector’s continued underperformance represents the most significant sector story of early 2026. Information technology stocks have declined approximately 20% year-to-date, with software names bearing the brunt of the selling pressure [0]. The weakness in software reflects multiple factors, including valuation compression following periods of excessive optimism, concerns about artificial intelligence capital expenditure returns, and rotation into more defensive market segments. Major technology companies have experienced substantial market value destruction, with Microsoft losing approximately $400 billion in market capitalization within a single week and Amazon declining 8% following an announcement of projected AI and cloud infrastructure spending exceeding $200 billion [0].
Trading volume patterns on February 9, 2026, revealed continued institutional rebalancing activity as portfolio managers adjusted exposures in response to evolving market conditions. The session’s volume was elevated relative to recent averages, though not sufficiently extreme to indicate panic-driven liquidation or euphoric accumulation. Market participants appeared to be actively managing positions in anticipation of high-impact economic data releases scheduled for the coming days.
Institutional flow data indicates significant capital redistribution across market capitalizations and sectors. Large-capitalization technology stocks experienced net outflows as portfolio managers reduced concentrations that had accumulated during the 2024-2025 bull market. Small-capitalization stocks, as measured by the Russell 2000, attracted modest inflows as investors sought value opportunities in segments that had lagged the broader market rally.
The Consumer Staples sector’s volume patterns reflected strong institutional demand, with XLP experiencing above-average trading volumes as investors rushed to establish defensive positions [0]. The volume surge in defensive sectors typically indicates a flight-to-quality dynamic, with capital flowing toward companies perceived as able to weather potential economic turbulence. Consumer staples companies benefit from relatively inelastic demand for essential household products, making them attractive defensive allocations during periods of uncertainty.
The rotation from growth to value, and from technology to defensive sectors, represents one of the most significant institutional flow stories of early 2026. Institutional investors have demonstrably pulled back from Magnificent 7 technology stocks following revelations of aggregate AI infrastructure spending exceeding $500 billion across the technology sector [0]. Major companies have experienced substantial market value destruction—Microsoft lost approximately $400 billion in market capitalization within a single week, while Amazon declined 8% following an announcement of projected AI and cloud infrastructure spending exceeding $200 billion [0]. Retail investors have also participated in the tech exodus, pulling more than $4 billion from Apple stock alone during the recent period of weakness [0]. This spending, while potentially laying groundwork for future productivity gains and revenue growth, has raised concerns about near-term return on investment and capital allocation efficiency that have prompted institutions to reallocate toward more defensive positioning.
The divergence between consumer staples and technology performance—XLP’s +13% year-to-date return versus the Nasdaq-100’s -20% year-to-date decline—represents an extreme reading that suggests the rotation may have overshot equilibrium levels [0]. Such pronounced sector dispersion typically cannot be sustained indefinitely, though timing the reversal remains challenging given the legitimate fundamental concerns driving the rotation.
Individual stock volume patterns revealed interesting dynamics within specific market segments. Coca-Cola’s surge to a record high of $79.03 on February 6, 2026, accompanied by a 17% gain over five weeks, attracted significant institutional attention [0]. The beverage giant’s performance reflects its status as a defensive haven play during periods of market stress, with major institutional holders including Berkshire Hathaway and Vanguard maintaining substantial positions. Despite Frito-Lay North America volumes dipping 2% in early 2026—a modest concern for parent company PepsiCo—the broader consumer staples sector’s fundamentals remain intact.
The Fear & Greed Index’s reading of 14 as of February 2, 2026, indicates Extreme Fear sentiment that has historically preceded market rebounds [0]. While sentiment indicators are contrarian by nature and extremely low readings have sometimes marked local bottoms, the current reading reflects genuine investor concern about multiple risk factors including AI capital expenditure returns, Federal Reserve policy uncertainty, and geopolitical tensions.
S&P 500 momentum gauges turned negative on both daily and weekly timeframes for the first time since late 2025, with the MACD indicator experiencing a bearish rollover [0]. Momentum breakdowns often precede price declines, though they can also signal oversold conditions that eventually reverse. The combination of negative momentum and oversold readings in the Nasdaq-100 (RSI between 31.5-34.5) creates a mixed technical picture that suggests potential volatility in coming sessions [0].
The S&P 500’s technical setup on February 9, 2026, reflects a market in transition, with the index trading near important support and resistance levels that will likely determine near-term direction. The index breached key support at the 6,870 level during early February weakness, establishing the next significant support zone at 6,735, which corresponds to the Ichimoku cloud formation [0].
| Type | Level | Significance |
|---|---|---|
| Support | 6,800-6,820 | Critical near-term support zone; Ichimoku cloud boundary |
| Support | 6,720-6,722 | Secondary support; 200-day moving average proximity |
| Support | 6,630 | Technical support level; previous consolidation area |
| Resistance | 6,945 | Immediate overhead resistance; reaction high |
| Resistance | 6,990-7,000 | Major psychological resistance; round number |
| Resistance | 7,050-7,075 | All-time high consolidation zone |
The index’s ability to reclaim and hold above the 6,800-6,820 support zone represents a critical technical threshold that will determine near-term market character. A sustained breach below this level would signal potential further downside and could trigger technical selling from systematic strategies that monitor moving averages and trend-following indicators. Conversely, a successful consolidation above this zone would improve the technical outlook and potentially attract momentum buyers seeking to participate in any continued rally toward all-time highs.
The Nasdaq Composite’s movement through key moving averages provides important context for technical traders and systematic strategies. The 100-day moving average continues to serve as a reference point for longer-term trend assessment, while the 50-day and 20-day moving averages have acted as resistance levels that the index is now working to overcome [0]. The Nasdaq-100 RSI reading between 31.5 and 34.5 indicates oversold conditions that have historically preceded short-term bounces, though oversold readings can persist for extended periods during genuine risk-off episodes [0]. The combination of recovering price action and improving technical readings suggests the technology sector may be finding a short-term bottom, though fundamental drivers behind the sector’s weakness—including AI capital expenditure concerns and valuation compression—remain operative until demonstrated otherwise.
The Russell 2000’s technical position suggests it has maintained its longer-term uptrend, though the index remains vulnerable to continued weakness in risk sentiment. Small-capitalization stocks often lead markets during recoveries and during declines, making the Russell 2000’s technical health an important indicator for broader market direction. The index’s 0.7% gain on February 9 indicates modest investor interest in domestic small-cap equities, though the magnitude of the advance suggests cautious positioning rather than conviction buying.

Bitcoin’s breach of the $65,000 support level produced cascading effects across cryptocurrency-related equities and digital asset markets more broadly [0]. The technical breakdown triggered margin calls and forced liquidations that spilled over into related sectors, including crypto mining companies and blockchain technology providers. The correlation between cryptocurrency weakness and equity market risk appetite has strengthened in recent months, making digital asset technical levels an increasingly relevant indicator for traditional equity traders.
Becton Dickinson reported first quarter fiscal year 2026 earnings that exceeded analyst consensus, generating EPS of $2.91 against the Street estimate of $2.81—a beat of $0.10 per share [1]. Revenue of $5.30 billion surpassed the consensus estimate of $5.15 billion, demonstrating continued demand for the medical technology company’s products across its healthcare and life sciences segments.
Despite the positive surprise on the quarter, the company’s forward guidance proved disappointing to investors. Management issued fiscal year 2026 EPS guidance in the range of $12.35 to $12.65, significantly below Wall Street consensus expectations of $14.81 per share [1]. The conservative outlook reflects ongoing uncertainty about healthcare spending patterns, potential impacts from policy changes, and investment in future growth initiatives that may pressure margins in the near term.
BDX shares closed regular trading at $210.02 on February 9, 2026, down 1.18% during the session, suggesting that investors had anticipated potential guidance concerns [1]. The after-hours reaction extended losses, with the stock declining approximately 1.7% in extended trading as the conservative forward outlook overshadowed the quarterly beat.
Arch Capital Group delivered exceptional fourth quarter 2025 results, with GAAP EPS of $3.35 representing a substantial increase from the $2.42 reported in the prior-year quarter [1]. Net earnings rose to $1.228 billion from $925 million in the prior-year period, reflecting strong underwriting results, favorable reserve development, and robust investment returns. Revenue of $3.649 billion exceeded expectations, demonstrating continued growth across the property and casualty insurer’s diversified insurance and reinsurance operations.
The stock’s regular trading session was volatile, with shares closing at $96.06—down 4.89% from the previous close [1]. However, the after-hours reaction proved dramatically positive, with the stock reversing to trade up 1.49% at $97.49 as investors digested the strong results and recognized the quality of the quarterly performance [1]. The recovery from a 4.89% decline to a 1.49% gain represents a remarkable 6.38 percentage point swing, underscoring the significance of the earnings beat and the market’s reassessment of the company’s outlook.

ON Semiconductor reported fourth quarter 2025 earnings that modestly exceeded analyst expectations, generating EPS of $0.64 against the consensus estimate of $0.62—a beat of $0.02 per share [1]. Revenue of $1.53 billion was essentially in line with estimates, reflecting stable demand across the company’s power management, analog, and sensor product categories despite broader semiconductor industry inventory corrections.
The after-hours reaction was notably negative, with shares declining 5.99% in extended trading [1]. The significant post-earnings drop suggests that investors had elevated expectations heading into the report, potentially related to artificial intelligence applications that could drive incremental demand for the company’s products. The stock closed regular trading at $65.08, and the after-hours decline extended losses from an already weak session for semiconductor equities broadly.
Management’s forward guidance for first quarter 2026 appeared to disappoint investors seeking more optimistic commentary about the company’s positioning within the AI semiconductor supply chain. The semiconductor sector’s sensitivity to capital expenditure trends in artificial intelligence infrastructure has created elevated volatility around earnings reports, with investors closely scrutinizing management commentary about AI-related demand drivers.
Several additional companies experienced significant after-hours movements on February 9, 2026, reflecting the elevated volatility that characterizes extended-hours trading following earnings releases.
Amentum (AMTM) declined 11.81% in after-hours trading after reporting results that missed analyst consensus [1]. The pronounced weakness suggests elevated expectations that were not met by the company’s performance. Medpace (MEDP) declined 5.49% despite beating earnings estimates, indicating that the market may have been looking for more optimistic guidance or was focused on other factors beyond quarterly results [1].
AECOM (ACM) rose 3.77% following an earnings beat, reflecting positive market reaction to the infrastructure consulting company’s results [1]. The stock’s outperformance relative to the broad market demonstrates continued investor appetite for companies with exposure to infrastructure spending themes and federal contracting markets.
The Job Openings and Labor Turnover Survey (JOLTS) data for December 2025, delayed due to the federal government shutdown, is scheduled for release on February 19, 2026 [1]. This delayed report will provide crucial insights into the labor market’s health at year-end 2025, offering investors and Federal Reserve policymakers their first comprehensive view of job openings, hiring rates, and quits following the shutdown-related data disruption.
Recent labor market indicators have suggested gradual softening that could support the case for Federal Reserve rate cuts in 2026 [0]. Job openings have declined from approximately 11 million in 2021 to around 8.8 million, hires have dropped from about 7 million to 5.8 million, and quits have fallen from roughly 4.4 million to 3.5 million, reflecting shifting dynamics in the employment landscape [1]. The JOLTS data will help confirm or challenge the narrative of a gradually cooling labor market that remains sufficiently healthy to avoid recession but weak enough to warrant policy accommodation.
The Consumer Price Index (CPI) report for January 2026 is scheduled for release on February 13, 2026, at 8:30 AM Eastern Time [1]. This inflation data point will be among the most consequential economic releases in recent months, providing the Federal Reserve with updated information to assess progress toward its 2% inflation target. The CPI release assumes heightened importance given the Fed’s data-dependent approach and ongoing debates about the sustainability of the disinflation trend observed throughout 2024 and early 2025.
Inflation expectations have moderated from the elevated readings seen in 2024, though services inflation remains sticky and housing costs continue to contribute to elevated overall readings [0]. The shelter component of CPI has proven particularly persistent, reflecting ongoing disinflation challenges in the rental market. Core goods inflation has moderated substantially, but services ex-housing remains elevated, creating a bifurcated inflation picture that complicates the Fed’s policy assessment. The CPI data will be scrutinized for evidence that disinflation is continuing, remains stalled, or has reversed—each outcome carrying significant implications for Federal Reserve policy trajectory and equity market valuations.
Federal Reserve officials have consistently emphasized that policy decisions will remain data-dependent, with the central bank prepared to adjust rates in either direction as incoming information warrants [0]. Market participants have increasingly priced in the probability of rate cuts in 2026, reflecting expectations that the economy will gradually slow and inflation will continue moving toward target levels.
The combination of JOLTS and CPI data releases over the coming week will provide the most significant information package for Fed policy assessment since the January FOMC meeting. Depending on the outcomes, market expectations for the timing and magnitude of rate cuts could shift materially, with corresponding implications for equity valuations, sector rotation, and asset allocation strategies.
The current market environment presents several interconnected risk factors that merit careful monitoring as investors position for potential developments in coming weeks and months.
Technology sector concentration remains elevated, with a small number of mega-cap companies continuing to exert disproportionate influence on major index performance. The Nasdaq-100’s 20% year-to-date decline reflects concentrated weakness in high-weight technology constituents, creating index-level vulnerability to continued sector-specific challenges [0]. The concentration risk has intensified as the Magnificent 7 stocks have experienced varying degrees of weakness, with AI capital expenditure concerns affecting sentiment across the group even as individual company fundamentals remain mixed. Any further negative developments related to AI returns could trigger additional sector-wide repricing.
AI infrastructure capital expenditure returns represent a fundamental uncertainty that continues to weigh on investor sentiment. The revelation of $500 billion-plus in aggregate AI spending has raised legitimate questions about near-term profitability and the timeline for return on investment [0]. Until demonstrated returns materialize at scale, technology sector valuations may remain subject to compression pressure as investors demand more evidence of capital expenditure efficiency. The uncertainty surrounding AI returns has created bifurcated market performance, with companies perceived as AI beneficiaries trading at premium valuations while those viewed as lagging the AI transformation face discount pressure.
Labor market data suggesting gradual softening creates both opportunities and risks for markets. A moderate deceleration that avoids recession would support the soft-landing narrative and potentially accelerate Federal Reserve easing, benefiting interest-rate-sensitive sectors and growth equities. However, a sharper-than-expected slowdown—potentially indicated by weakness in the upcoming JOLTS data—could signal recession risks that would fundamentally alter market assumptions and likely trigger significant negative repricing across multiple asset classes [0]. The tension between supporting economic growth and maintaining price stability continues to challenge Federal Reserve policy deliberations.

The S&P 500’s breach below the 6,870 support level and subsequent recovery attempt creates technical uncertainty about the index’s near-term direction [0]. A sustained break below the 6,800-6,820 support zone would trigger additional technical selling from trend-following strategies and potentially accelerate downside momentum. The technical damage incurred during the early February weakness may require extended consolidation before the index can mount a credible challenge toward all-time highs.
Momentum indicators remain bearish, with negative readings on both daily and weekly timeframes [0]. The MACD rollover suggests that the recent rebound may face resistance from technically-oriented sellers, potentially limiting upside until momentum indicators can demonstrate sustained positive readings. The NASDAQ-100’s RSI in oversold territory creates potential for short-term bounces, but momentum-based strategies typically require confirmation of trend changes before increasing risk exposure.
Margin-driven liquidations in cryptocurrencies and commodities have demonstrated how automated selling programs can amplify price moves and create cross-asset contagion [0]. Bitcoin’s breach of key support levels triggered selling that extended to related equity sectors, illustrating the interconnectedness of asset classes and the potential for volatility in one market to spread to others.
The elevated Fear & Greed Index reading of 14 suggests that sentiment has reached extremely negative levels that historically have sometimes marked local bottoms [0]. However, sentiment readings are imperfect timing tools, and extremely low readings can persist for extended periods during genuine risk-off episodes.
The February 9, 2026 post-market recap reveals a U.S. equity market exhibiting resilience amid pronounced sector rotation and elevated uncertainty surrounding upcoming economic data releases. All major indices closed higher, with the Nasdaq’s 0.9% lead indicating meaningful technology sector stabilization following an extended period of weakness that saw the index decline 20% year-to-date [0]. The S&P 500’s approach toward all-time highs and successful break above key moving averages suggests constructive technical momentum, though momentum indicators remain negative on multiple timeframes and the index’s recent breach of critical support levels leaves residual technical damage that may require extended consolidation to repair.
The rotation from growth to value and from technology to defensive sectors has reached extreme levels, with consumer staples generating a 13% year-to-date return while the Nasdaq-100 has declined 20% during the same period [0]. Such pronounced sector dispersion typically cannot be sustained indefinitely, though the timing of any reversal remains uncertain given legitimate fundamental concerns driving the current allocation patterns, including AI capital expenditure uncertainty, Federal Reserve policy trajectory, and labor market trajectory. The degree of sector rotation suggests that institutional investors have made meaningful allocation changes that may require an extended period to reverse before capital flows back toward growth sectors.
After-hours earnings reactions proved mixed, with Arch Capital Group’s dramatic reversal from a 4.89% decline to a 1.49% gain standing out as a highlight that underscored the market’s capacity to recognize genuine fundamental strength in the insurance sector [1]. Becton Dickinson’s conservative guidance and ON Semiconductor’s significant decline underscored ongoing volatility in individual stock selection and the challenges investors face in navigating the current environment [1]. The divergence in after-hours reactions highlights the importance of fundamental stock selection and the elevated correlation risks that can manifest during periods of market stress.
The coming week’s economic data releases—the delayed December 2025 JOLTS report and January 2026 CPI inflation data—represent critical catalysts that will likely determine near-term market direction [1]. The Federal Reserve’s data-dependent approach has elevated the importance of incoming information, with policy implications extending to equity valuations, sector rotation, and asset allocation decisions. Labor market indicators suggesting gradual softening could support the case for rate cuts, while any acceleration in weakness could signal recession risks [0].
Risk assessment indicates elevated concerns about technology sector concentration, AI capital expenditure returns, and labor market trajectory. Technical risks remain significant given the S&P 500’s recent support breach and negative momentum readings, though extremely negative sentiment readings and oversold technical conditions in the NASDAQ-100 suggest potential for rebounds if upcoming data proves constructive. The combination of technical uncertainty, sector rotation, and impending economic data creates an environment that demands vigilance and flexibility from market participants.
Market participants should monitor the upcoming economic releases closely for signals that could shift the current market regime. A constructive outcome on both JOLTS and CPI—with labor market resilience and continued disinflation—would support the soft-landing narrative and potentially spark a rotation back toward growth sectors. Conversely, weakness in labor market indicators or reacceleration in inflation could reinforce defensive positioning and extend the technology sector’s weakness. The current environment rewards patient positioning and disciplined risk management over aggressive directional bets.
[0] How major US stock indexes fared Monday, 2/9/2026
[1] Becton Dickinson earnings beat by $0.10, revenue topped estimates
[2] Daily Market Trading Update: February 9, 2026
[3] Daily Market Insight: 9 February 2026
[4] Critical Jobs and Inflation Data to Dictate 2026 Monetary Path
[5] Becton Dickinson Q1 FY2026 Earnings Guidance
[6] Arch Capital Group Ltd Q4 Profit Climbs
[7] ACGL After-Hours Stock Price Movement
[8] ON Semiconductor earnings beat by $0.02, revenue was in line with estimates
[9] After-Hours Earnings Report for February 9, 2026
[10] Week Ahead Economic Preview: Week of 9 February 2026
[11] Schedule of Selected Releases 2026 - Bureau of Labor Statistics
[12] The jobs market is starting to show hard-to-ignore cracks
[13] Coca-Cola (KO) Hits Record $79.03 High - Markets
[14] The AI Reckoning: S&P 500 Momentum Gauges Flash Warning
[15] Stock Exchange Indicators: A Comprehensive Guide for 2026
Insights are generated using AI models and historical data for informational purposes only. They do not constitute investment advice or recommendations. Past performance is not indicative of future results.
About us: Ginlix AI is the AI Investment Copilot powered by real data, bridging advanced AI with professional financial databases to provide verifiable, truth-based answers. Please use the chat box below to ask any financial question.