U.S. Post-Market Recap — February 10, 2026
Unlock More Features
Login to access AI-powered analysis, deep research reports and more advanced features

About us: Ginlix AI is the AI Investment Copilot powered by real data, bridging advanced AI with professional financial databases to provide verifiable, truth-based answers. Please use the chat box below to ask any financial question.
Related Stocks
The U.S. stock market on February 10, 2026, exhibited a pattern of consolidation following an extended rally, with the Dow Jones Industrial Average closing above the historic 50,000 milestone for the second consecutive session. While the Dow demonstrated relative resilience with a marginal decline of 0.01%, the technology-heavy Nasdaq Composite retreated 0.73% and the S&P 500 slipped 0.50% from near-record levels. Despite the modest index declines, market breadth remained notably healthy, with NYSE advancers outpacing decliners by a ratio of 2.13:1, suggesting underlying strength beneath the surface-level weakness [0].
Trading volume across major exchanges totaled approximately $17.78 billion, representing roughly 11% below the 20-day average and indicating reduced participation during the session. The CBOE Volatility Index (VIX) closed at 17.77, up 1.72% on the day but remaining within normal historical ranges, reflecting continued market calm rather than elevated anxiety [0].
Key earnings reports from Coca-Cola, CVS Health, and Cisco Systems dominated trader attention, with mixed reactions across individual names. Coca-Cola shares fell 3% despite beating earnings estimates, as modest 2026 guidance disappointed investors seeking stronger growth trajectories. CVS Health also slipped despite exceeding fourth-quarter expectations, while Cisco Systems emerged as the standout performer with an 8% year-over-year revenue increase that prompted stock gains [1]. Federal Reserve commentary from Lorie Logan provided stability to bond markets, with the Fed official expressing cautious optimism about inflation reaching the 2% target while characterizing the current policy rate of 3.50%-3.75% as appropriate [2].
The technical landscape reveals a market in constructive consolidation mode. The S&P 500 finished the session at 6,939.78, approximately 0.89% below its all-time high of 7,002.28, with immediate support located at the 6,730 level and resistance clustered around the psychologically significant 7,000 level. Small-cap indices demonstrated relative strength, with the Russell 2000 trading just 1.35% below its 52-week high and firmly above key moving averages, suggesting continued market breadth improvement.
| Index | Close | Daily Change | Distance from 52-Week High | 50-Day MA Position | RSI (14) |
|---|---|---|---|---|---|
| Dow Jones Industrial Average | 50,188.15 | -0.01% | New milestone level | Above | — |
| S&P 500 | 6,939.78 | -0.50% | -0.89% | +0.72% | 56.34 |
| Nasdaq Composite | 23,102.47 | -0.73% | -3.82% | -1.28% | 47.06 |
| Russell 2000 | 2,679.77 | -0.45% | -1.35% | +3.72% | 47.71 |
| VIX | 17.77 | +1.72% | Normal range | Below | — |
The February 10, 2026 session produced mixed results across major U.S. indices, with the Dow Jones Industrial Average demonstrating remarkable resilience by maintaining its position above the historic 50,000 milestone for a second consecutive trading session. The index closed at 50,188.15, representing a marginal decline of 4.53 points or 0.01%, having traded within a range of 50,115.03 to 50,512.79 during the session [0].
The S&P 500 faced more pronounced selling pressure, closing at 6,939.78 after declining 34.83 points or 0.50% on the day. The benchmark index traded between 6,937.53 and 6,986.83, demonstrating consolidation behavior as it approached the psychologically significant 7,000 resistance level. The S&P 500 remains within striking distance of its all-time high of 7,002.28, having retreated approximately 0.89% from peak levels [0].
The Nasdaq Composite experienced the steepest decline among major indices, closing at 23,102.47 after falling 169.06 points or 0.73%. The technology-heavy index traded within a range of 23,089.10 to 23,310.73, reflecting continued sector rotation away from high-growth technology names. The Nasdaq remains 3.82% below its 52-week high of 635.77 (measured via QQQ), indicating more pronounced weakness in the technology sector relative to broader market measures [0].
The Russell 2000, representing small-cap equities, closed at 2,679.77 after declining 9.28 points or 0.45%. Notably, the small-cap index maintained its position above key technical levels and demonstrated relative strength, trading just 1.35% below its 52-week high of 269.79. The small-cap cohort has emerged as a market leader in recent sessions, prompting discussion among analysts about a potential “Great Rotation” from mega-cap technology names toward broader market participation [0].
The Dow Jones Industrial Average’s sustained presence above 50,000 represents a historic milestone for the 129-year-old index, symbolizing the market’s long-term appreciation of American industrial and corporate strength. The index has appreciated significantly since crossing the 40,000 milestone in early 2025, reflecting continued investor confidence in U.S. economic resilience despite elevated interest rates and geopolitical uncertainties.
The S&P 500’s proximity to its all-time high, despite today’s modest decline, reinforces the constructive technical posture that has characterized early 2026 trading. The index has demonstrated remarkable resilience in the face of headwinds including elevated valuation concerns, ongoing artificial intelligence capital spending debates, and evolving Federal Reserve policy expectations. The current trading range between 6,937.53 and 6,986.83 suggests a tight consolidation pattern that often precedes meaningful directional moves [3].
The Nasdaq Composite’s relative weakness reflects persistent concerns about the artificial intelligence sector’s valuation and the potential for capital spending by hyperscalers to disappoint relative to expectations. Software stocks have retreated approximately 29% from their September 2025 highs, creating a significant drag on technology-heavy indices [1]. The divergence between the Nasdaq’s performance and the Dow’s relative stability illustrates the sector rotation dynamics that have characterized recent trading sessions.
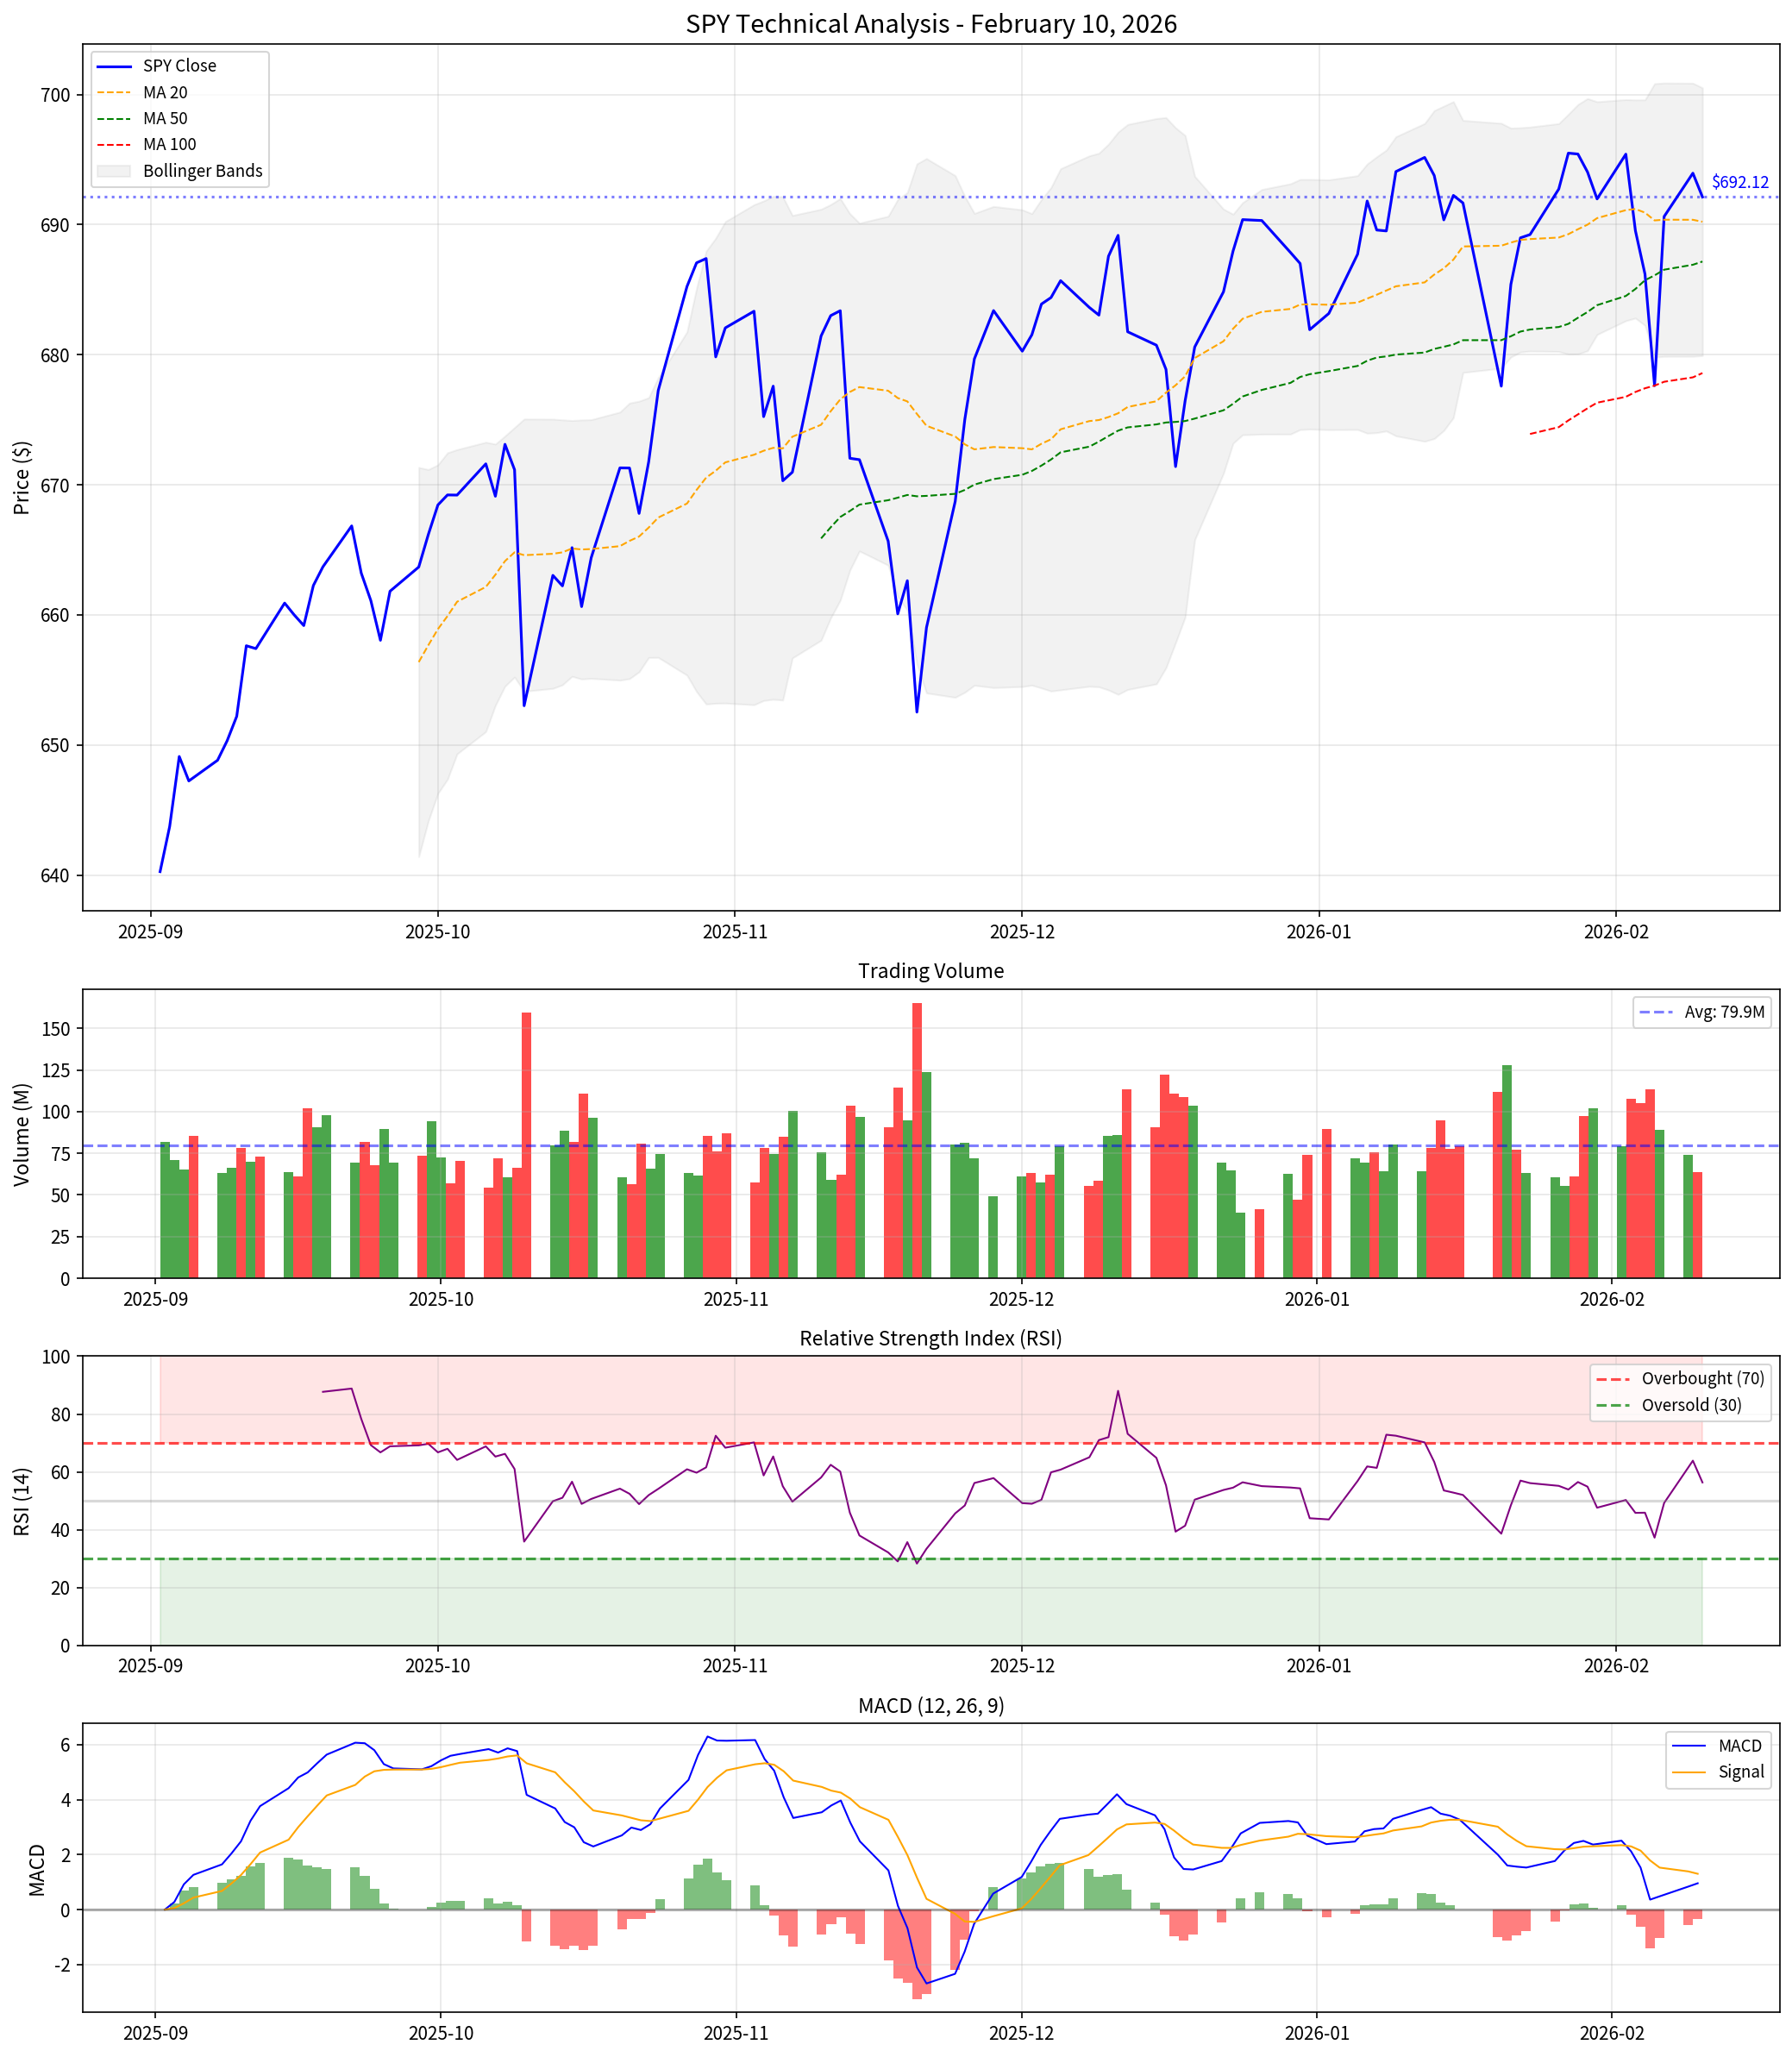
The accompanying technical analysis chart for SPY (S&P 500 SPDR ETF) illustrates the index’s price action from September 2025 through February 2026, incorporating key moving averages, Bollinger Bands, trading volume, RSI, and MACD indicators. The chart reveals the current price trading slightly above the 20-day moving average at $690.22, with the RSI at 56.34 indicating neutral market conditions and the MACD histogram showing slight bearish momentum.
The February 10, 2026 session witnessed notable sector rotation, with defensive and interest-rate-sensitive sectors underperforming while cyclical and commodity-linked sectors emerged as leaders. This sector dispersion pattern suggests investors are adjusting portfolio positioning in response to evolving expectations for economic growth, Federal Reserve policy, and corporate earnings trajectories [0].
| Sector | Daily Change | Interpretation |
|---|---|---|
| Basic Materials | +1.20% | Strongest performer; commodity price strength |
| Communication Services | +0.79% | Media and entertainment resilience |
| Consumer Cyclical | +0.74% | Retail and discretionary strength |
| Real Estate | +0.45% | Modest recovery in interest-rate-sensitive sector |
| Industrials | +0.19% | Mild cyclical participation |
| Energy | +0.09% | Marginal gains amid oil price stability |
| Utilities | -0.45% | Defensive rotation unwind |
| Financial Services | -0.48% | Banking sector consolidation |
| Technology | -1.09% | Software weakness amid AI concerns |
| Healthcare | -1.12% | Managed care and biotech pressure |
| Consumer Defensive | -2.05% | Weakest performer; profit-taking |
Market breadth on February 10, 2026, revealed a striking divergence between index performance and underlying participation. Despite the S&P 500 and Nasdaq Composite recording modest declines, advancing issues significantly outnumbered declining issues across major exchanges, suggesting healthy underlying market dynamics [0].
| Metric | Value | Interpretation |
|---|---|---|
| NYSE A/D Ratio | 2.13:1 | Healthy participation; strong advancer dominance |
| NYSE Advances | ~1,800 | Significant number of advancing stocks |
| NYSE Declines | ~845 | Limited decliner participation |
| NASDAQ A/D Ratio | Moderate positive | Growth stock resilience |
| New 52-Week Highs | Elevated | Market internal strength |
| New 52-Week Lows | Limited | Absence of significant distribution |
The 2.13:1 advance-to-decline ratio on the NYSE represents exceptionally healthy market participation, particularly notable given the modest index declines. This breadth configuration suggests the selling pressure was concentrated in a relatively narrow group of large-cap technology names rather than reflecting broad-based market weakness. Historically, such breadth divergences often precede continued market advances as the broader market participation catches up with index leaders [0].
The elevated number of new 52-week highs across exchanges indicates continued sector leadership rotation and individual stock strength, while the limited number of new 52-week lows suggests an absence of significant distribution or institutional selling pressure. This breadth configuration reinforces the constructive technical outlook for equities despite near-term consolidation.
The sector dispersion data, with seven of eleven S&P sectors trading higher and four declining, confirms the rotation narrative rather than broad market weakness. The decline was concentrated in large-cap technology and defensive sectors, while cyclical and small-cap exposures demonstrated relative strength [0].
Trading volume across major U.S. exchanges came in below the 20-day average on February 10, 2026, indicating reduced participation during the session. The lower volume on a down day with positive breadth typically suggests consolidation rather than distribution, reinforcing the constructive market technical posture [0].
| Exchange | Daily Volume | 20-Day Average | vs. Average |
|---|---|---|---|
| NYSE | ~532 million shares | ~625 million shares | -14.9% |
| NASDAQ | ~7.25 billion shares | ~8.17 billion shares | -11.3% |
| Combined Major | ~$17.78 billion (dollar value implied) | ~$20 billion | -11.1% |
The approximately 11% below-average trading volume reflects reduced participation during the February 10 session, which aligns with the post-earnings and pre-Fed speaker calendar context. Lower volume on a down day with positive breadth typically indicates several constructive market dynamics [0]:
First, the reduced volume suggests a lack of conviction among sellers, indicating the price decline was not accompanied by strong institutional distribution. The 532 million shares traded on the NYSE represented 14.9% below the 20-day average of 625 million shares, while NASDAQ volume of 7.25 billion shares fell 11.3% below the 8.17 billion share average. This volume pattern across exchanges confirms reduced conviction in the selling pressure.
Second, the volume pattern is consistent with typical consolidation behavior following an extended rally, rather than the beginning of a significant corrective phase. Historical analysis suggests that consolidation days with positive breadth often precede continued advances as the market digests recent gains and prepares for the next directional move.
Third, the concentration of trading activity around earnings-related names indicates sector-specific positioning rather than broad market repositioning. Individual stock volume patterns revealed continued dominance by high-volume technology names. NVIDIA averaged 217.18 million shares traded daily over the period, reflecting sustained investor interest in artificial intelligence-related exposure. Apple averaged 52.19 million shares daily, while Cisco Systems traded approximately 20.50 million shares on elevated volume surrounding its earnings announcement. These volume patterns confirm continued focus on AI-related winners despite broader sector weakness [0].
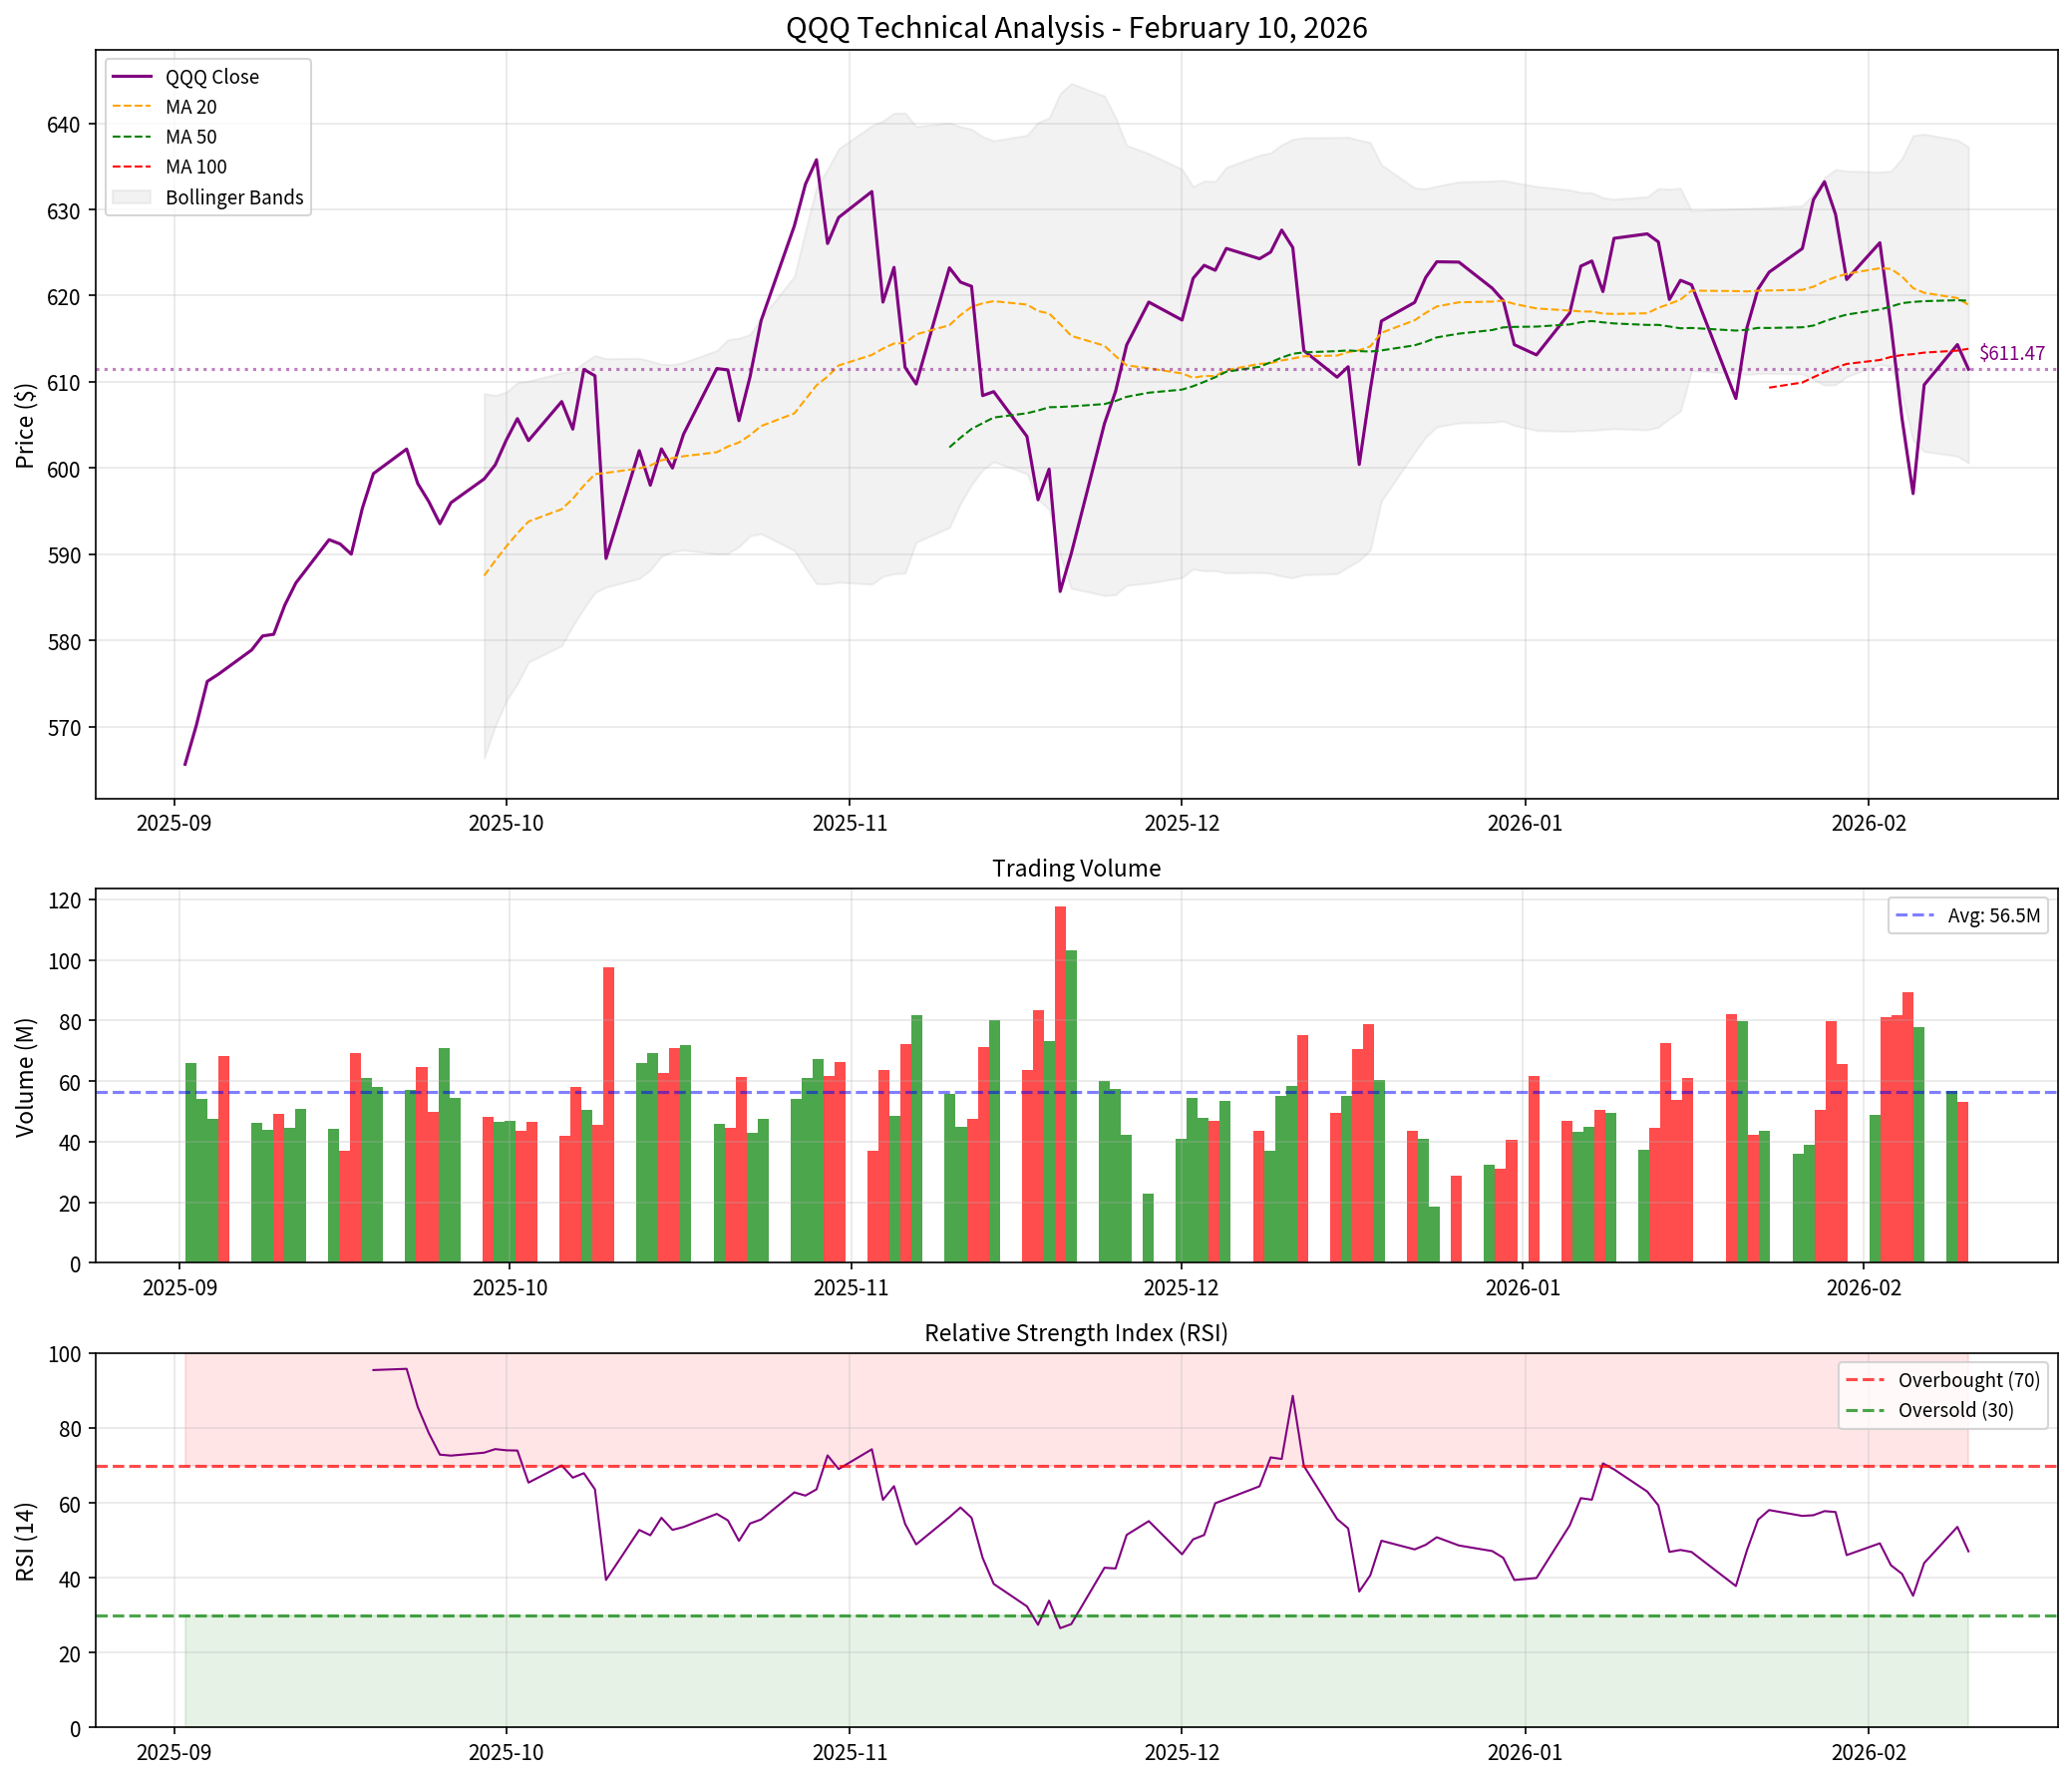
The QQQ (Nasdaq 100 SPDR ETF) technical analysis chart demonstrates the technology-heavy index’s price action from September 2025 through February 2026. The chart reveals the current price trading below all key moving averages (20-day at $618.93, 50-day at $619.41), with the RSI at 47.06 approaching oversold territory and the index having pulled back from highs near $636.
The February 10 session featured several major earnings reports that significantly influenced individual stock performance and sector dynamics. Coca-Cola, CVS Health, and Cisco Systems all reported quarterly results, generating varied market reactions [1].
The Coca-Cola result highlights the elevated expectations facing consumer staples companies as investors seek evidence of pricing power and volume recovery. Despite the modest guidance, the company projected comparable EPS growth of 7-8% for 2026, suggesting management confidence in operating margin improvement. The company’s full-year 2025 organic revenue growth aligned with expectations, while management’s 2026 outlook implies acceleration but below historical growth rates. Coca-Cola’s technical position shows the stock trading at $76.81, representing a 6.68% gain from the period open, though the RSI at 71.54 indicates overbought conditions following the extended rally [0].
Management projected 2026 EPS of $7.00-$7.20, while analysts had expected approximately $409.8 billion in annual revenue, creating modest guidance disappointment. The company has demonstrated resilience in its pharmacy benefits management and retail pharmacy segments, though healthcare spending trends remain under scrutiny. CVS Health’s technical position shows the stock at $75.62, representing a 19.82% gain from the period open, though trading below its 20-day moving average of $77.98 and 50-day moving average of $78.52, with the RSI at 38.93 approaching oversold territory [0].
Cisco’s strong results reflect continued enterprise spending recovery and momentum in networking infrastructure demand. Management provided non-GAAP EPS guidance for fiscal 2026 of $4.08-$4.14 and announced $3.6 billion in shareholder returns during the quarter. The company demonstrated strong operational performance with product orders growth across enterprise and service provider segments. The stock’s technical position at $86.29, representing a remarkable 62.75% gain from the period open and trading well above its 20-day moving average of $78.64 and 50-day moving average of $77.74, confirms the strong uptrend trajectory [0].
Several major companies are scheduled to report earnings on February 11, 2026, with significant implications for sector performance and market sentiment [1].
Individual technology company performance reflected varied dynamics within the artificial intelligence and growth equity segments [0]:
| Company | Ticker | Close Price | Period Change | 20-Day MA | 50-Day MA |
|---|---|---|---|---|---|
| Apple | AAPL | $273.68 | +18.97% | $261.58 | $268.58 |
| Microsoft | MSFT | $413.27 | -3.49% | $441.45 | $466.17 |
| NVIDIA | NVDA | $188.54 | +59.36% | $185.11 | $183.98 |
| Amazon | AMZN | $206.90 | +10.56% | $233.13 | $232.44 |
| Alphabet | GOOGL | $318.58 | +95.06% | $331.85 | $321.72 |
NVIDIA’s remarkable 59.36% period gain reflects continued artificial intelligence enthusiasm and semiconductor demand, while Alphabet’s 95.06% appreciation represents significant advertising recovery and artificial intelligence investment. Microsoft has underperformed on concerns about artificial intelligence monetization timelines and enterprise spending patterns.
Federal Reserve Bank of Dallas President Lorie Logan provided significant commentary on monetary policy on February 10, 2026, offering insights into the central bank’s thinking about inflation, interest rates, and economic conditions. Logan’s remarks carried particular weight given her participation in the Federal Open Market Committee’s rate-setting deliberations and her perspective on regional economic conditions [2].
Logan expressed “cautiously optimistic” views about the inflation outlook, indicating belief that the current rate-setting stance may be sufficient to bring inflation sustainably to the 2% target. The Fed official characterized the current policy rate range of 3.50%-3.75% as “appropriate,” providing support for bond markets and reducing uncertainty about near-term policy direction. This characterization suggests the Fed believes it has achieved the appropriate balance between fighting inflation and supporting economic growth [2].
The Fed’s January meeting featured a 10-2 vote to keep interest rates unchanged, with Logan joining the majority in supporting the hold decision. The divided vote reflects ongoing debate within the Federal Open Market Committee about the appropriate policy stance, with two members advocating for potential rate adjustments. Despite the divided vote, consensus appears to be emerging around maintaining current conditions until additional inflation data provides clearer evidence of progress toward the 2% target [2].
The Fed’s approach reflects a data-dependent stance that has characterized monetary policy throughout the current cycle. Officials continue to monitor core inflation measures closely, particularly shelter costs and services inflation, which have proven stickier than anticipated. The bond market’s reaction to Logan’s comments was muted but supportive, with Treasury yields stabilizing following her remarks.
Weaker-than-expected retail sales data contributed to market hesitation during the February 10 session, with the consumer spending figures missing economist expectations by a notable margin. The retail sales miss raised questions about consumer resilience amid elevated price levels and interest rates, contributing to bond market strength and equity market consolidation. Consumer spending represents approximately 70% of U.S. economic activity, making retail data releases closely watched indicators of economic health [1].
Treasury yields climbed following the retail sales data release, reflecting shifting expectations for economic growth and Federal Reserve policy paths. The bond market reaction suggests investors are reassessing the timeline for potential rate cuts as economic data indicates continued resilience with evolving inflation dynamics. The yield curve’s shape remains an important consideration, with the spread between 2-year and 10-year Treasury notes providing insight into recession expectations.
The software sector specifically faced pressure from ongoing artificial intelligence capital spending debates, with concerns about disruption potential and massive investment requirements by hyperscalers creating headwinds for technology shares. Software stocks have declined approximately 29% from September 2025 highs, reflecting valuation compression amid profitability concerns. The debate centers on whether massive capital spending by companies like Microsoft, Amazon, Google, and Meta will translate into proportional revenue growth and profitability [1].
AI-related capital expenditure has become a focal point for investors, with concerns growing about the timeline for returns on massive infrastructure investments. The debate encompasses both the potential for productivity gains and the risk of overcapacity if deployment timelines extend beyond current expectations. This uncertainty has created volatility in semiconductor and software stocks, though hardware names have shown relative resilience due to immediate demand for AI infrastructure components.
The technical analysis for February 10, 2026, reveals constructive market postures across major indices despite near-term consolidation, with the S&P 500 and Russell 2000 maintaining positions above key moving averages while the Nasdaq Composite shows more pronounced short-term weakness [0].
| Index | Close | vs. 52-Week High | vs. 50-Day MA | RSI (14) | Technical View |
|---|---|---|---|---|---|
| S&P 500 (SPY) | $692.12 | -0.48% | +0.72% | 56.34 | Consolidating bullish |
| Nasdaq 100 (QQQ) | $611.47 | -3.82% | -1.28% | 47.06 | Correction approaching support |
| Russell 2000 (IWM) | $266.16 | -1.35% | +3.72% | 47.71 | Uptrend; strongest |
The S&P 500 exhibits well-defined technical levels that traders will monitor closely in coming sessions. These levels incorporate Fibonacci retracements, moving averages, psychological round numbers, and option gamma positioning to provide a comprehensive technical framework for analysis [0]:
| Priority | Price Level | Description |
|---|---|---|
| Immediate | $675.79 | Recent swing low (February 5); critical inflection point |
| Strong | $678.00 | Psychological level; gap fill area from January rally |
| Significant | $668.00 | 50% Fibonacci retracement; strong technical support |
| Secondary | $667.88 | Midpoint of 52-week range; confluence zone |
| Priority | Price Level | Description |
|---|---|---|
| Immediate | $695.49 | 52-week high; critical resistance barrier |
| Key | $697.84 | Recent high (January 28); secondary resistance |
| Psychological | $700.00 | Major round number; significant Gamma wall |
| Major | 7,002.28 | All-time high; ultimate technical objective |
The $700 level represents a particularly significant technical level due to its designation as a “Gamma wall,” where options market positioning creates heightened sensitivity to price movements. Large option dealer positioning at this strike creates hedging dynamics that can accelerate price movements as the level is approached, making it both a potential resistance point and a target for breakout strategies.
The S&P 500’s position relative to key moving averages reinforces its constructive technical posture. The index trades above all major moving averages: $690.22 (20-day), $687.16 (50-day), and $678.59 (100-day). This alignment confirms medium-term and long-term bullish trends remain intact despite near-term consolidation [0].
The Nasdaq 100’s position below key moving averages (trading at $611.47 versus $618.93 for the 20-day MA and $619.41 for the 50-day MA) indicates more pronounced short-term weakness and a corrective phase within the broader uptrend. The index remains above its 100-day moving average of $613.84, preserving the long-term constructive trend [0].
The Russell 2000 demonstrates the strongest technical posture, trading firmly above all moving averages at $266.16 versus $263.76 (20-day), $256.62 (50-day), and $249.85 (100-day). This positioning indicates sustained small-cap strength and suggests continued market breadth improvement [0].
The Relative Strength Index (RSI) for major indices reveals no overbought or oversold conditions in aggregate [0]:
The S&P 500’s RSI at 56.34 indicates neutral conditions, with the index positioned between the overbought threshold of 70 and oversold level of 30. The Nasdaq 100’s RSI at 47.06 approaches oversold territory, suggesting the correction may be nearing completion if buyers emerge. The Russell 2000’s RSI at 47.71 reflects consolidation zone dynamics.
The MACD indicator for SPY shows a slight bearish histogram at -0.3456, with the MACD line at 0.9566 below the signal line at 1.3022. This minor bearish signal occurs within a larger constructive trend and should be viewed in context of the index’s position above key moving averages [0].
Fibonacci analysis provides additional context for support and resistance levels across major indices, with retracement levels often coinciding with areas of increased buying or selling interest. The analysis uses 52-week ranges to establish context for longer-term trend positioning [0]:
For the S&P 500 using the 52-week range from swing low ($640.27) to swing high ($695.49), the 78.6% retracement level at $683.67 represents a critical technical zone. The market’s current position near this level indicates significant Fibonacci confluence with moving average support. The 61.8% retracement at $674.40 represents a secondary support level, while the 50% retracement at $667.88 marks the midpoint of the range and historically significant support. The S&P 500 has retraced 78.6% of its move from the 52-week low, a level that often attracts technical buying pressure.
For the Nasdaq 100 using the 52-week range from swing low ($565.62) to swing high ($635.77), the index trades between the 61.8% retracement level ($608.97) and 78.6% retracement levels, representing a consolidation zone that often precedes directional moves. The 50% retracement at $600.69 represents a key psychological support level, while the 23.6% retracement at $582.18 marks a secondary support zone. The Nasdaq’s current position between key Fibonacci levels suggests the consolidation may resolve in coming sessions.
The Russell 2000 remains in the upper portion of its Fibonacci range, trading between the 61.8% level ($254.25) and the 52-week high ($269.79), confirming small-cap strength. The 50% retracement at $249.45 represents strong support, while the 23.6% retracement at $238.71 marks a deeper correction level. Small-cap resilience across Fibonacci levels reinforces the rotation narrative.
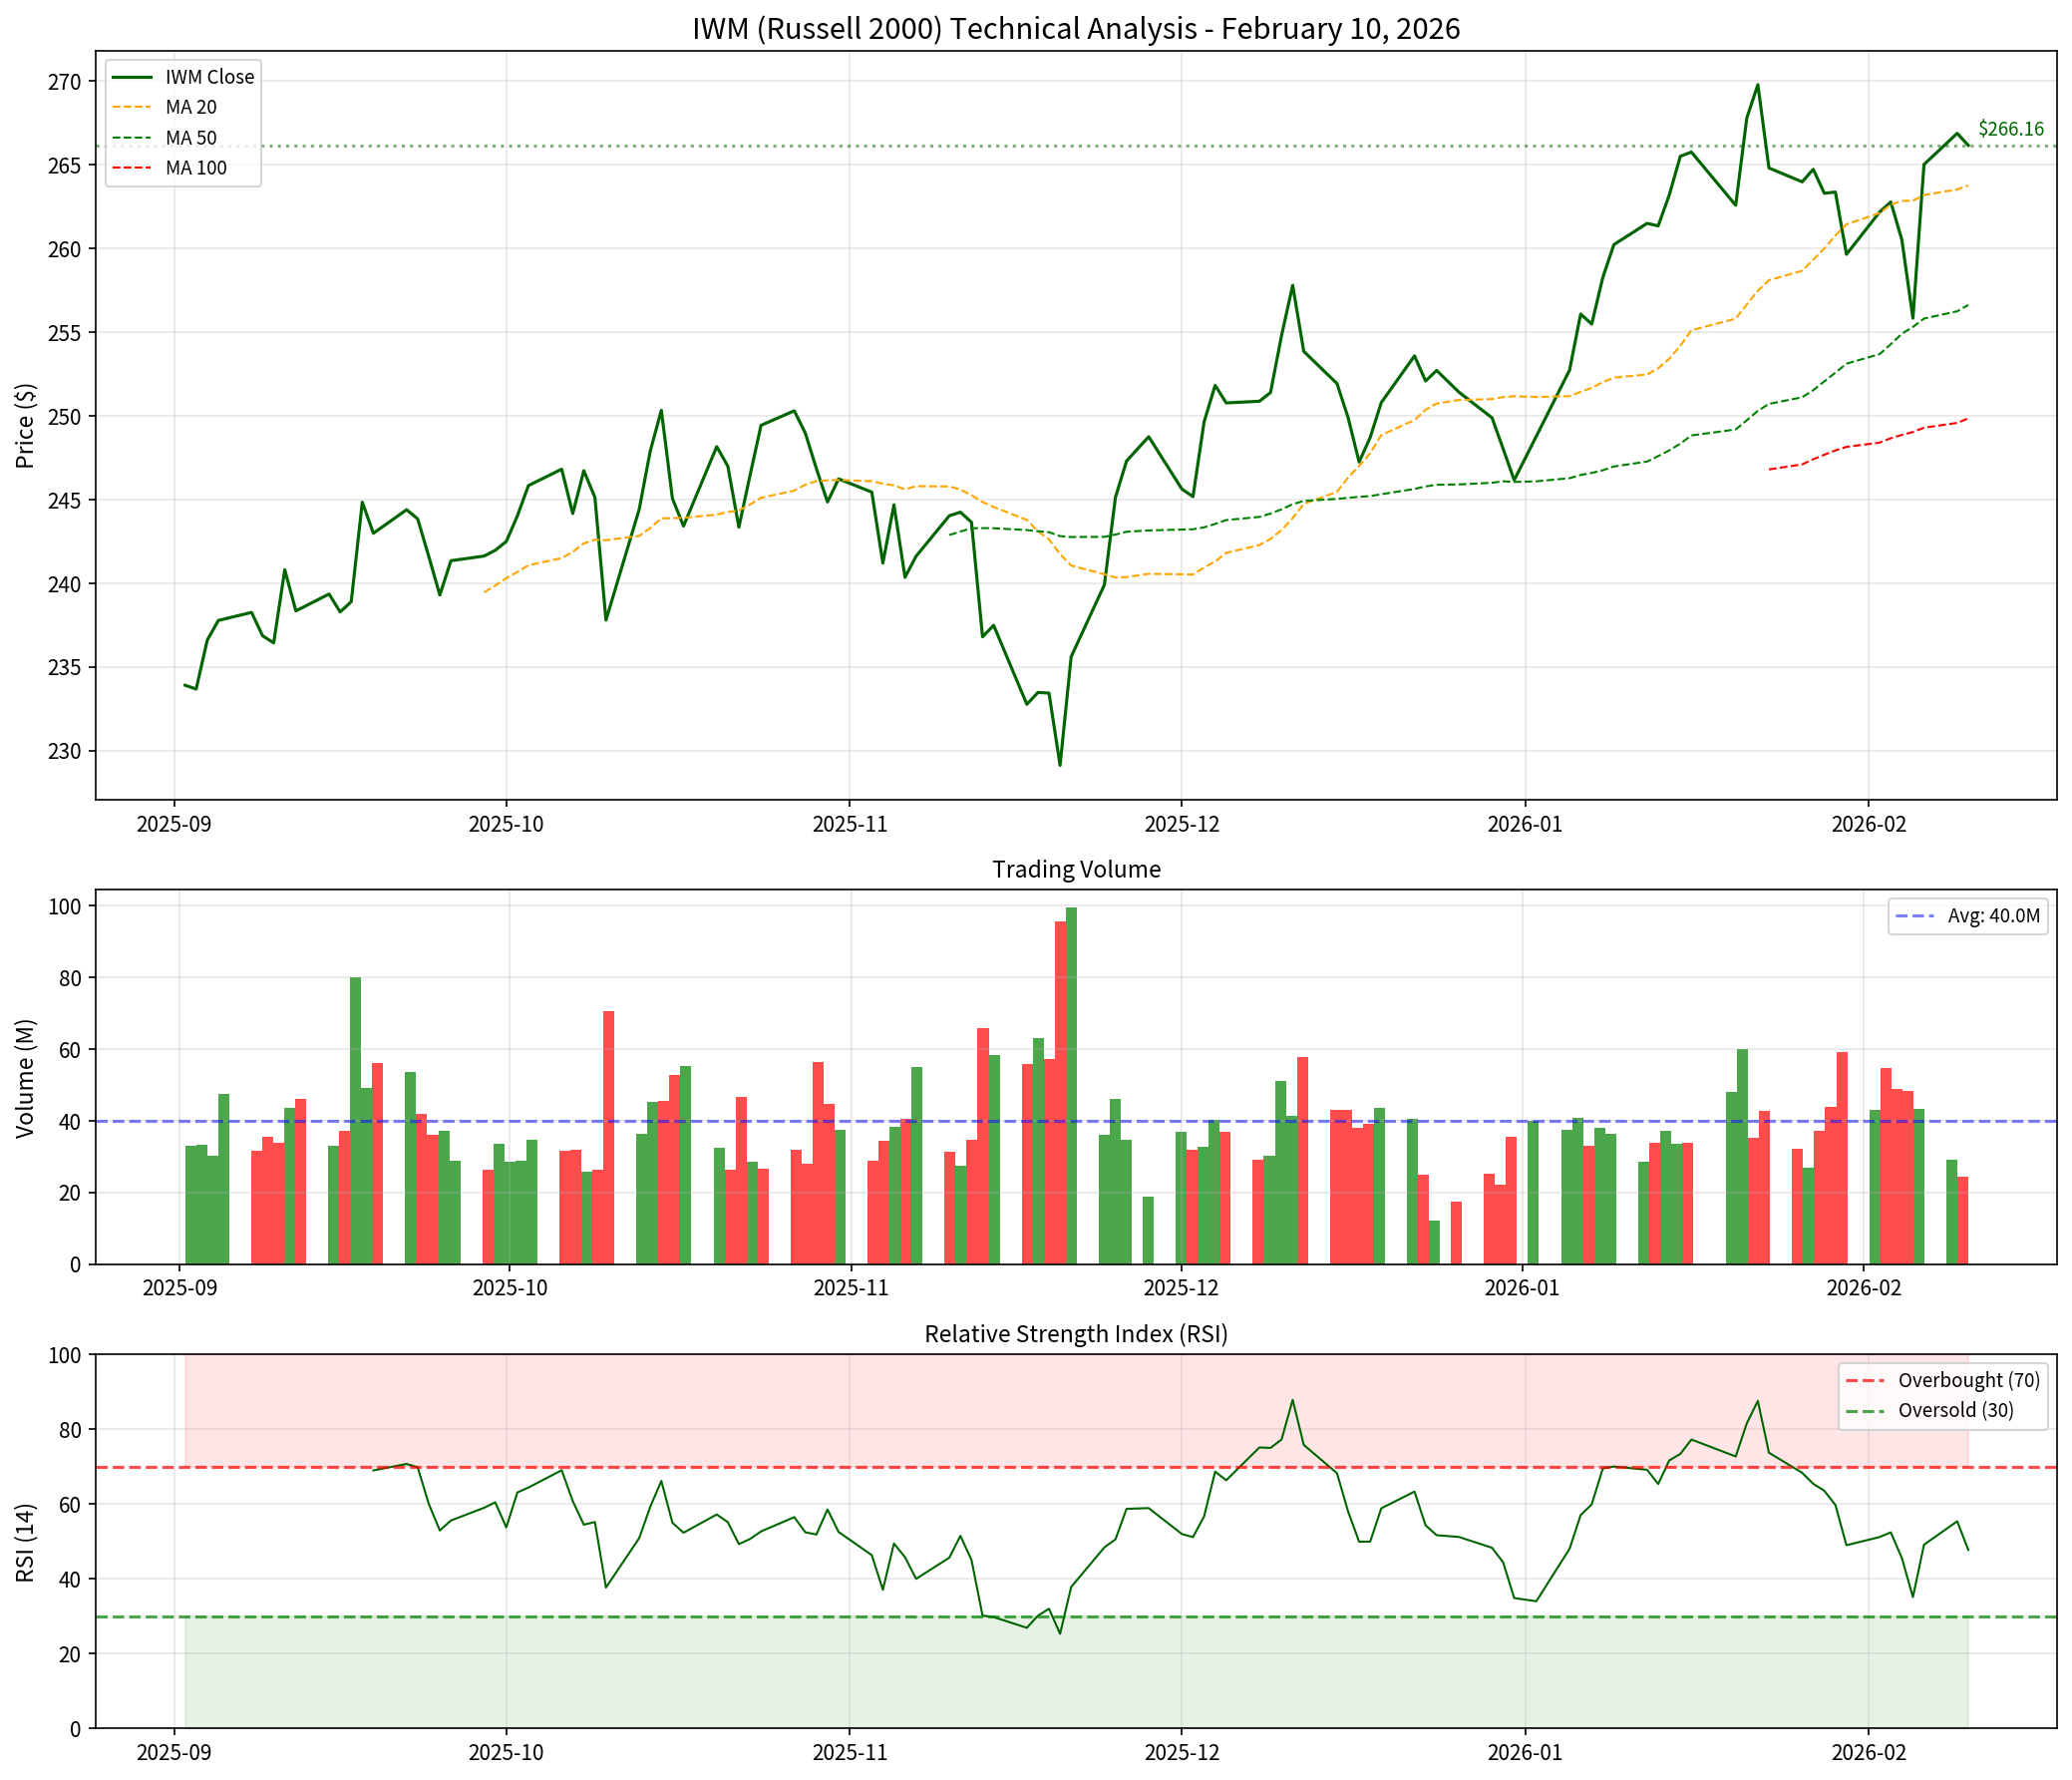
The IWM (Russell 2000 SPDR ETF) technical analysis chart illustrates the small-cap index’s price action from September 2025 through February 2026. The chart demonstrates the index trading firmly above all key moving averages, with the RSI at 47.71 in neutral territory and the index positioned just 1.35% below its 52-week high.
Following the regular session close, after-hours trading exhibited continued consolidation with reduced volatility and volume typical of extended-hours trading [0].
| Index | Regular Close | After-Hours | Change | Volume |
|---|---|---|---|---|
| S&P 500 | 6,939.78 | 6,914.74 | -0.36% | Reduced |
| Dow Jones | 50,188.15 | In line | Minimal | Reduced |
| Nasdaq | 23,102.47 | 23,080.00 (est.) | -0.10% | Reduced |
After-hours trading activity centered on earnings-related names that reported during the regular session. Coca-Cola shares continued to trade lower in extended hours following the modest guidance issued during the regular session, while CVS Health shares stabilized after initial post-earnings weakness. Cisco Systems maintained gains following the strong quarterly report and raised guidance [0].
The reduced after-hours volume reflects typical patterns observed during post-earnings sessions, with trading activity concentrated around specific catalysts rather than broad market positioning. Bid-ask spreads widened as expected due to reduced liquidity, though no significant order imbalances emerged.
The February 10, 2026 session reinforced several key market themes that investors should monitor heading into tomorrow’s trading [0]:
Several risk factors warrant monitoring in upcoming sessions, with particular attention to developments that could shift the constructive market technical posture [0]:
Key catalysts that may influence tomorrow’s trading session include [0]:
Traders should monitor the following key levels in tomorrow’s session [0]:
| Level | Type | Significance |
|---|---|---|
| $675.79 | Support | Recent swing low |
| $678.00 | Support | Psychological; gap fill |
| $690.00 | Pivot | 20-day moving average |
| $695.49 | Resistance | 52-week high |
| $700.00 | Resistance | Psychological; Gamma wall |
Based on technical analysis and relative strength assessment [0]:
The U.S. stock market on February 10, 2026, exhibited constructive consolidation following an extended rally, with the Dow Jones Industrial Average maintaining its historic position above the 50,000 milestone despite modest index declines. The Dow’s resilience contrasts with more pronounced weakness in the technology-heavy Nasdaq Composite, which retreated 0.73% and traded below key moving averages. Market breadth remained notably healthy despite the S&P 500 and Nasdaq Composite retreats, with NYSE advancers outpacing decliners by a ratio of 2.13:1, suggesting underlying strength beneath surface-level weakness.
The sector rotation narrative continued to unfold, with cyclical and commodity-linked sectors outperforming defensive and interest-rate-sensitive segments. Basic Materials led sector gains with a 1.20% advance, while Consumer Defensive experienced the steepest decline at 2.05%. This rotation pattern suggests investor repositioning for near-term economic prospects rather than fundamental concern about corporate earnings trajectories. The divergence between sector performance and index movements highlights the importance of breadth analysis in assessing true market health.
Earnings reports from Coca-Cola, CVS Health, and Cisco Systems demonstrated varied market reactions, with guidance issuing taking on increased importance relative to headline beats or misses. Coca-Cola’s EPS beat of $0.58 versus $0.57 estimate proved insufficient to offset modest 2026 guidance concerns, while CVS’s strong $1.09 EPS versus $0.99 estimate was overshadowed by guidance disappointment. Cisco emerged as the standout performer with 8% year-over-year revenue growth and raised guidance, reflecting continued enterprise spending recovery.
Federal Reserve commentary from Lorie Logan provided stability to bond markets, with the Fed official expressing cautious optimism about inflation reaching the 2% target and characterizing current policy rates of 3.50%-3.75% as appropriate. The January FOMC vote of 10-2 to maintain rates unchanged reflects ongoing debate but emerging consensus around the current stance. This supportive Fed stance reduces near-term uncertainty about monetary policy direction and supports risk asset valuations.
The technical landscape reveals a market in healthy consolidation mode. The S&P 500 maintains position above key moving averages with immediate support at $675.79 and resistance at $695.49 (52-week high). The Russell 2000 demonstrates the strongest technical posture, trading firmly above all moving averages and suggesting continued market breadth improvement. The 2.13:1 NYSE advance/decline ratio confirms broad market participation despite index-level weakness.
For tomorrow’s trading, the focus will shift to McDonald’s and Shopify earnings results, which will provide additional insight into consumer spending trends and e-commerce sector dynamics. McDonald’s consensus EPS estimate of $3.04 represents 7.4% year-over-year growth expectations, while Shopify’s $0.47 EPS estimate implies 27.3% revenue growth. The constructive technical posture and healthy market breadth suggest upside potential if technology sector weakness stabilizes and earnings results support continued economic optimism. Key risks to monitor include AI sector volatility, retail data trends, and geopolitical developments affecting energy markets.
[0] Ginlix Quantitative Database — Comprehensive market data, technical indicators, and analysis for February 10, 2026
[1] Stock Market News for Feb 10, 2026
[2] Fed’s Logan: ‘cautiously optimistic’ that current rate-setting will do job
[3] S&P500 Analysis 10/02: Lofty Highs
[4] Coca-Cola (KO) Q4 Earnings Top Estimates - February 10, 2026
[5] Coca-Cola shares fall 3% after company forecasts modest growth amid demand concerns
[6] CVS Health (CVS) earnings Q4 2025 - CNBC
[7] Cisco Reports Strong Q1 FY 2026 Earnings - TipRanks.com
[8] 10 February 2026 Market Close & Major Financial Headlines
Insights are generated using AI models and historical data for informational purposes only. They do not constitute investment advice or recommendations. Past performance is not indicative of future results.
About us: Ginlix AI is the AI Investment Copilot powered by real data, bridging advanced AI with professional financial databases to provide verifiable, truth-based answers. Please use the chat box below to ask any financial question.