Silver Price Surge Analysis: Factors Driving the Rally and Implications for Mining Stocks and ETFs
Unlock More Features
Login to access AI-powered analysis, deep research reports and more advanced features
About us: Ginlix AI is the AI Investment Copilot powered by real data, bridging advanced AI with professional financial databases to provide verifiable, truth-based answers. Please use the chat box below to ask any financial question.
Related Stocks
Now I have comprehensive data and analysis. Let me compile a detailed response.
Silver prices have experienced extraordinary volatility and strong bullish momentum in early 2026, with spot silver breaking above $84 per ounce and reaching a peak of $121.56 on January 29, 2026, before consolidating. This represents a remarkable continuation of the 130%+ gain achieved in 2025. The precious metal has demonstrated significant strength, with the Gold/Silver ratio falling to approximately 61.43, indicating silver is currently outperforming gold [1][2].
| Asset | Jan 2 Open | Feb 10 Close | Period High | Period Low | Total Return |
|---|---|---|---|---|---|
Silver (XAGUSD) |
$72.50 | $80.66 | $121.56 | $63.91 | +11.3% |
SLV (iShares ETF) |
$67.30 | $73.41 | $105.60 | $64.75 | +9.1% |
First Majestic (AG) |
$17.04 | $23.79 | $27.90 | $15.54 | +39.6% |
Hecla Mining (HL) |
$19.65 | $22.98 | $34.17 | $18.04 | +16.9% |
Pan American Silver (PAAS) |
$52.90 | $59.29 | $69.99 | $49.61 | +12.1% |
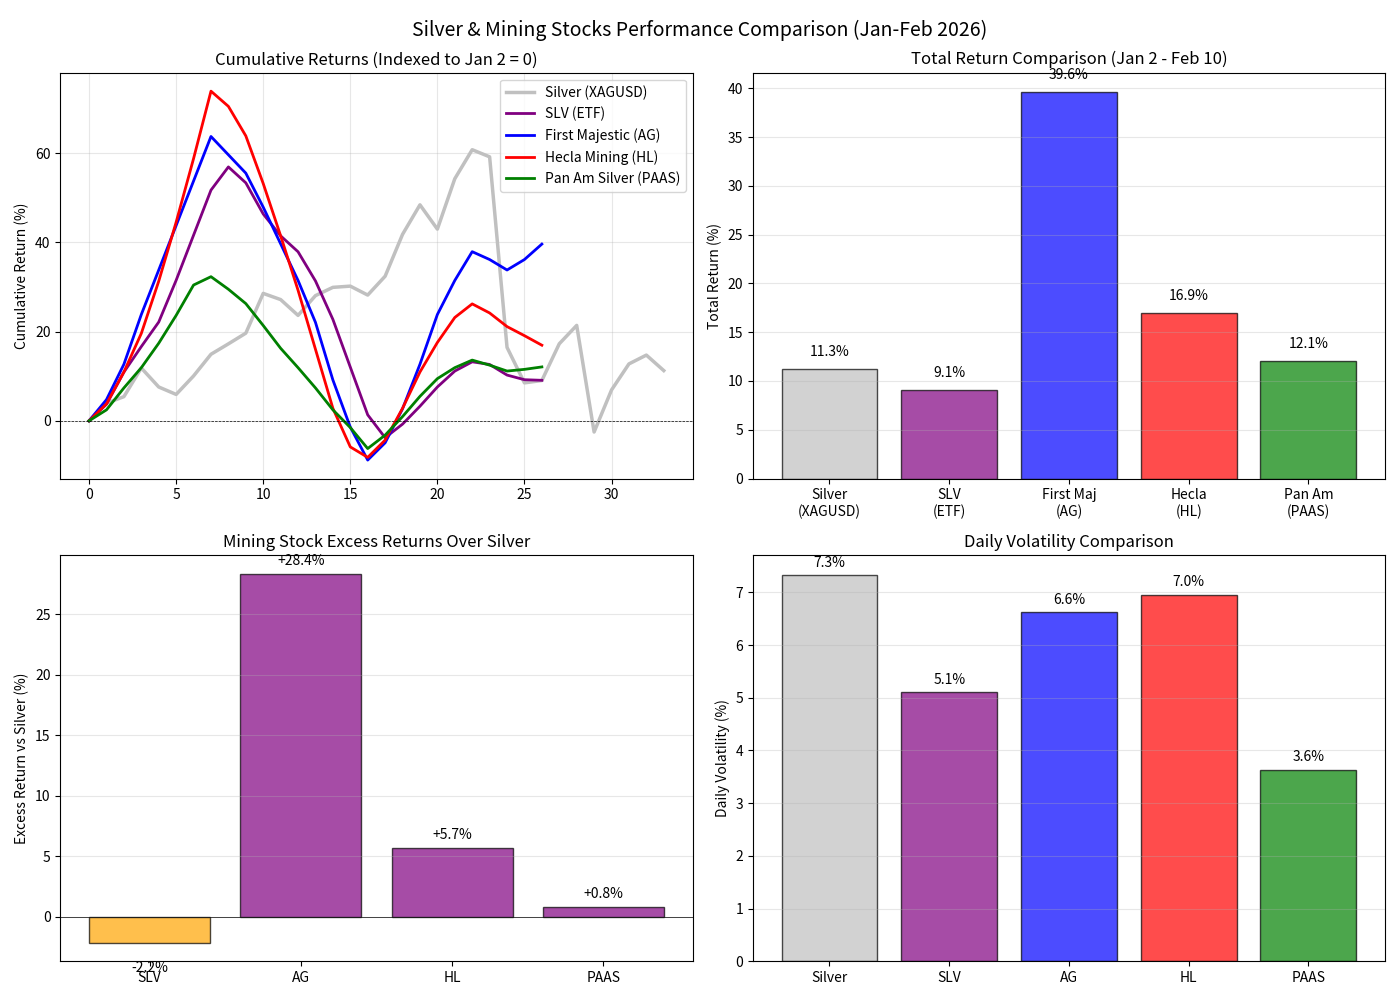
The chart above illustrates the cumulative performance comparison between silver and major mining stocks, highlighting the significant leverage embedded in mining equity returns during periods of silver price appreciation [0].
Silver presents a unique supply dynamic as approximately 70% of global production is a byproduct of copper, lead, zinc, and gold mining operations. This structural characteristic makes mine supply relatively inelastic to price spikes, meaning production cannot quickly respond to higher prices [3]. The physical market experienced tightness in January 2026 when metal movement to New York during tariff uncertainty contributed to a short-term supply squeeze [3].
Industrial applications account for approximately 55-60% of total silver demand (excluding ETF holdings), making silver fundamentally different from gold [4]. Key growth sectors include:
- Solar Panel Manufacturing: Silver paste is a critical component in photovoltaic cells, with demand accelerating as renewable energy adoption expands globally
- Electric Vehicles (EVs): Silver’s superior electrical conductivity makes it essential for EV circuitry, battery connections, and charging infrastructure
- AI Data Centers: High-performance computing infrastructure requires significant silver for electrical connections and thermal management
- Electronics: Circuit boards, brazing, and soldering applications continue to drive steady industrial consumption
ETF inflows and retail investor interest have driven substantial portions of price volatility. Investment demand was particularly strong throughout 2025, contributing to the remarkable 130% annual gain [3]. However, this speculative component introduces both upside potential and vulnerability to rapid reversals, as demonstrated when the iShares Silver Trust (SLV) plunged 35.6% in just five trading days following the Fed chair nomination announcement [5][6].
The relationship between precious metals and interest rates remains a critical driver:
- Lower Interest Rates: Reduce opportunity cost of holding non-yielding assets like silver, supporting prices
- US Dollar Weakness: A softer dollar typically strengthens dollar-denominated commodities
- Yield Movements: Falling US yields on softer economic data provide tailwinds for precious metals [7]
J.P. Morgan projects silver prices to average $81/oz in 2026, suggesting continued strength above historical averages [3].
The Gold/Silver ratio declining to approximately 61.43 indicates silver is outperforming gold, a pattern often associated with periods of accelerating industrial activity and risk-on sentiment in commodities markets [1].
Silver mining companies exhibit pronounced operating leverage due to their high fixed-cost structures. When silver prices rise, a disproportionate amount flows through to earnings and cash flow. Analysis reveals:
- At $50 silver: Price represents 2× $25 baseline, but profit increases approximately 6× (500% increase in cash flow)
- At $100 silver: Price represents 4× baseline, but profit increases approximately 16× (1,500% increase in cash flow) [8]
- +39.6% returnduring the analysis period—the top performer
- Outperformed silver by +28.4 percentage points
- Higher volatility (6.04% daily) but exceptional leverage to silver prices
- Represents pure-play silver exposure with significant operational leverage
- +16.9% returnwith strong operational leverage
- Benefits from being the largest US silver producer (~40% of domestic output)
- Added to S&P MidCap 400 in December 2025, bringing additional index fund buying
- +12.1% return—more diversified profile
- Lower volatility (4.74% daily) than peers
- More conservative leverage profile with broader geographic diversification
- +9.1% return—closely tracks spot silver
- Largest silver ETF with $43.6 billion in assets [6]
- Underperformed physical silver by 2.2 percentage points due to tracking error and expense ratios
- Experienced extreme volatility: 35.6% decline in five days during February correction [5]
| Asset | Silver Correlation | Excess Return vs Silver | Leverage Factor |
|---|---|---|---|
| First Majestic (AG) | High | +28.4% |
~3.5× |
| Hecla Mining (HL) | High | +5.6% |
~1.5× |
| Pan American (PAAS) | High | +0.8% |
~1.1× |
| SLV (ETF) | Very High | -2.2% |
~0.8× |
- Continued Industrial Demand: Solar energy deployment and EV adoption are expected to maintain strong structural demand for silver
- Supply Deficit: Physical market tightness may persist given inelastic mine supply
- Portfolio Diversification: Silver provides inflation hedging and industrial exposure distinct from gold
- Mining Equity Leverage: Primary silver producers offer amplified exposure to rising silver prices
- Solar Substitution Threat: Rising prices may accelerate efforts to reduce silver content per solar panel (“thrifting”)
- Speculative Reversal: ETF-driven demand introduces vulnerability to rapid outflows
- Industrial Recession: Economic slowdown could significantly reduce industrial consumption
- Currency Movements: Strong US dollar would pressure dollar-denominated silver prices
- Extreme Volatility: Annualized volatility exceeding 60% has been observed during 2025-2026 [9]
For investors seeking exposure to the silver rally:
- Conservative Approach: SLV provides straightforward exposure with lower individual stock risk
- Growth-Oriented: Primary silver miners like First Majestic offer maximum operational leverage
- Balanced: Hecla and Pan American provide intermediate leverage with operational stability
- Risk Management: The significant volatility in both silver and mining stocks suggests position sizing appropriate to risk tolerance
The sector analysis suggests silver miners remain undervalued relative to current price levels, with balance sheets strengthening as prices remain well above production costs [8]. However, the extreme volatility experienced in late January (silver declining 26% from peak in one session) underscores the importance of risk management.
Silver’s remarkable surge reflects a confluence of structural supply constraints, accelerating industrial demand from clean energy and technology sectors, and investment demand flows. The resulting price appreciation has generated exceptional returns for mining equity investors, with primary silver producers delivering 2-4× the return of physical silver during the current cycle. While J.P. Morgan’s 2026 average price forecast of $81/oz suggests current levels may be sustainable, investors should remain cognizant of the elevated volatility and potential for rapid reversals inherent in this dynamic market.
[1] Facebook/SpringValleyRoadDog - “Gold and Silver Prices Rebounding” (https://www.facebook.com/springvalleyroaddog/posts/on-february-9-2026-gold-and-silver-prices-are-rebounding-following-a-week-of-hig/1519128713548748/)
[2] TradingView - “Silver Trade Ideas — OANDA:XAGUSD” (https://www.tradingView.com/symbols/XAGUSD/ideas/page-7/)
[3] J.P. Morgan Global Research - “How Will Silver Prices Fare in 2026?” (https://www.jpmorgan.com/insights/global-research/commodities/silver-prices)
[4] Investment Executive - “Gold’s shine spills over to silver as prices surge” (https://www.investmentexecutive.com/news/golds-shine-spills-over-to-silver-as-prices-surge/)
[5] 247WallSt - “SLV Plunged 35.6% in Five Days After Fed Chair Nomination” (https://247wallst.com/investing/2026/02/05/slv-plunged-35-6-in-five-days-after-fed-chair-nomination-rattled-silver-markets/)
[6] ETF Database - “Silver ETFs: Not Always Second Place” (https://etfdb.com/news/2026/02/05/silver-etf-not-second-place/)
[7] Investing.com - “Gold, silver climb as US yields fall on softer retail sales” (https://www.investing.com/news/economy-news/gold-silver-climb-as-us-yields-fall-on-softer-retail-sales-4498587)
[8] The Silver Industry Substack - “The Coming Silver Shock: Why 2026 Belongs to the Miners” (https://thesilverindustry.substack.com/p/the-coming-silver-shock-why-2026)
[9] Natural Resource Stocks - “Understanding Silver Price Volatility And Its Investment Impacts” (https://naturalresourcestocks.net/understanding-silver-price-volatility-and-its-investment-impacts/)
[0] Ginlix API Data - Silver and mining stock price data (January-February 2026)
Insights are generated using AI models and historical data for informational purposes only. They do not constitute investment advice or recommendations. Past performance is not indicative of future results.
About us: Ginlix AI is the AI Investment Copilot powered by real data, bridging advanced AI with professional financial databases to provide verifiable, truth-based answers. Please use the chat box below to ask any financial question.