Freddie Mac (FMCC) Q4 & Full-Year 2025 Financial Report: Key Investment Factors
Unlock More Features
Login to access AI-powered analysis, deep research reports and more advanced features

About us: Ginlix AI is the AI Investment Copilot powered by real data, bridging advanced AI with professional financial databases to provide verifiable, truth-based answers. Please use the chat box below to ask any financial question.
Related Stocks
Based on my comprehensive analysis of Freddie Mac (FMCC) and the current U.S. housing market environment, I will outline the key factors investors should focus on in the upcoming Q4 and full-year 2025 financial report.
Freddie Mac is scheduled to release its Fourth Quarter and Full-Year 2025 financial results before market open on
Freddie Mac has experienced remarkable stock price appreciation over the past three years (+1,404%), though the stock has corrected significantly in 2026, down 28.8% year-to-date [0]. The company operates as a Government-Sponsored Enterprise (GSE) with a unique structure that significantly impacts its valuation dynamics. The Q4 2025 earnings will be closely watched for indicators of:
- Continued profitability trends following the strong Q3 FY2025 performance
- Management’s outlook for mortgage originations in 2026
- Developments regarding potential exit from conservatorship
- Credit quality trends amid a normalizing housing market
Freddie Mac’s net interest income has demonstrated consistent growth, reaching $5.46 billion in Q3 FY2025, up from $4.999 billion in Q3 FY2024—a 9.1% year-over-year increase [2]. The spread between interest income ($32.98 billion) and interest expense ($27.52 billion) remains healthy at approximately $5.46 billion quarterly.
- Did net interest margin expand or contract in Q4?
- How did the declining mortgage rate environment (30-year fixed averaging 6.11% as of February 2026) [3] impact net interest income?
- What is the trajectory of interest-earning assets growth?
The Single-Family Guarantee Segment represents
- Monitor credit guarantee fee (g-fee) trends
- Assess the impact of competitive pressures on pricing
- Evaluate multifamily segment performance (13.2% of revenue)
Q3 FY2025 saw a
- Non-performing loan ratios
- Loss given default (LGD) assumptions
- Home price appreciation (HPA) impacts on loan-to-value (LTV) ratios
- Delinquency rates by vintage year
Freddie Mac’s ROE stands at
- The Treasury’s senior preferred stock carries a liquidation preference of $137.459 billion [2]
- Retained earnings remain significantly negative at $(15.316) billion [2]
- Common stockholders have historically received minimal value due to preferred stock claims
Non-interest expense totaled $2.116 billion in Q3 FY2025, relatively stable compared to $2.183 billion in Q3 FY2024 [2]. Key expense categories include:
- Salaries and benefits: $423 million
- Legislative and regulatory assessments: $839 million
- Credit enhancement expense: $489 million
As of September 30, 2025 [2]:
- Total Assets:$3.468 trillion
- Total Liabilities:$3.401 trillion
- Total Equity:$67.6 billion
- Current Ratio:1.55x [0]
| Metric | Value | Assessment |
|---|---|---|
| P/E Ratio | 2.13x | Extremely low - potential undervaluation |
| P/B Ratio | 0.35x | Trading below book value significantly |
| Quick Ratio | 1.55x | Strong liquidity position |
| Debt/Equity | 50:1 | Appropriate for GSE operations |
Freddie Mac’s conservative capital approach following the 2008 crisis has resulted in a
-
Declining Mortgage Rates:The 30-year fixed-rate mortgage averaged 6.11% as of early February 2026, down from approximately 6.85% at the beginning of 2025 [3]. This creates favorable conditions for:
- Refinance activity (forecast to rise 31.7% to $827 billion in 2026) [4]
- Improved purchase affordability
- Reduced prepayment speeds (benefiting MSR valuations)
-
Housing Market Recovery:Zillow forecasts 1.9% home value appreciation in 2026, with gradual improvement in existing home sales [5].
-
Policy Support:The current administration has directed Fannie Mae and Freddie Mac to initiate a $200 billion purchase program of mortgage-backed securities, providing direct liquidity to the housing market [6].
-
Prepayment Risk:As mortgage rates decline, refinancing activity increases, potentially accelerating prepayments and reducing the value of existing mortgage servicing rights (MSR).
-
Affordability Challenges:Despite improving rates, home prices remain elevated, limiting purchase volume recovery.
-
Multifamily Sector Stress:With elevated vacancies and ongoing completions in the multifamily sector, this 13.2% of revenue segment faces headwinds.
Freddie Mac has been in FHFA conservatorship since September 2008. Any developments regarding exit from conservatorship represent a
- FHFA Director commentary on reform timeline
- Treasury Department statements on preferred stock treatment
- Capital recapitalization plans
- Regulatory framework updates
The company’s capital structure is heavily influenced by Treasury preferred stock with a $137.459 billion liquidation preference [2]. The treatment of this preferred stock in any reform scenario will significantly impact common stock valuation.
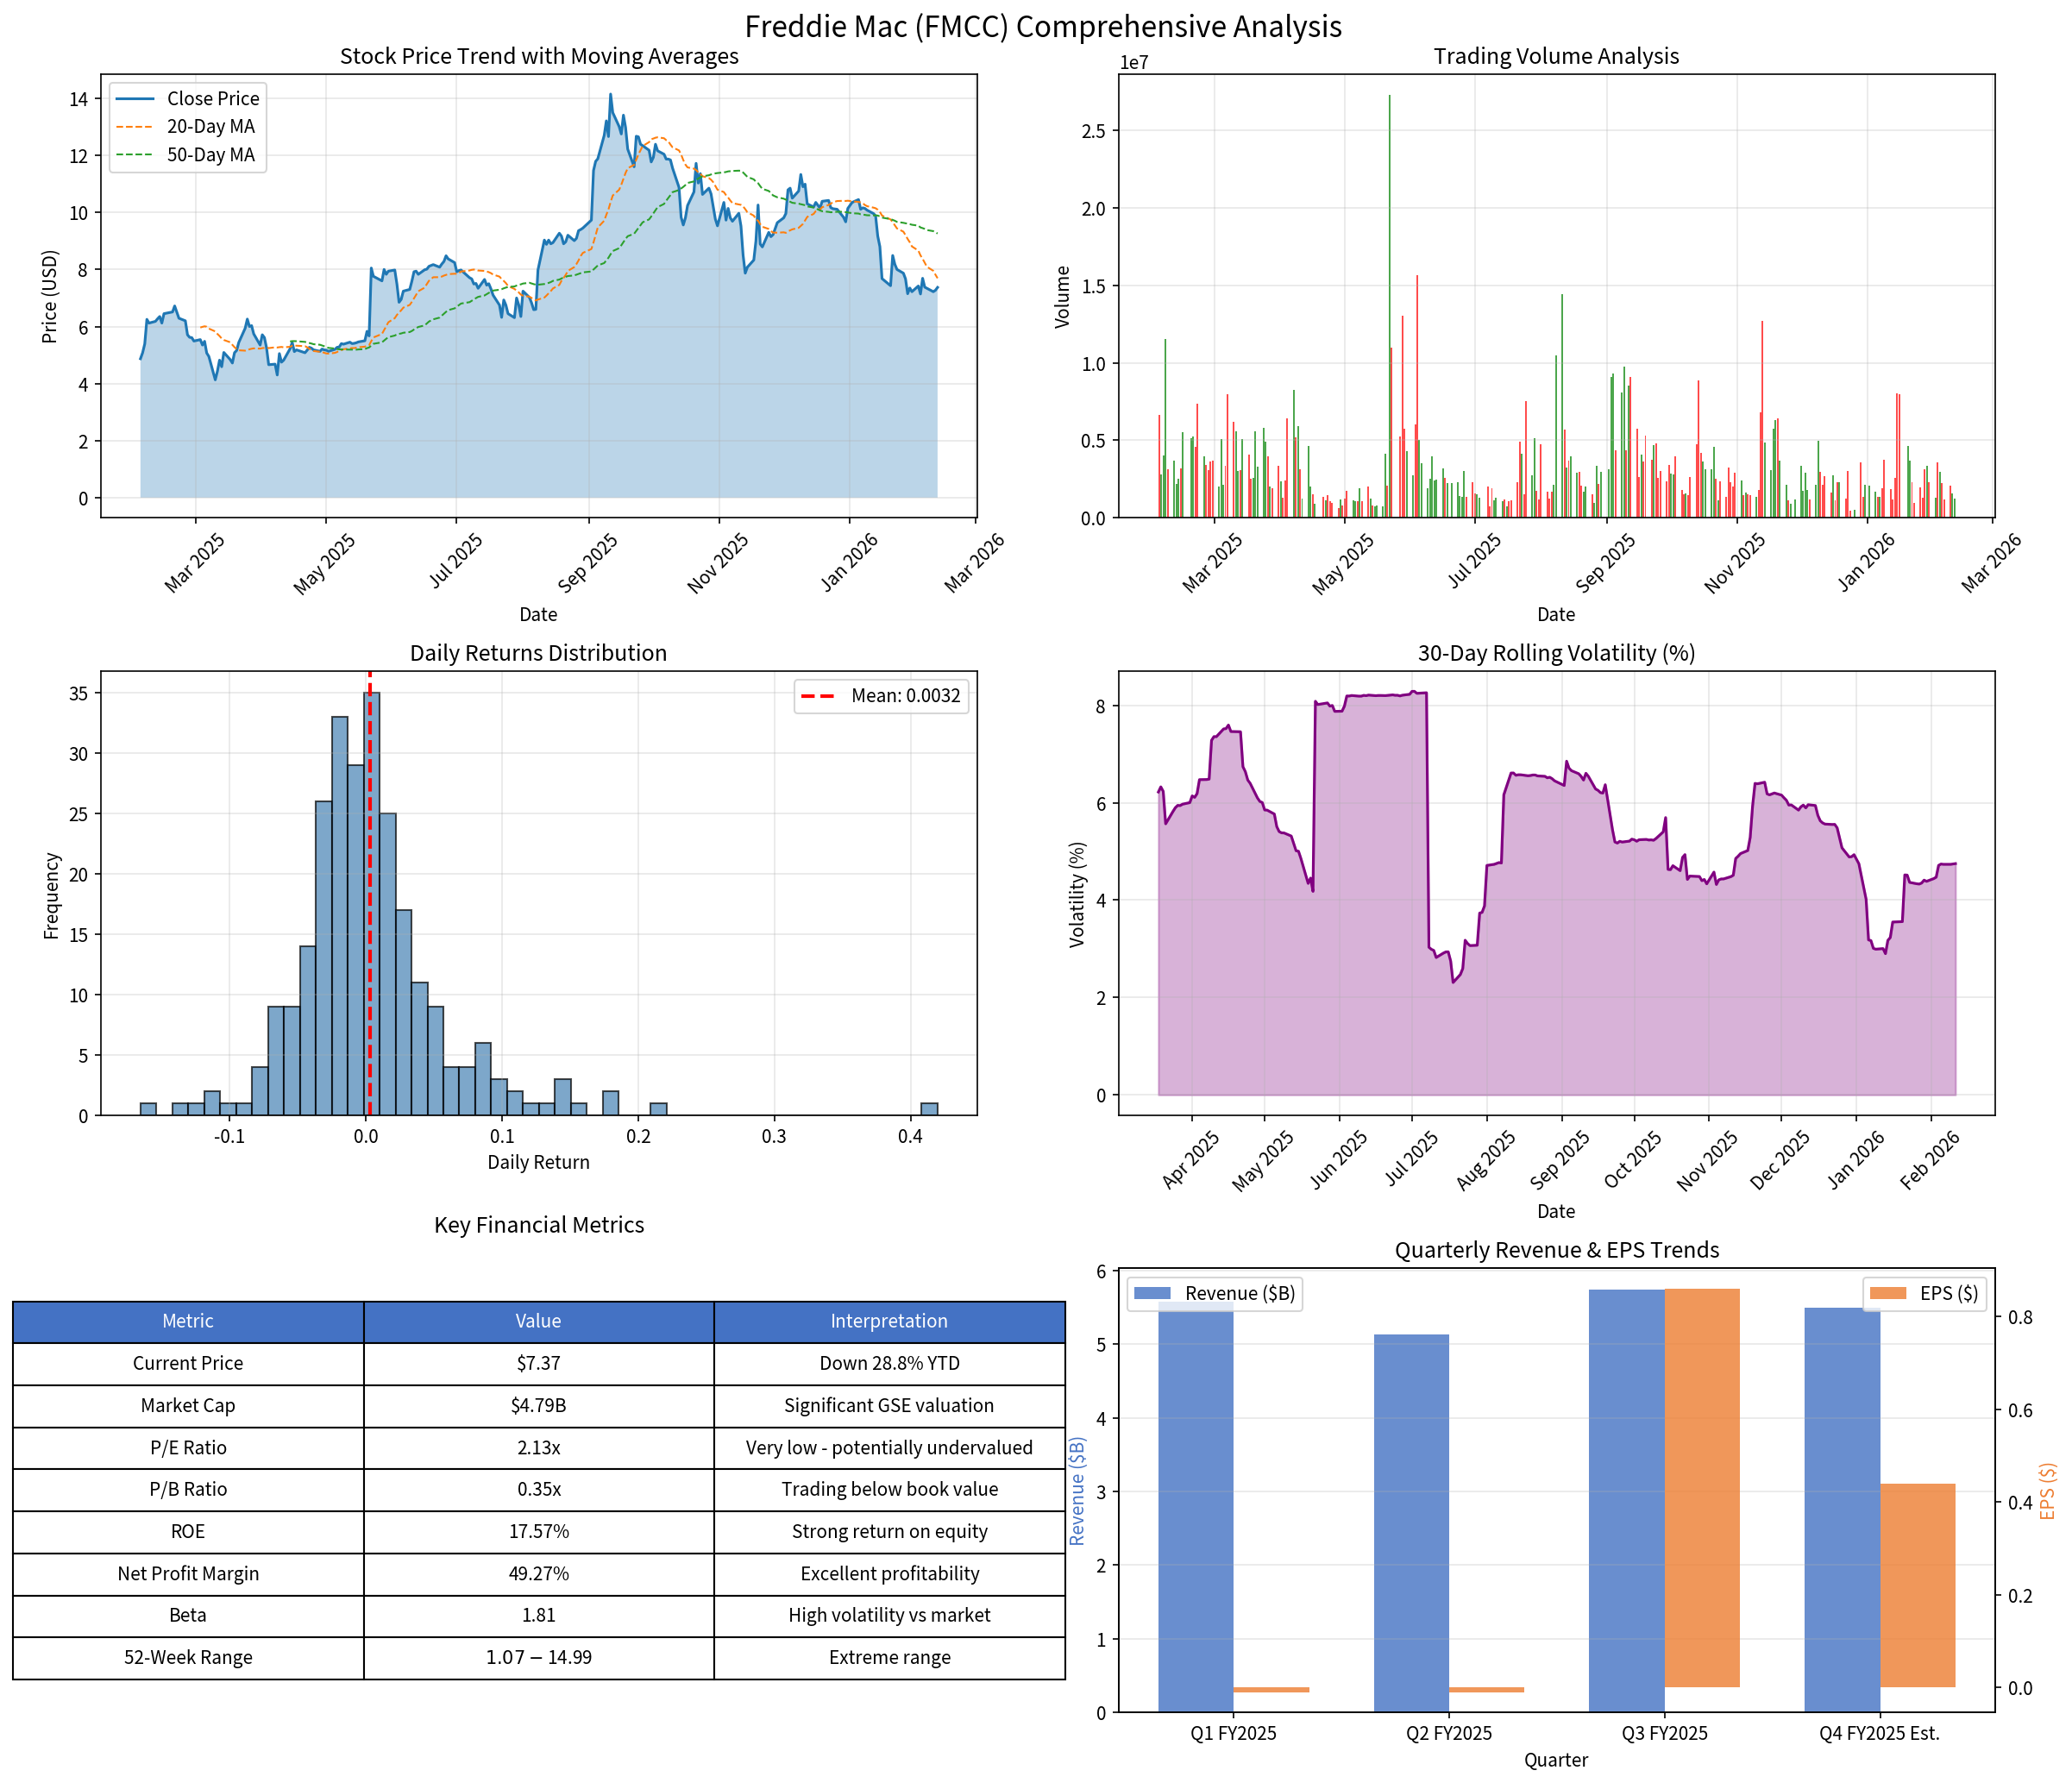
Freddie Mac’s stock has demonstrated extreme volatility:
- 52-Week Range:$1.07 - $14.99 [0]
- Beta:1.81 (highly sensitive to market movements) [0]
- 30-Day Volatility:4.75% [calculated]
| Indicator | Value | Signal |
|---|---|---|
| Current Price | $7.37 | Below 20-day ($7.69) and 50-day ($9.26) MAs |
| RSI (14) | Normal Range | No overbought/oversold signal |
| MACD | No Cross | Slightly bullish bias |
| KDJ | K:22.2, D:23.2 | Bearish momentum |
| Trend | Sideways | Trading range: $7.09-$7.69 |
| Rating | Count | Target Price |
|---|---|---|
| Buy | 3 (33.3%) | $13.35 - $20.00 |
| Hold | 1 (11.1%) | - |
| Sell | 5 (55.6%) | - |
Consensus Target |
- | $16.68 (+126.3%) [0] |
Investors should seek answers to the following questions during the earnings call:
- Net Interest Income Outlook:How is the declining rate environment affecting net interest margin?
- Credit Quality Trends:Are delinquency rates increasing? What is the provision outlook?
- Capital Return Plans:What is the dividend outlook given the capital position?
- Conservatorship Exit Timeline:What is the expected framework and timeline?
- Multifamily Strategy:How is the company addressing multifamily sector challenges?
- MSR Valuation:How are prepayments impacting the MSR portfolio?
- 2026 Origination Forecast:What are management’s expectations for purchase and refinance volumes?
- Competitive Positioning:How is Freddie Mac responding to competitive pressures?
- Conservative exit from conservatorship with favorable preferred stock treatment
- Sustained low mortgage rate environment boosting origination volumes
- Continued home price appreciation reducing credit losses
- Policy support for housing affordability
- Deteriorating credit quality in the portfolio
- Accelerating prepayments reducing MSR values
- Regulatory changes unfavorable to GSE structure
- Economic slowdown impacting housing demand
- Extreme stock volatility (beta of 1.81) [0]
Freddie Mac’s Q4 and full-year 2025 financial report will provide critical insights into the company’s positioning for 2026. Key takeaways for investors:
-
Valuation Opportunity:The P/E ratio of 2.13x and P/B ratio of 0.35x suggest potential undervaluation, though this must be weighed against corporate structure uncertainties [0].
-
Operating Performance:Strong ROE of 17.57% demonstrates efficient capital deployment, but profitability is heavily influenced by interest rate movements [0].
-
Housing Market Tailwinds:Declining mortgage rates and policy support create favorable conditions for 2026 [3][4].
-
Catalyst Watch:Any updates on conservatorship exit timeline could significantly impact valuation.
-
Risk Management:Credit quality trends and prepayment speeds will be key indicators of portfolio health.
[1] Business Insider - Freddie Mac Announces Release Date (https://markets.businessinsider.com/news/stocks/freddie-mac-announces-release-date-for-fourth-quarter-and-full-year-2025-financial-results-1035809861)
[2] SEC Filing - Freddie Mac Form 10-Q (https://www.sec.gov/Archives/edgar/data/1026214/000102621425000116/fmcc-20250930.htm)
[3] Freddie Mac PMMS - Mortgage Rates (https://www.freddiemac.com/pmms)
[4] LinkedIn - Mortgage & Housing Market Forecast (https://www.linkedin.com/pulse/mortgage-housing-market-forecast-new-american-funding-go6ec)
[5] Zillow Research - Home Value and Sales Forecast (https://www.zillow.com/research/home-value-sales-forecast-33822/)
[6] Chronicle Journal - $200 Billion Intervention (http://markets.chroniclejournal.com/chroniclejournal/article/marketminute-2026-1-19-the-200-billion-intervention-how-the-administration-is-using-fannie-mae-and-freddie-mac-to-reshape-the-mortgage-market)
[0] Ginlix API Data (Market data, financial analysis, technical indicators)
Insights are generated using AI models and historical data for informational purposes only. They do not constitute investment advice or recommendations. Past performance is not indicative of future results.
About us: Ginlix AI is the AI Investment Copilot powered by real data, bridging advanced AI with professional financial databases to provide verifiable, truth-based answers. Please use the chat box below to ask any financial question.