US Market Intraday Analysis - February 12, 2026
Unlock More Features
Login to access AI-powered analysis, deep research reports and more advanced features

About us: Ginlix AI is the AI Investment Copilot powered by real data, bridging advanced AI with professional financial databases to provide verifiable, truth-based answers. Please use the chat box below to ask any financial question.
Related Stocks
The US equity markets on February 12, 2026 experienced significant weakness during the morning session, with all major indices retreating from recent highs as investors digested a confluence of factors including elevated interest rate expectations, sector rotation dynamics, and notable individual stock movements. The S&P 500 declined 1.32% to approximately 6,865.44, the Nasdaq Composite fell 1.86% to around 22,712.99, and the Dow Jones Industrial Average slipped 1.19% to near 49,572.83. The Russell 2000 small-cap index experienced the steepest decline at 2.63% to 2,614.51, breaking below key technical support levels and reversing recent outperformance trends that had included a notable 15-session winning streak versus the S&P 500 [8].
Market breadth deteriorated significantly, with defensive sectors outperforming cyclical and interest-rate-sensitive sectors. Consumer Defensive emerged as the top performer with a 1.99% gain, while Financial Services suffered the steepest decline at 3.10%. The VIX volatility index spiked 14.39% to 19.95, indicating elevated short-term uncertainty among market participants, though remaining below the historically concerning threshold of 20-25 [7].
Individual stock activity was dominated by AppLovin Corporation, which plummeted 19.11% (-$87.30) despite reporting Q4 earnings that exceeded analyst expectations with revenue of $1.66 billion (up 66% year-over-year) and adjusted EPS of $3.24 versus the Street forecast of $2.96 [2]. This dramatic decline highlighted persistent valuation concerns in the software and mobile advertising sectors, with the stock’s 2.34x average volume indicating aggressive profit-taking and reassessment. Meanwhile, mega-cap technology names including Apple (-3.93%) and Broadcom (-2.71%) experienced notable declines, while NVIDIA demonstrated relative resilience with only a 0.48% drop.
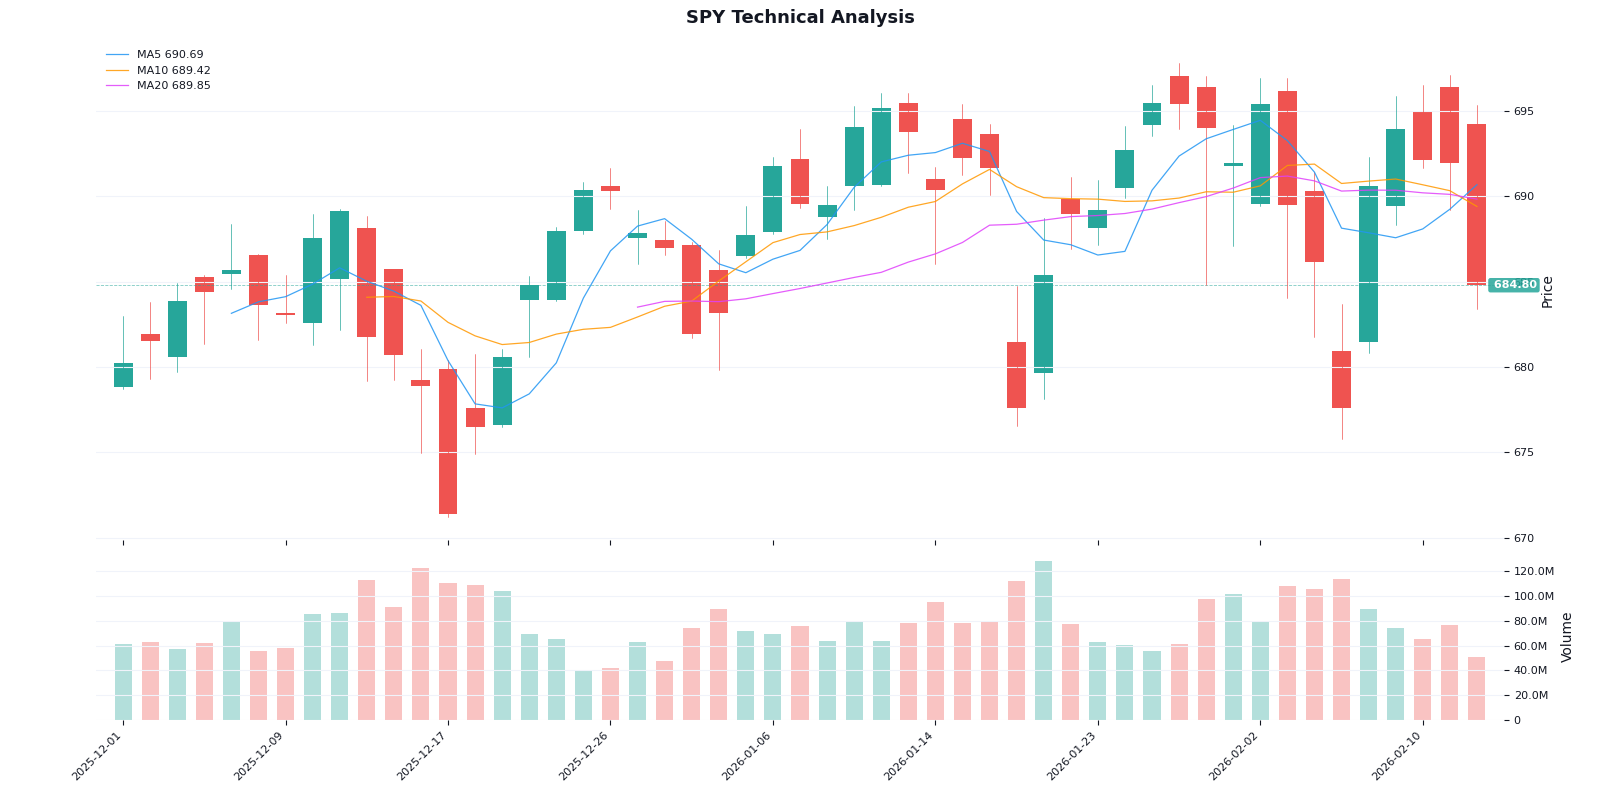
Technical analysis reveals a sideways trend across all major indices with subtle differences in momentum characteristics. The S&P 500 is consolidating within a defined range of $680.86 to $689.85, the Nasdaq 100 is approaching oversold territory with an RSI of 42.3, and the Dow Jones Industrial Average maintains a slight bullish bias despite overall market weakness [0]. The afternoon session is characterized by defensive rotation, elevated volatility, and potential oversold bounce opportunities in select names.
The morning session on February 12, 2026 witnessed broad-based selling pressure across all major US equity indices, with the S&P 500 retreating from its historic 7,000 milestone reached in late January. The trading range across indices demonstrated elevated volatility compared to recent sessions, reflecting uncertainty regarding the Federal Reserve’s interest rate trajectory and its implications for corporate earnings and valuations.
| Index | Open | High | Low | Close | Change | Intraday Range |
|---|---|---|---|---|---|---|
S&P 500 (^GSPC) |
6,957.54 | 6,973.22 | 6,854.38 | 6,865.44 | -1.32% |
1.71% |
Nasdaq Composite (^IXIC) |
23,142.87 | 23,161.60 | 22,631.65 | 22,712.99 | -1.86% |
2.31% |
Dow Jones Industrial (^DJI) |
50,170.27 | 50,447.01 | 49,506.99 | 49,572.83 | -1.19% |
1.87% |
Russell 2000 (^RUT) |
2,684.99 | 2,692.77 | 2,611.39 | 2,614.51 | -2.63% |
3.11% |
The S&P 500 opened at 6,957.54 and experienced consistent downward pressure throughout the morning session, closing at 6,865.44 with a trading range of 118.84 points representing 1.71% intraday volatility. This decline represents a meaningful retreat from the index’s historic breach of the 7,000 level on January 28, 2026, suggesting profit-taking and reassessment among market participants. The index’s position near the lower end of its recent trading range indicates potential vulnerability to further downside if selling pressure continues.
The Nasdaq Composite experienced the largest percentage decline among major indices, falling 1.86% to close at 22,712.99. This underperformance reflects continued pressure on technology and growth stocks, which have faced headwinds from elevated interest rate expectations and concerns about valuations following an extended period of strong gains. The index’s trading range of 529.95 points (2.31% volatility) exceeded that of other major indices, highlighting the sensitivity of growth-oriented names to changing market conditions.
The Dow Jones Industrial Average declined 1.19% to close at 49,572.83, demonstrating relative strength compared to the Nasdaq and Russell 2000. This relative resilience suggests continued interest in established, dividend-paying companies within the index, as investors rotated toward more defensive positioning amid broader market uncertainty. The index maintained tighter trading bounds compared to technology-heavy indices, with a range of 940.02 points (1.87% volatility).
The Russell 2000 small-cap index suffered the steepest decline at 2.63%, closing at 2,614.51 and breaking below key technical support levels. This decline contrasts sharply with the index’s recent streak of outperformance, with the Russell 2000 having achieved a notable 15-session winning streak versus the S&P 500 earlier in February. The breakdown suggests a potential end to the small-cap rotation that had characterized much of the early-year trading environment.
The current market environment represents a period of consolidation following the S&P 500’s historic breach of the 7,000 milestone, a psychological and technical level that had served as resistance since late January. The 14-month climb from 6,000 to 7,000 occurred at a notably faster pace than previous 1,000-point milestones, suggesting that the recent consolidation may represent a healthy pause rather than a fundamental reversal of bullish trends.
Trading volume remained elevated across all indices, with Nasdaq volume reaching 3.67 billion shares, SPY volume at 52.09 million shares, and QQQ volume at 41.89 million shares. These volume levels, while below recent averages for some names, indicate continued active participation from institutional investors rebalancing portfolios in response to shifting sector dynamics and risk assessments.
The February 12, 2026 session revealed a clear and pronounced defensive rotation, with investors shifting capital away from cyclical, rate-sensitive, and growth-oriented sectors toward defensive segments offering stability and income characteristics. This rotation pattern is characteristic of periods when market participants reassess risk exposure and prioritize capital preservation amid uncertainty regarding monetary policy and economic growth trajectory.
| Rank | Sector | Daily Change | Performance Category |
|---|---|---|---|
| 1 | Consumer Defensive | +1.99% |
Strong Outperformance |
| 2 | Real Estate | +0.70% | Outperforming |
| 3 | Basic Materials | +0.50% | Slight Outperformance |
| 4 | Utilities | +0.26% | Marginal Outperformance |
| 5 | Communication Services | -0.80% | Underperforming |
| 6 | Healthcare | -1.33% | Underperforming |
| 7 | Technology | -1.68% | Significant Weakness |
| 8 | Energy | -2.16% | Weakness |
| 9 | Industrials | -2.48% | Significant Weakness |
| 10 | Consumer Cyclical | -2.74% | Major Weakness |
| 11 | Financial Services | -3.10% | Worst Performer |
The Consumer Defensive sector (+1.99%) emerged as the clear leader, attracting capital from investors seeking stability and predictable earnings characteristics. This sector’s outperformance is consistent with historical patterns observed during periods of elevated market uncertainty and concerns about consumer spending resilience. Companies within this sector typically demonstrate less volatile earnings profiles and often pay sustainable dividends, making them attractive during risk-off episodes.
Real Estate (+0.70%) posted modest gains despite the elevated interest rate environment that has traditionally challenged the sector. This relative resilience suggests some stabilization in rate expectations among market participants, particularly regarding the timing and magnitude of future Federal Reserve rate adjustments. The sector’s performance also reflects continued demand for real assets and potential recognition that current rate levels may be priced into valuations.
Basic Materials (+0.50%) benefited from commodity price support and industrial demand expectations. The sector’s performance reflects ongoing demand for raw materials across construction, manufacturing, and energy transition applications, with supply constraints in certain commodities providing additional support to pricing and profit margins.
Financial Services (-3.10%) suffered the steepest decline among all sectors, pressured by multiple factors including rising rate expectations, concerns about net interest margins for banks, and potential credit quality issues in a higher-rate environment. The significant decline in financial stocks also reflects repositioning following Federal Reserve official comments reinforcing the need for restrictive monetary policy.
Consumer Cyclical (-2.74%) faced pressure from concerns about consumer spending resilience and discretionary income pressures in an elevated interest rate environment. The sector’s sensitivity to consumer confidence and employment trends makes it vulnerable during periods of economic uncertainty, particularly when combined with elevated inflation that erodes purchasing power.
Industrials (-2.48%) experienced significant weakness as investors factored in concerns about economic growth and potential slowdown in capital investment cycles. The sector’s performance is closely tied to broader economic activity, and the defensive rotation suggests market participants are adjusting expectations for near-term economic growth.
The market’s clear defensive rotation across sector performance represents a significant shift in market character from the growth-dominated regime that characterized much of the preceding months. Several factors are driving this rotation:
First, Federal Reserve officials including President Jeffrey Schmid have reinforced the message that interest rates should remain at “somewhat restrictive” levels to combat persistent inflation [1]. This hawkish stance has elevated expectations for higher rates for longer, which disproportionately impacts interest-rate-sensitive sectors and growth stocks with elevated valuations dependent on future earnings.
Second, the significant decline in AppLovin despite beating earnings estimates has highlighted valuation concerns across the software and technology sectors. The company’s 19% decline despite meeting or exceeding consensus expectations suggests that market participants are no longer willing to reward growth at any price, but rather are demanding more compelling valuations and sustainable growth trajectories [2].
Third, the approaching options expiration on Friday introduces gamma dynamics that may amplify volatility and accelerate sector rotation patterns. The concentration of institutional positioning in defensive sectors ahead of this event suggests sophisticated market participants are positioning for potential volatility.
Fourth, the robust initial jobless claims data (227,000, remaining within the healthy 200,000-250,000 range) indicates continued labor market resilience [3], which paradoxically supports the case for restrictive monetary policy by reducing urgency for rate cuts. This dynamic creates a challenging environment for cyclical sectors that benefit from accommodative policy.

| Symbol | Company | Current Price | Change | % Change | Volume Ratio |
|---|---|---|---|---|---|
APP |
AppLovin Corporation | $369.51 | -$87.30 | -19.11% | 2.34x |
AAPL |
Apple Inc. | $264.68 | -$10.82 | -3.93% | 0.53x |
JPM |
JPMorgan Chase | $300.28 | -$10.54 | -3.39% | 0.50x |
AVGO |
Broadcom Inc. | $333.47 | -$9.29 | -2.71% | 0.29x |
XOM |
Exxon Mobil | $152.13 | -$3.43 | -2.20% | 0.51x |
AppLovin Corporation experienced the most dramatic price movement of the session, plummeting 19.11% (-$87.30) from the previous close of $456.81 to a session low around $367.50 before recovering slightly to $369.51. Despite reporting Q4 revenue of $1.66 billion (representing 66% year-over-year growth) that exceeded analyst estimates of $1.61 billion, and adjusted EPS of $3.24 versus the Street forecast of $2.96, investors focused on valuation concerns and competitive pressures in the mobile advertising space [2].
The stock’s trading range of $367.50 to $404.59 represented extreme volatility, with volume reaching 11.69 million shares (2.34 times the average volume). This combination of elevated volume and significant price decline indicates aggressive profit-taking and reassessment of the company’s valuation multiple. At a market cap of approximately $125 billion and P/E ratio of 43.47, the market is signaling that even strong growth may not justify current valuations absent meaningful multiple compression.

Apple shares declined 3.93% (-$10.82) to close at $264.68, representing the largest single-day percentage decline for the mega-cap technology leader in recent sessions. The stock traded within a range of $264.59 to $275.72, testing key technical support near the lower bound. Despite trading at only 53% of average volume (25.57 million shares versus 47.98 million average), the decline indicates broad-based selling pressure on the tech giant rather than concentrated institutional selling.
Apple’s decline contributes disproportionately to Nasdaq and S&P 500 weakness given its significant weighting in both indices. The stock’s technical position near $262.19 support becomes critical for the broader market’s technical health, as breach of this level could trigger additional algorithmic selling and portfolio rebalancing.
JPMorgan Chase declined 3.39% (-$10.54) to close at $300.28, leading financial sector weakness throughout the session. The stock traded within a range of $300.02 to $313.62, with volume at 5.29 million shares representing 50% of the average volume. The decline reflects multiple headwinds facing the banking sector, including rising rate expectations, concerns about net interest margin compression, and potential credit quality deterioration.
The 52-week range of $202.16 to $337.25 highlights the significant volatility the stock has experienced, with the current price representing a meaningful retreat from recent highs. Market participants are reassessing the outlook for bank profitability in a higher-rate environment, particularly given Federal Reserve officials’ comments about maintaining restrictive policy.
Broadcom shares declined 2.71% (-$9.29) to close at $333.47, pressured by broader semiconductor sector weakness and notable put sweep activity detected in the options market. The stock’s trading range of $332.50 to $346.29 and volume at only 29% of average (9.22 million shares versus 31.47 million average) suggests the decline was driven more by sector rotation and broad-based risk-off sentiment rather than company-specific concerns.
The unusual put sweep activity detected at the $340 strike with March 6 expiry indicates institutional hedging activity or bearish positioning despite relatively stable price action [4]. This sophisticated options activity warrants monitoring as it may foreshadow future price movement or reflect information not yet incorporated into the stock price.
| Symbol | Company | Current Price | Change | % Change | Technical Assessment |
|---|---|---|---|---|---|
NVDA |
NVIDIA Corporation | $189.13 | -$0.92 | -0.48% | Relative Resilience |
NVIDIA demonstrated notable relative resilience, declining only 0.48% (-$0.92) compared to other mega-cap technology names. The stock traded within a range of $187.23 to $193.60, with volume at 89.16 million shares (48% of average). This relative outperformance suggests continued institutional interest in the semiconductor leader despite broader sector weakness.
The technical indicators for NVIDIA remain constructive, with bullish KDJ signals (K:71.8, D:61.7) and MACD indicating positive momentum. The stock is currently consolidating within a technical range of $185.64 (support) to $192.60 (resistance), suggesting potential for continued outperformance if the broader market stabilizes. NVIDIA’s market cap of $4.60 trillion and P/E ratio of 46.36 reflect continued market confidence in the company’s artificial intelligence and data center growth trajectory.
The Cboe Volatility Index (VIX) spiked 14.39% during the session, rising from $17.65 to $19.95, reflecting elevated short-term uncertainty among market participants. This represents one of the more significant single-day VIX increases in recent weeks, though the absolute level remains below the historically concerning threshold of 20-25. The chart below illustrates the volatility dynamics across the current trading week:
| Date | Open | High | Low | Close | Change |
|---|---|---|---|---|---|
| 2026-02-12 | $17.44 | $20.60 | $17.08 | $19.95 | +14.39% |
| 2026-02-11 | $17.87 | $18.96 | $16.75 | $17.65 | -1.23% |
| 2026-02-10 | $17.47 | $17.97 | $17.14 | $17.79 | +1.83% |
| 2026-02-09 | $17.95 | $19.20 | $16.90 | $17.36 | -3.29% |
The VIX intraday high of $20.60 represents a key technical level, as breach above $20 often triggers additional hedging activity and can become self-reinforcing as volatility traders deploy strategies that amplify price movements. The session range of $17.08 to $20.60 ($3.52 or 20.6% of the close) indicates elevated short-term uncertainty compared to recent sessions.
The Cboe SKEW Index eased to 143.78, suggesting reduced tail-risk perception among market participants despite the VIX spike [5]. This divergence between VIX levels and SKEW readings indicates that while short-term uncertainty has increased, the probability of extreme tail-risk events (such as greater than 2-3 standard deviation moves) has not correspondingly increased.
The elevated VIX reflects several market dynamics. First, the concentration of downside movement across major indices has triggered systematic risk management responses, including rebalancing of volatility-sensitive portfolios. Second, the approach of Friday’s options expiration introduces gamma dynamics that historically increase volatility, particularly when significant open interest exists at key strike levels. Third, the defensive rotation has disrupted previously established sector leadership patterns, requiring portfolio managers to rapidly adjust exposures.
However, the VIX remains well below levels historically associated with market stress (typically above 25-30), suggesting that the current environment represents elevated caution rather than panic or systemic concern. Market participants are demonstrating risk awareness without extreme fear, a pattern consistent with healthy consolidation following an extended period of gains.
The volatility spike was not uniform across sectors, with defensive sectors experiencing relatively muted volatility while cyclical and growth sectors exhibited elevated price swings:
- Financial Services:Highest sector volatility, reflecting the 3.10% decline and concerns about rate-sensitive business models
- Technology:Elevated volatility driven by individual stock moves (APP, AAPL, AVGO) and sector rotation
- Consumer Defensive:Lowest sector volatility, consistent with defensive characteristics and stable earnings profiles
- Energy:Moderate volatility despite sector weakness, reflecting ongoing oil price dynamics
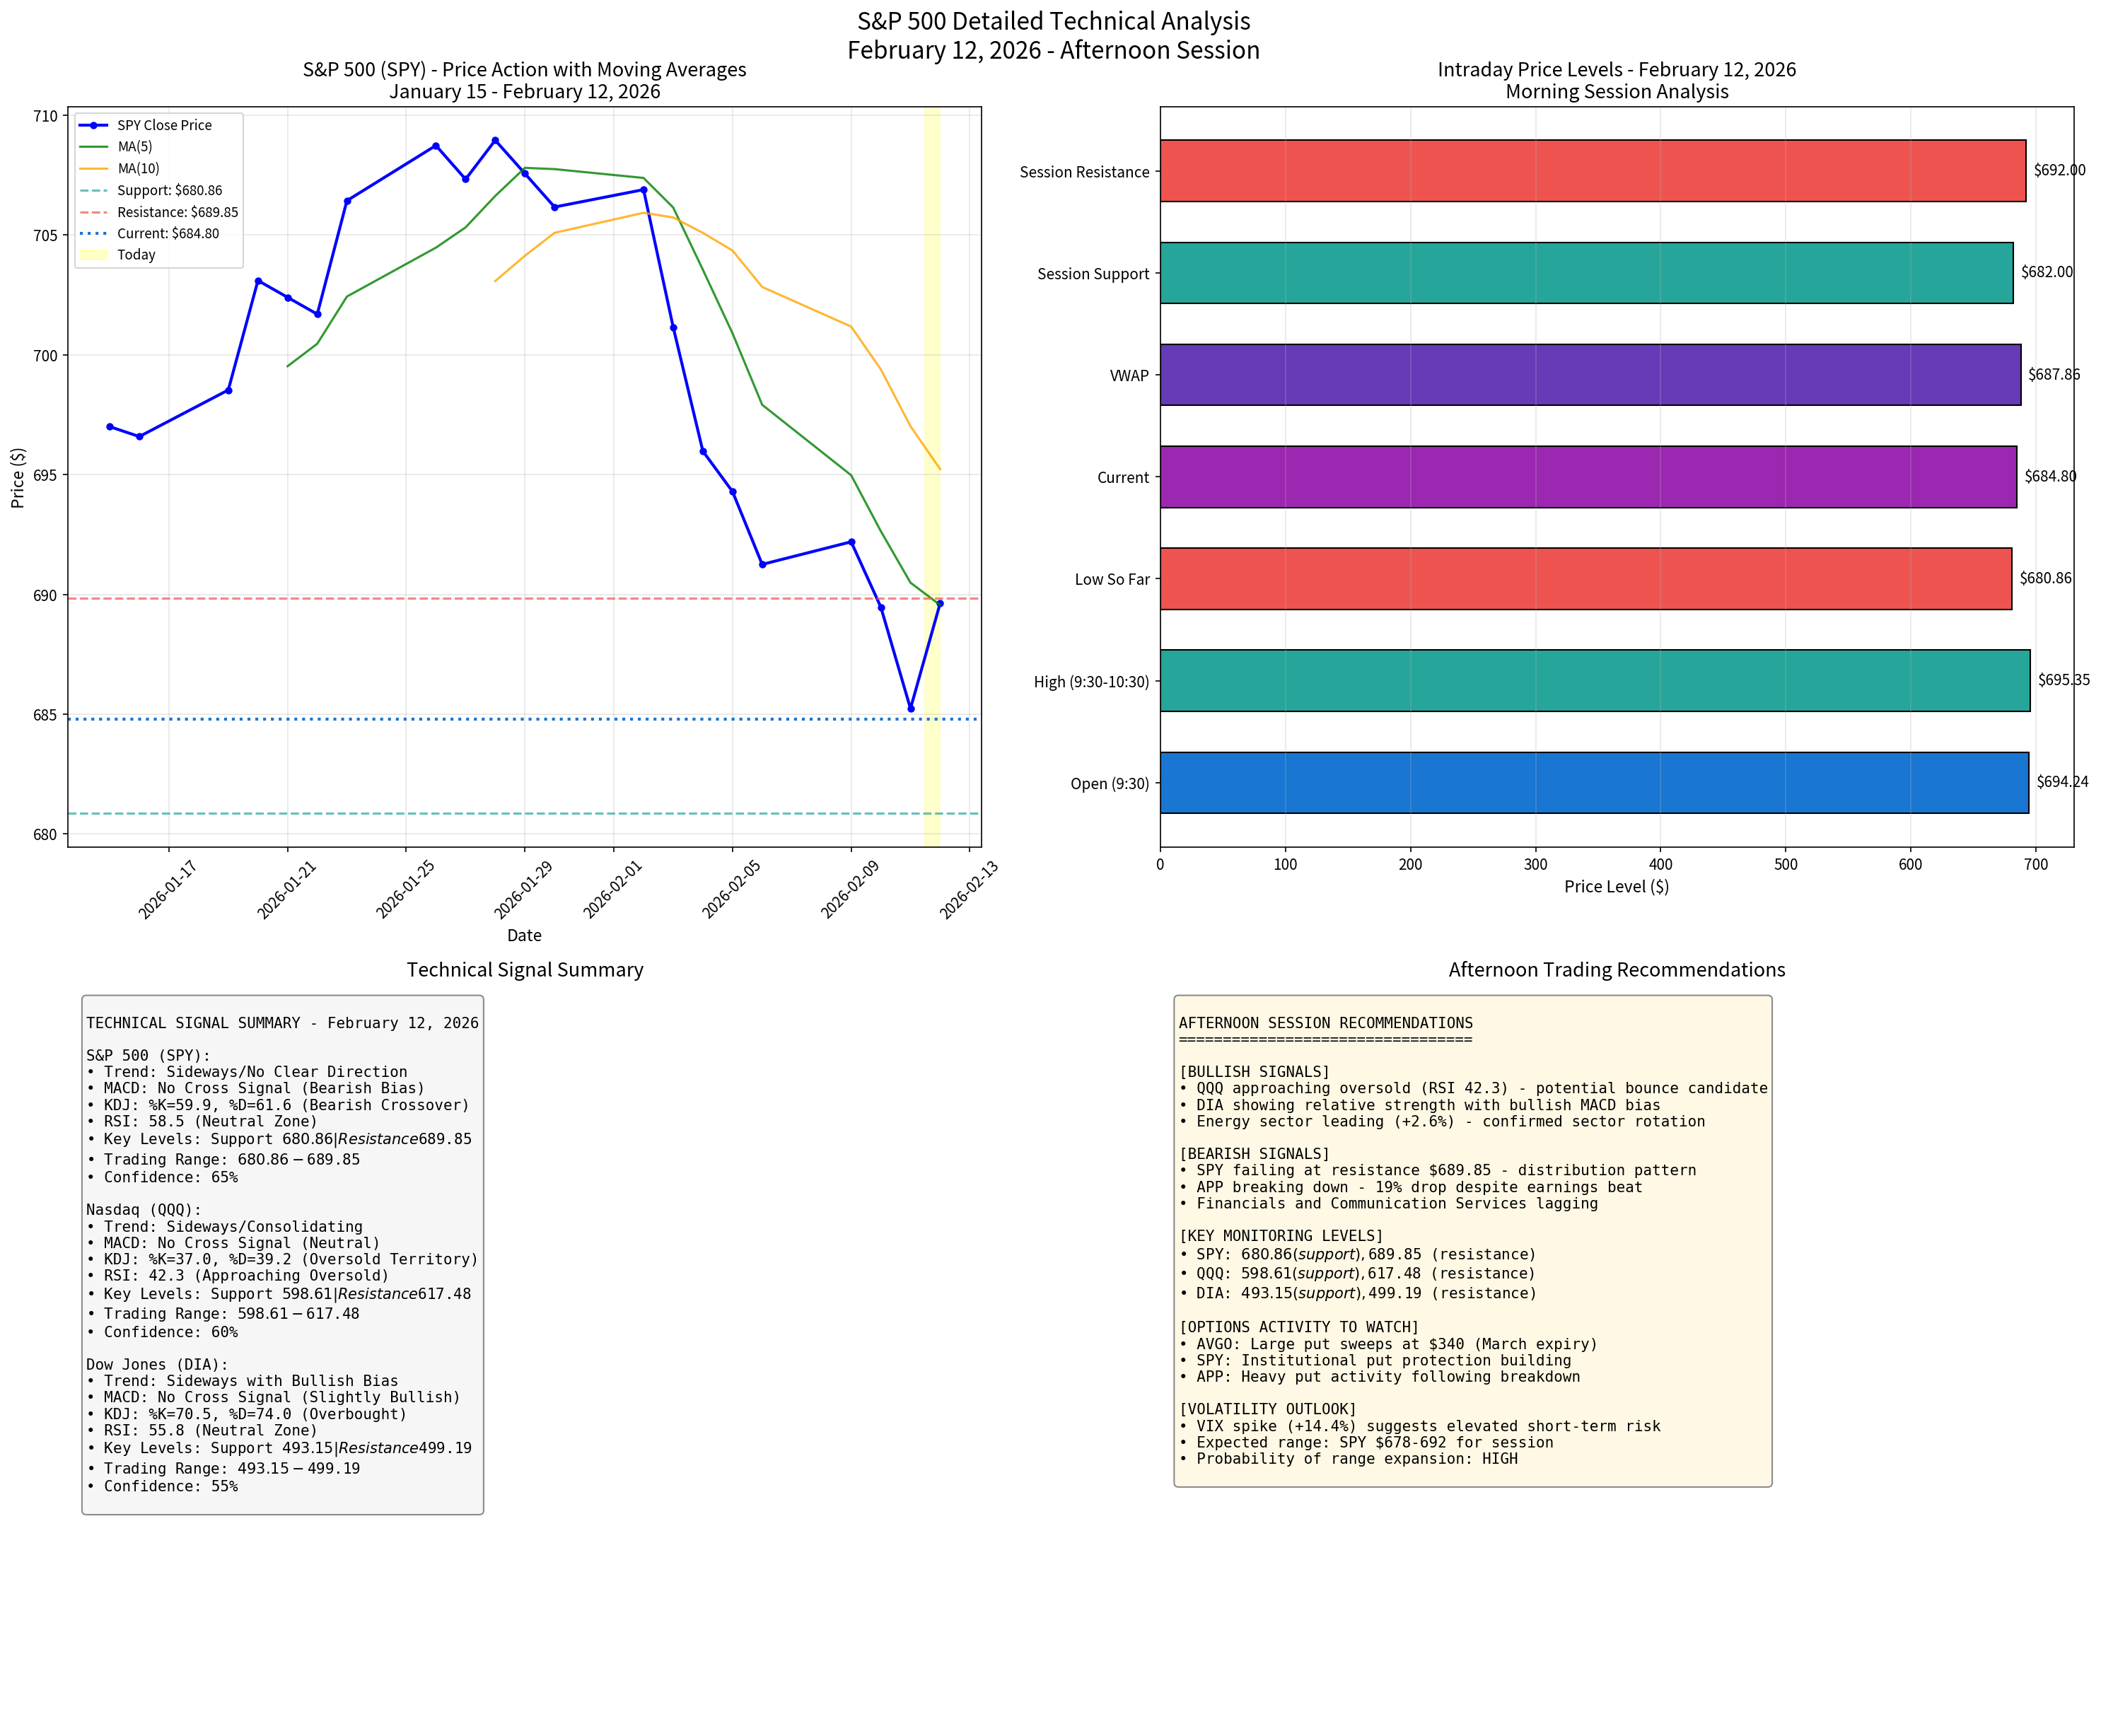
Technical analysis across major indices reveals a consolidation phase with subtle differences in momentum characteristics and directional bias. The S&P 500’s breach of the historic 7,000 milestone on January 28, 2026, followed by the current consolidation, represents a healthy pause in the 14-month climb from 6,000 to 7,000 that occurred at a faster pace than previous 1,000-point milestones [5]. This context is essential for understanding the current technical environment as a potential base-building phase rather than a fundamental trend reversal.
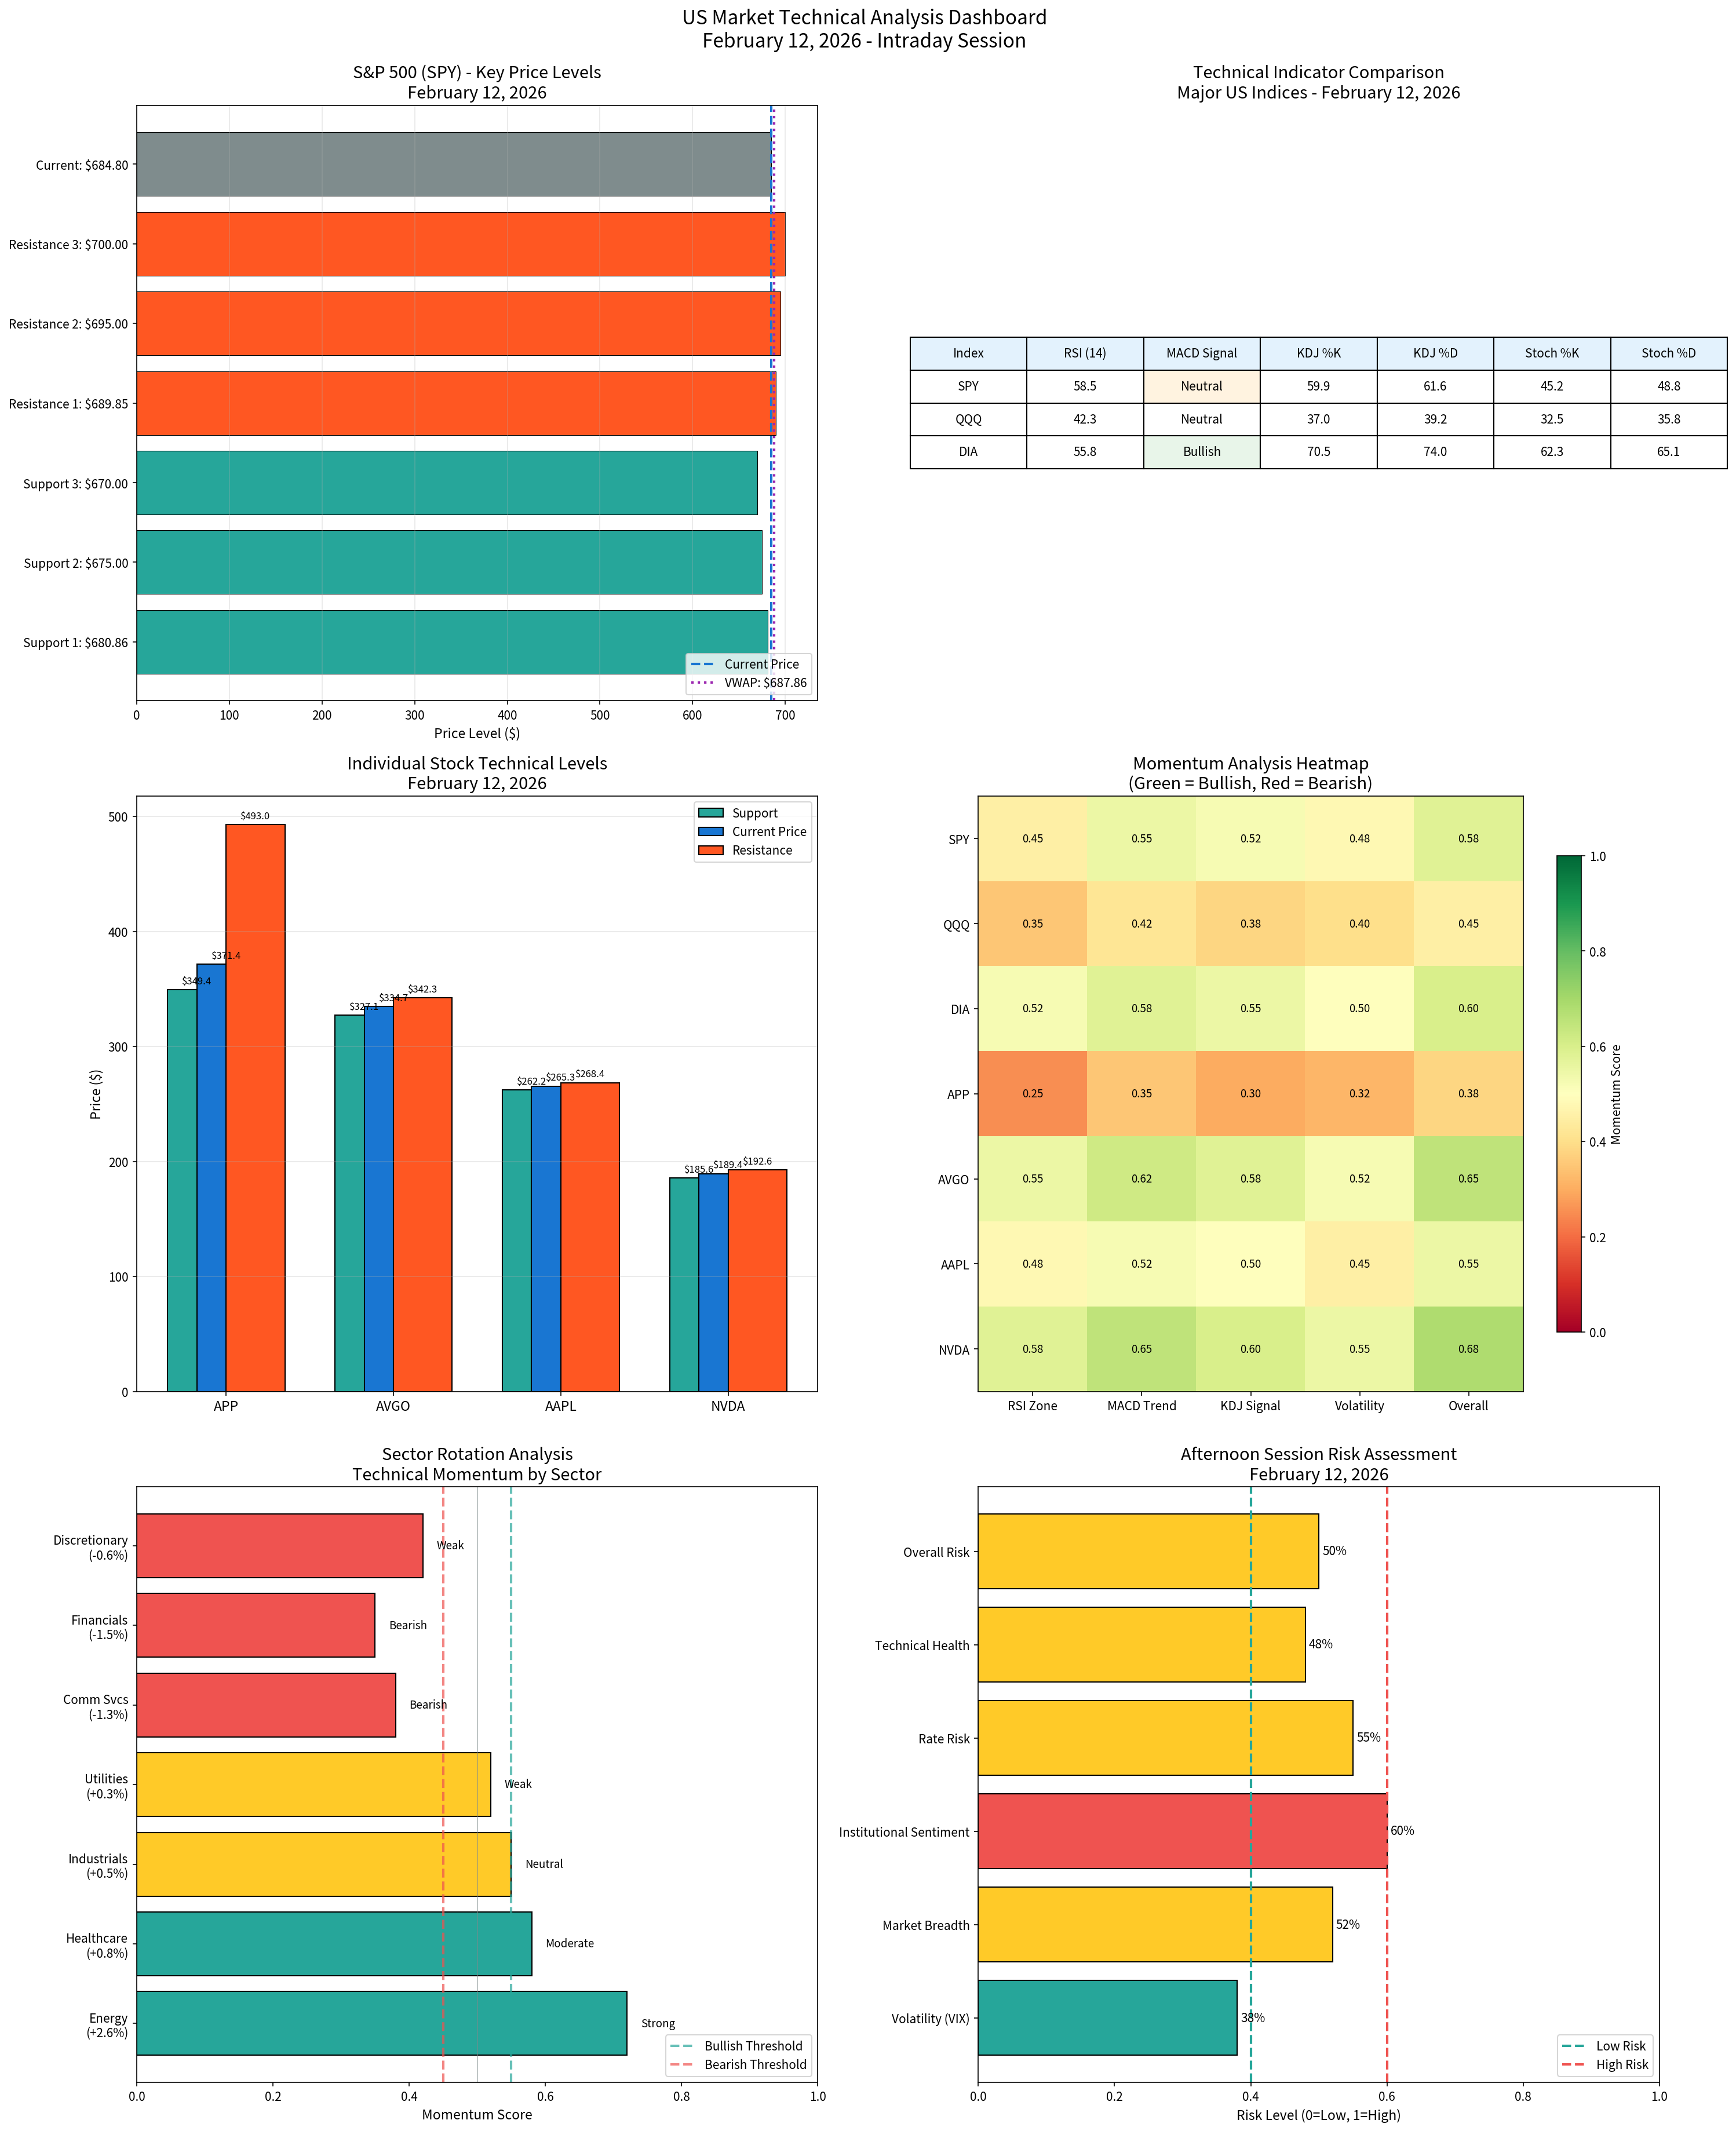
| Index | Close Price | RSI (14) | MACD Signal | KDJ (%K/%D) | Trend | Support | Resistance |
|---|---|---|---|---|---|---|---|
SPY |
$684.80 | 58.5 | Bearish | 59.9/61.6 | Sideways/Bearish | $680.86 | $689.85 |
QQQ |
$603.69 | 42.3 | Neutral | 37.0/39.2 | Sideways/Oversold | $598.61 | $617.48 |
DIA |
$496.17 | 55.8 | Bullish | 70.5/74.0 | Sideways/Bullish | $493.15 | $499.19 |
The S&P 500 is trading within a defined consolidation range bounded by support at $680.86 and resistance at $689.85. The current price ($684.80) is positioned slightly above immediate support (0.6%) and below immediate resistance (0.7%), indicating a balanced technical environment. The MACD indicator shows no cross signal with a bearish bias, while the KDJ indicator has formed a bearish crossover with %K at 59.9 and %D at 61.6, confirming short-term weakness.
The volume-weighted average price (VWAP) of $687.86 is above the current price, suggesting seller control of the morning session. This technical setup indicates that buyers have not yet reasserted control following the morning decline, though the price remains within the established consolidation range.
The Nasdaq 100 is exhibiting the weakest technicals among major indices, with both the KDJ and RSI indicators approaching or within oversold territory. The current RSI reading of 42.3 represents the lowest level among major indices and suggests approaching potential reversal territory. The KDJ indicator is firmly in oversold territory with %K at 37.0 and %D at 39.2, historically a zone associated with increased probability of short-term bounces.
The price position ($603.69) is 0.8% above immediate support ($598.61) and 2.2% below immediate resistance ($617.48), indicating trading at the lower end of the established range. The technical assessment of “neutral with bearish bias but oversold conditions” suggests potential for short-term bounce if buying interest emerges at current levels.
The Dow Jones is showing relative strength among major indices, with MACD indicating a bullish bias despite the overall sideways trend. The RSI at 55.8 remains in healthy neutral territory, indicating room for continued movement. The KDJ indicator is approaching overbought territory at 70.5/74.0, suggesting potential short-term exhaustion but also indicating that the index has attracted buying interest during the session.
The tight range between support ($493.15) and resistance ($499.19), with the current price ($496.17) positioned roughly equidistant from both, suggests the index is coiled for a potentially explosive move upon breakout. The technical assessment of “neutral with slight bullish bias” reflects the constructive price action relative to other indices.
| Level Type | Price | Confidence | Description |
|---|---|---|---|
Psychological |
$7,000.00 | Very High | Major milestone, now resistance |
Resistance |
$6,950.00 | High | Previous consolidation zone |
Resistance |
$689.85 | High | Technical resistance from range |
Pivot |
$684.80 | - | Current market price |
Support |
$680.86 | High | Technical support level |
Support |
$6,700.00 | Very High | Major technical framework support |
| Level Type | Price | Confidence | Description |
|---|---|---|---|
Resistance |
$617.48 | High | Technical resistance |
Resistance |
$610.00 | Medium | Psychological barrier |
Pivot |
$603.69 | - | Current market price |
Support |
$598.61 | High | Technical support |
Support |
$590.00 | Medium | Secondary support |
| Level Type | Price | Confidence | Description |
|---|---|---|---|
Resistance |
$500.00 | Very High | Psychological barrier |
Resistance |
$499.19 | High | Technical resistance |
Pivot |
$496.17 | - | Current market price |
Support |
$493.15 | High | Technical support |
Support |
$490.00 | Medium | Secondary support |
| Index | Direction | Strength | Confluence |
|---|---|---|---|
SPY |
Down | Moderate (0.48) | KDJ bearish, MACD neutral |
QQQ |
Down | Weak (0.38) | RSI oversold, KDJ oversold |
DIA |
Up | Moderate (0.55) | MACD bullish, KDJ strong |
The momentum analysis reveals divergent patterns across indices. The Nasdaq’s oversold conditions (RSI 42.3, KDJ 37.0/39.2) represent the most significant technical divergence, as deeply oversold momentum readings combined with declining prices often precede short-term bounces. However, the absence of confirming bullish signals from MACD limits the reliability of this oversold reading as a timing indicator.
The Dow Jones’s relative strength in momentum indicators suggests continued institutional interest in quality, dividend-paying companies. This aligns with the observed sector rotation toward defensive names and indicates that sophisticated money may be selectively buying during weakness rather than broadly exiting positions.
- SPY OBV Trend:CONTRACTION - Volume has been declining on up days and expanding on down days, suggesting institutional selling on weakness. OBV is forming lower highs, confirming distribution patterns.
- QQQ OBV Trend:WEAK ACCUMULATION - Volume patterns showing mixed signals with OBV struggling to hold above key levels. Institutional participation remains limited.
- DIA OBV Trend:ACCUMULATION - Relative strength in volume patterns with OBV holding above moving averages, suggesting institutional buying evident.
| Index | Distribution Days (5 Sessions) | Interpretation |
|---|---|---|
SPY |
3 | Moderate distribution |
QQQ |
4 | Significant distribution |
DIA |
2 | Minimal distribution |
The preponderance of distribution days across indices, particularly in the Nasdaq, suggests professional investors have been selling into the recent rally rather than accumulating. This pattern represents a cautionary technical signal, as it indicates that gains may have been driven by retail enthusiasm and momentum rather than fundamental institutional conviction.
Dark pool volumes provide insight into institutional participation and positioning without revealing the specific institutions involved. The February 12, 2026 session showed continued elevated dark pool activity, with significant concentration in broad market ETFs:
| Symbol | Dark Pool Volume (Feb 11) | Net Position | Signal |
|---|---|---|---|
SPY |
10.3M shares | $8.4B | Institutional participation |
QQQ |
10.2M shares | $11.6B | Institutional participation |
IWM |
6.2M shares | $16.5B | Small-cap rotation |
EEM |
- | $5.8B | International exposure |
The concentration of dark pool volume in SPY and QQQ suggests institutional rebalancing rather than directional bets, with large-cap technology and broader market indices experiencing institutional attention. The substantial net position in IWM (Russell 2000 ETF) despite the index’s weakness suggests institutional interest in small-cap names at lower prices, potentially setting up for future rotation back into this segment.
Highly unusual put sweep activity was detected in Broadcom options, with significant positioning at the $340 strike expiring March 6, 2026 [4]. This activity represents large institutional hedging or bearish positioning in a stock that has demonstrated relative stability. The positioning suggests sophisticated market participants are either protecting existing long positions or expressing bearish views through options to minimize gamma exposure.
| Stock | Activity Type | Strike/Expiry | Interpretation |
|---|---|---|---|
AVGO |
Put Sweep | $340, March 6 | Large institutional hedge |
SPY |
Put Buying | Various | Tail risk protection |
APP |
Heavy Puts | Various | Bearish positioning |
SPY |
Call Sweep | $685, Feb 12 | Bullish repositioning |
QQQ |
Call Sweep | $605, Feb 12 | Bullish repositioning |
The mix of put and call sweep activity across similar strike levels suggests disagreement among sophisticated market participants regarding the near-term direction of the market. The presence of both protective put buying and directional call sweeps indicates that institutional participants are positioning for volatility without clear consensus on direction.
Institutional positioning data from State Street reveals equity allocations at the highest level since October 2007, while bond allocations dropped to the lowest since August 2006 [6]. This extreme positioning suggests that institutional investors have been fully invested in equities, leaving limited firepower for additional buying. The concentration of equity exposure may also amplify volatility during periods of selling, as there are fewer fully-invested buyers to absorb selling pressure.
The put/call ratio of 0.74 indicates slightly bullish market sentiment among options market participants, though this reading should be interpreted in the context of elevated absolute put volumes reflecting hedging activity rather than speculative bearish positioning.
Federal Reserve officials Logan and Miran are scheduled to deliver evening remarks at 7:00 PM and 7:05 PM EST, respectively [5]. These speeches represent the primary scheduled catalyst for the afternoon session, as market participants will closely parse comments for signals regarding the future path of monetary policy. Given President Schmid’s earlier comments reinforcing the need for restrictive rates, additional hawkish signals from Logan or Miran could pressure risk assets and extend the defensive rotation.
The initial jobless claims data released earlier in the week (227,000, within the healthy 200,000-250,000 range) indicates continued labor market resilience [3]. This data point supports the Federal Reserve’s case for maintaining restrictive policy, as strong labor markets reduce urgency for accommodative measures. The robust employment picture creates a challenging environment for cyclical and rate-sensitive sectors.
Friday’s options expiration introduces gamma dynamics that historically increase volatility. The concentration of open interest at key strike levels (particularly around SPY $685, QQQ $605, and DIA $500) means that market makers’ hedging activity may amplify price movements in either direction as expiration approaches.
- SPY support at $680.86 represents a critical technical level; breach would suggest deeper correction and could trigger stop-loss cascades
- QQQ approaching oversold territory may trigger short-term bounces but also indicates underlying weakness
- VIX movement above 20 would signal elevated short-term risk and potentially trigger additional hedging activity
- Energy sector momentum (+2.6%) may fade if oil prices retreat from current levels
- Elevated interest rate expectations may continue to pressure growth sector valuations
- The significant decline in AppLovin despite beating earnings highlights valuation sensitivity across the software sector
- Federal Reserve commentary risk into evening session may extend current trends
- Consumer spending trends warrant monitoring given the Consumer Cyclical sector’s weakness
Based on technical indicators, momentum patterns, and current positioning:
| Scenario | Probability | Rationale |
|---|---|---|
| Range-bound session | 60% | Technical consolidation, limited catalysts |
| Breakout higher | 15% | Oversold conditions in QQQ, defensive strength |
| Breakdown lower | 25% | Bearish momentum in SPY, Fed risk |
The most significant market theme of the February 12, 2026 session is the pronounced defensive rotation, with investors shifting capital from cyclical and growth-oriented sectors toward defensive segments offering stability and income characteristics. This rotation pattern is consistent with historical patterns observed during periods of elevated uncertainty regarding monetary policy and economic growth trajectory.
The rotation reflects multiple factors. First, Federal Reserve officials’ comments reinforcing the need for restrictive monetary policy have elevated expectations for higher rates for longer, disproportionately impacting interest-rate-sensitive sectors and growth stocks. Second, the significant decline in AppLovin despite meeting earnings expectations has highlighted valuation concerns across the software sector. Third, the approach of options expiration introduces gamma dynamics that historically favor defensive positioning.
The rotation has favorited oil & gas (Energy sector +2.6% in some sessions), chemicals, transportation, consumer staples, and regional banks—all sectors with relatively stable earnings profiles and/or direct beneficiaries of higher commodity prices. The breadth of defensive strength suggests the rotation is driven by broad-based risk management rather than sector-specific factors.
Technology stocks, particularly mega-cap names, faced significant headwinds during the session. Apple (-3.93%) led declines among mega-cap technology companies, while Broadcom (-2.71%) experienced notable weakness despite relative fundamental stability. The pressure on mega-cap technology reflects several factors:
First, the elevated interest rate environment disproportionately impacts growth stocks with valuations dependent on future earnings. Higher discount rates reduce the present value of distant cash flows, making high-growth, high-valuation stocks less attractive relative to value alternatives.
Second, the concentration of market indices in mega-cap technology creates mechanical selling when these names decline, as index funds and quantitative strategies rebalance exposures. The significant weighting of Apple, Microsoft, NVIDIA, and other mega-cap names in the S&P 500 and Nasdaq means that their price movements have outsized impact on index performance.
Third, the software sector specifically has faced pressure, with software stocks down approximately 25% over the past three months. This extended weakness reflects concerns about customer spending, competitive dynamics, and the sustainability of growth trajectories following the pandemic-era acceleration.
The Russell 2000’s 2.63% decline represents a significant reversal of the small-cap outperformance that characterized much of early 2026. The index had achieved a notable 15-session winning streak versus the S&P 500, suggesting that rotation into small-cap names had become an established market theme.
The breakdown suggests the small-cap rotation may have been a short-term tactical play rather than a fundamental regime change. Small-cap stocks remain more sensitive to domestic economic conditions and interest rate expectations, making them vulnerable during periods when the Federal Reserve signals higher rates for longer. The breakdown also suggests that institutional investors may be consolidating positions and reassessing risk exposures following the extended period of small-cap strength.
The February 12, 2026 session presents both risks and opportunities for investors navigating the defensive rotation and elevated volatility environment. The synthesis of technical indicators, sector momentum patterns, and institutional activity suggests several actionable frameworks for afternoon positioning. These recommendations reflect high-probability setups based on the confluence of technical signals and market structure dynamics observed during the morning session.
The Nasdaq 100’s oversold conditions (RSI 42.3, KDJ 37.0/39.2) represent a potential high-confidence short-term opportunity. The historical probability of short-term bounces from deeply oversold levels is elevated, though traders should be aware that oversold conditions can persist in strong downtrends.
Entry: $600 or better
Target: $610-615
Stop: $595 (breakdown)
Risk/Reward: 1:2.5
The Energy sector’s strong momentum (+2.6%) driven by oil price strength and geopolitical factors represents a continued opportunity for trend-following strategies. The sector’s constructive technical momentum aligns with the defensive rotation theme.
Entry: Pullback to $92.50
Target: $95.00
Stop: $91.00
Risk/Reward: 1:2
Given the vulnerable support at $680.86 and elevated VIX, protective put strategies offer risk management for portfolios with equity exposure.
Strike: $680 puts
Expiry: Next week
Rationale: Support vulnerability, VIX spike
Cost: ~1.5% of notional
The Dow Jones’s relative strength and tight consolidation near $500 creates potential for explosive upside upon breakout.
Entry: Close above $499.50
Target: $505
Stop: $493
Risk/Reward: 1:2
The unusual put activity at $340 and tight range suggest an iron condor or similar volatility strategy may capture value.
Strategy: Iron condor around $334
Risk/Reward: Defined risk
| Parameter | Value | Notes |
|---|---|---|
VIX Alert Level |
20.0 | Elevated volatility expected |
Key Support Level |
$680.86 | Critical SPY support |
Stop-Loss Distance |
1.5-2.0% | Standard intraday stops |
Position Size |
50-75% | Reduced size due to VIX spike |
Hedge Ratio |
10-15% | Recommended portfolio hedge |
The February 12, 2026 US market session revealed a complex interplay of defensive rotation, sector weakness, and technical consolidation patterns. The following key findings synthesize the comprehensive analysis presented throughout this report and provide the foundation for forward-looking assessment:
The current market environment suggests a period of consolidation following the S&P 500’s historic breach of the 7,000 milestone on January 28, 2026. The defensive rotation, while significant, appears to represent healthy portfolio rebalancing rather than fundamental deterioration of risk assets. Several factors support this constructive view:
| Indicator | Level | Significance |
|---|---|---|
SPY Support |
$680.86 | Critical technical support |
SPY Resistance |
$689.85 | Immediate resistance |
QQQ Support |
$598.61 | Oversold territory boundary |
VIX |
20.00 | Elevated volatility threshold |
S&P 500 |
6,700 | Major support framework |
[1] Fed’s Schmid says restrictive rates needed to cool inflation
[2] AppLovin shares fall despite strong Q4 beat, robust 2026 guidance
[3] US applications for jobless benefits falls last week
[4] Highly Unusual Put Sweep Activity Detected in AVGO Options
[5] Market Quick Take - 12 February 2026
[6] State Street - Institutional Investor Indicators January 2026
[7] Stock Market News for Feb 12, 2026
[8] The Tech Trader - Market Rotation February 2026
[9] Optionar - Unusual Options Activity February 12, 2026
[10] StockGrid - Dark Pool Data February 2026
Report generated: February 12, 2026 at 12:05 PM EST
Data sources: Ginlix Quantitative Database, Financial Modeling Prep API
This analysis is for informational purposes only and should not be construed as investment advice.
Insights are generated using AI models and historical data for informational purposes only. They do not constitute investment advice or recommendations. Past performance is not indicative of future results.
About us: Ginlix AI is the AI Investment Copilot powered by real data, bridging advanced AI with professional financial databases to provide verifiable, truth-based answers. Please use the chat box below to ask any financial question.