Mid-Session US Market Analysis - February 13, 2026
Unlock More Features
Login to access AI-powered analysis, deep research reports and more advanced features
About us: Ginlix AI is the AI Investment Copilot powered by real data, bridging advanced AI with professional financial databases to provide verifiable, truth-based answers. Please use the chat box below to ask any financial question.
Related Stocks
The US stock market on February 13, 2026, is experiencing a significant mid-session recovery following the sharp selloff that characterized the morning trading session and the previous day’s market action. All three major indices have transitioned from negative territory to post modest gains, with the S&P 500 leading the recovery at +0.61%. The market continues to exhibit elevated volatility, with the VIX remaining at 20.82, reflecting persistent investor concerns about AI-related disruptions to the technology sector and broader economic uncertainties. Despite the intraday recovery, underlying market structure remains fragile, as evidenced by weak breadth indicators showing decliners outpacing advancers by more than 2-to-1 on both exchanges. The CPI data released earlier today showed inflation cooling to 2.4% year-over-year, the lowest level since May 2025, providing a potentially supportive backdrop for Federal Reserve policy accommodation. However, markets have focused more on sector rotation dynamics and AI-related concerns than the positive inflation developments.
| Index | Current Price | Day Change | % Change | Day Range | Previous Close |
|---|---|---|---|---|---|
| S&P 500 (^GSPC) | $6,874.22 | +41.46 | +0.61% | 6,794.55 - 6,874.51 | $6,832.76 |
| Nasdaq Composite (^IXIC) | $22,689.11 | +91.96 | +0.41% | 22,402.38 - 22,698.29 | $22,597.15 |
| Dow Jones Industrial (^DJI) | $49,701.45 | +249.46 | +0.50% | 49,084.35 - 49,705.20 | $49,451.99 |
| Date | S&P 500 Close | Change | Nasdaq Close | Change | Dow Close | Change |
|---|---|---|---|---|---|---|
| 2026-02-13 (Intraday) | 6,874.22 | +0.61% | 22,689.11 | +0.41% | 49,701.45 | +0.50% |
| 2026-02-12 | 6,832.76 | -1.79% | 22,597.15 | -2.36% | 49,451.99 | -1.71% |
| 2026-02-11 | 6,941.46 | -0.50% | 23,066.47 | -0.91% | 50,121.41 | -0.24% |
| 2026-02-10 | 6,941.82 | -0.47% | 23,102.47 | -0.73% | 50,188.15 | -0.01% |
| 2026-02-09 | 6,964.81 | +0.69% | 23,238.67 | +1.25% | 50,135.88 | +0.29% |
The market opened the session following the significant correction experienced on February 12, when the S&P 500 fell 1.79%, the Nasdaq dropped 2.36%, and the Dow Jones declined 1.71% [0]. The February 12 selloff represented the most significant market correction since the 2018-2019 AI panic, driven by escalating concerns about artificial intelligence’s potential impact on software jobs and the broader technology sector [1]. The current session demonstrates a notable recovery, with all indices successfully transitioning from negative to positive territory. The S&P 500 is leading the recovery with a 0.61% gain, followed by the Dow Jones at +0.50% and the Nasdaq at +0.41%. This pattern suggests a broad-based recovery across market capitalizations, though the Nasdaq’s relatively weaker performance reflects ongoing caution toward technology-related equities.
| Sector | Change | Status |
|---|---|---|
| Utilities | +3.56% | Leader |
| Healthcare | +2.25% | Strong |
| Energy | +1.68% | Strong |
| Consumer Defensive | +1.64% | Strong |
| Basic Materials | +1.51% | Strong |
| Industrials | +0.87% | Positive |
| Financial Services | +0.39% | Positive |
| Communication Services | +0.35% | Positive |
| Technology | -0.05% | Laggard |
| Consumer Cyclical | -0.07% | Laggard |
| Real Estate | -0.09% | Worst |
The rotation dynamics observed on February 13 represent a continuation and intensification of the risk-off sentiment that characterized the previous trading session. When examining the sector performance in detail, several patterns emerge that warrant closer analysis.
The morning session witnessed a notable shift in sector leadership. Early trading saw defensive sectors maintain their dominance, but as the session progressed, there were signs of broadening participation. Financial services (+0.39%) and communication services (+0.35%) have transitioned from laggards to positive territory, suggesting some risk appetite returning to the market. However, technology (-0.05%) and consumer cyclical (-0.07%) sectors remain under pressure, indicating that the rotation toward defensive assets remains the dominant market theme.
| Indicator | Value | Interpretation |
|---|---|---|
| NYSE Adv/Decl Ratio | 2.17:1 (decliners) | Bearish - significantly more decliners |
| Nasdaq Adv/Decl Ratio | 2.74:1 (decliners) | Very Bearish - extreme breadth weakness |
| NYSE New Highs/Lows | 748 / 229 | Positive bias in new highs |
| S&P 500 52-Week Highs/Lows | 99 / 32 | Generally positive momentum |
| Trading Volume (Feb 12) | 22.45 billion shares | Above 20-session average (20.78B) |
| VIX Volatility Index | 20.82 (+17.96%) | Elevated - highest since 2018-2019 AI panic |
The market breadth data presents a mixed picture. Despite the intraday recovery, decliners continue to significantly outpace advancers on both exchanges, with the Nasdaq showing particularly weak breadth at 2.74-to-1 [0]. This divergence between index-level gains and underlying breadth is a notable concern, suggesting that the recovery may be concentrated in a limited number of stocks rather than representing broad-based participation. The VIX spike to 20.82 marks the highest level of market fear since the 2018-2019 AI panic period, indicating that options market participants anticipate continued volatility [1].
Trading volume on February 12 reached 22.45 billion shares across NYSE and NASDAQ exchanges, exceeding the 20-session average of 20.78 billion shares [0]. This elevated volume during the selloff confirms significant market participation in the downward move. The current session is showing normalized volume patterns as the market recovers, with the S&P 500 having traded approximately 26.8% of its average daily volume by mid-session.
| Indicator | Actual | Forecast | Prior | Status |
|---|---|---|---|---|
| CPI (Headline) YoY | 2.4% | 2.5% | 2.5% | Better than expected |
| CPI (Core) YoY | 2.5% | N/A | 2.6% | Better than expected |
The Consumer Price Index data released this morning showed headline inflation cooling to 2.4% year-over-year, the lowest level since May 2025 [1]. This exceeds market expectations of 2.5% and represents a significant development in the Federal Reserve’s ongoing battle against inflation. Core CPI, which excludes food and energy prices, came in at 2.5% year-over-year, also showing improvement from the prior reading of 2.6%. The better-than-expected inflation data has sparked a bond rally, with the 10-year Treasury yield falling to approximately 4.06-4.09%, down 12 basis points from previous levels [0].
| Indicator | Actual | Prior | Status |
|---|---|---|---|
| Jobless Claims (Feb 7) | 227,000 | 232,000 | Improved |
Weekly jobless claims decreased by 5,000 to 227,000 for the week ending February 7, 2026, indicating relatively stable labor market conditions [0]. This data provides additional context for the Federal Reserve’s policy deliberations, suggesting that the labor market remains resilient despite broader economic uncertainties.
The bond market rally following the CPI data release has strengthened expectations for Federal Reserve rate cuts in 2026. Market participants are now pricing in approximately 63 basis points of Fed easing for 2026, with a 50% probability of at least one rate cut by December 2026 [1]. This represents an important shift in market expectations and could provide ongoing support for rate-sensitive sectors and the broader equity market.
| Metric | Value |
|---|---|
| Intraday Open | $681.71 |
| Intraday High | $685.64 |
| Intraday Low | $677.66 |
| Current Price | $685.19 |
| Intraday Change | +0.51% |
| 20-Day High | $697.84 |
| 20-Day Low | $675.79 |
| Level Type | Price | Description |
|---|---|---|
| Intraday Resistance | $685.64 | Session high |
| 20-Day High | $697.84 | Key resistance level |
| Pivot Point | $682.85 | Mid-point balance |
| R1 (Pivot) | $688.17 | First resistance |
| S1 (Pivot) | $680.02 | First support |
| 20-Day Low | $675.79 | Strong support zone |
| Critical Support | $670.00 | Major psychological level |
| Metric | Value |
|---|---|
| Intraday Open | $600.23 |
| Intraday High | $604.92 |
| Intraday Low | $596.50 |
| Current Price | $604.42 |
| Intraday Change | +0.70% |
| 20-Day High | $636.60 |
| 20-Day Low | $594.76 |
| Level Type | Price | Description |
|---|---|---|
| Intraday Resistance | $604.92 | Session high |
| 20-Day High | $636.60 | Key resistance |
| Pivot Point | $602.05 | Mid-point balance |
| R1 (Pivot) | $607.68 | First resistance |
| S1 (Pivot) | $599.11 | First support |
| 20-Day Low | $594.76 | Strong support |
| Critical Support | $590.00 | Major psychological level |
| Indicator | SPY | QQQ | Interpretation |
|---|---|---|---|
| Intraday RSI (5-min) | 69.82 | 65.91 | SPY approaching overbought; QQQ in healthy range |
| Daily RSI (14) | 43.91 | 38.60 | Neutral to bearish; QQQ approaching oversold |
| MACD (Daily) | -1.17 | -4.20 | Bearish momentum below zero |
| Price vs SMA 20 | Below | Below | Short-term downtrend intact |
The technical analysis reveals a market in recovery mode with positive intraday momentum, though the daily downtrend remains intact [0]. Both SPY and QQQ are trading below their respective 20-day moving averages, confirming the short-term bearish trend. However, the intraday recovery has pushed prices above key pivot points, with MACD showing bullish crossover on the 5-minute timeframe.
| Company | Change | Sector | Notable Context |
|---|---|---|---|
| Cisco Systems | -12.3% | Technology | Biggest one-day selloff |
| AppLovin | -19.7% | Technology | AI-related concerns |
| Dell Technologies | -9.1% | Technology | Post-earnings decline |
| CBRE Group | -8.8% | Real Estate | Commercial real estate concerns |
| C.H. Robinson | -14.5% | Industrials | Logistics sector weakness |
| Company | Change | Sector | Notable Context |
|---|---|---|---|
| Equinix | +10.4% | Real Estate/Data Centers | AI infrastructure demand |
The February 13 trading session has exhibited several notable unusual activity patterns that merit attention from market participants.
Bitcoin fell to approximately $66,800, indicating risk-off sentiment spilling over into cryptocurrency markets [1]. Gold also dipped below $5,000 per ounce, a rare safe-haven pullback during broad risk-off conditions, underscoring the intensity of the current market correction.
With the morning economic data releases completed, the afternoon session lacks major scheduled catalysts. The CPI data has been absorbed by the market, and no Federal Reserve speakers are scheduled for February 13 [0]. Trading will likely be driven by technical factors and any breaking news related to the AI sector or broader economic developments.
| Scenario | Probability | Catalysts |
|---|---|---|
| Continued Recovery | 55% | Support holds, buying returns |
| Resistance Rejection | 30% | Selling at overhead levels |
| Breakdown | 15% | Failed support, renewed selling |
The technical outlook suggests a 55% probability of continued recovery, supported by intraday momentum and the oversold conditions in QQQ [0]. However, resistance at $688 for SPY and $608 for QQQ could trigger selling pressure. Given elevated VIX levels, traders should remain alert to potential volatility spikes in the afternoon session.
The AAII sentiment survey for the week ending February 11, 2026, showed 38.5% bulls versus 38.1% bears, indicating near-neutral sentiment [1]. However, the current market action suggests sentiment has shifted more negative following the February 12 selloff and morning session weakness. The discrepancy between the survey results (which reflect positions taken before the selloff) and current market conditions highlights the rapid nature of sentiment shifts during periods of elevated volatility.
The rotation toward defensive sectors (utilities, healthcare, consumer staples) combined with elevated VIX levels indicates that investors are adopting a more cautious stance. Several positioning dynamics warrant attention:
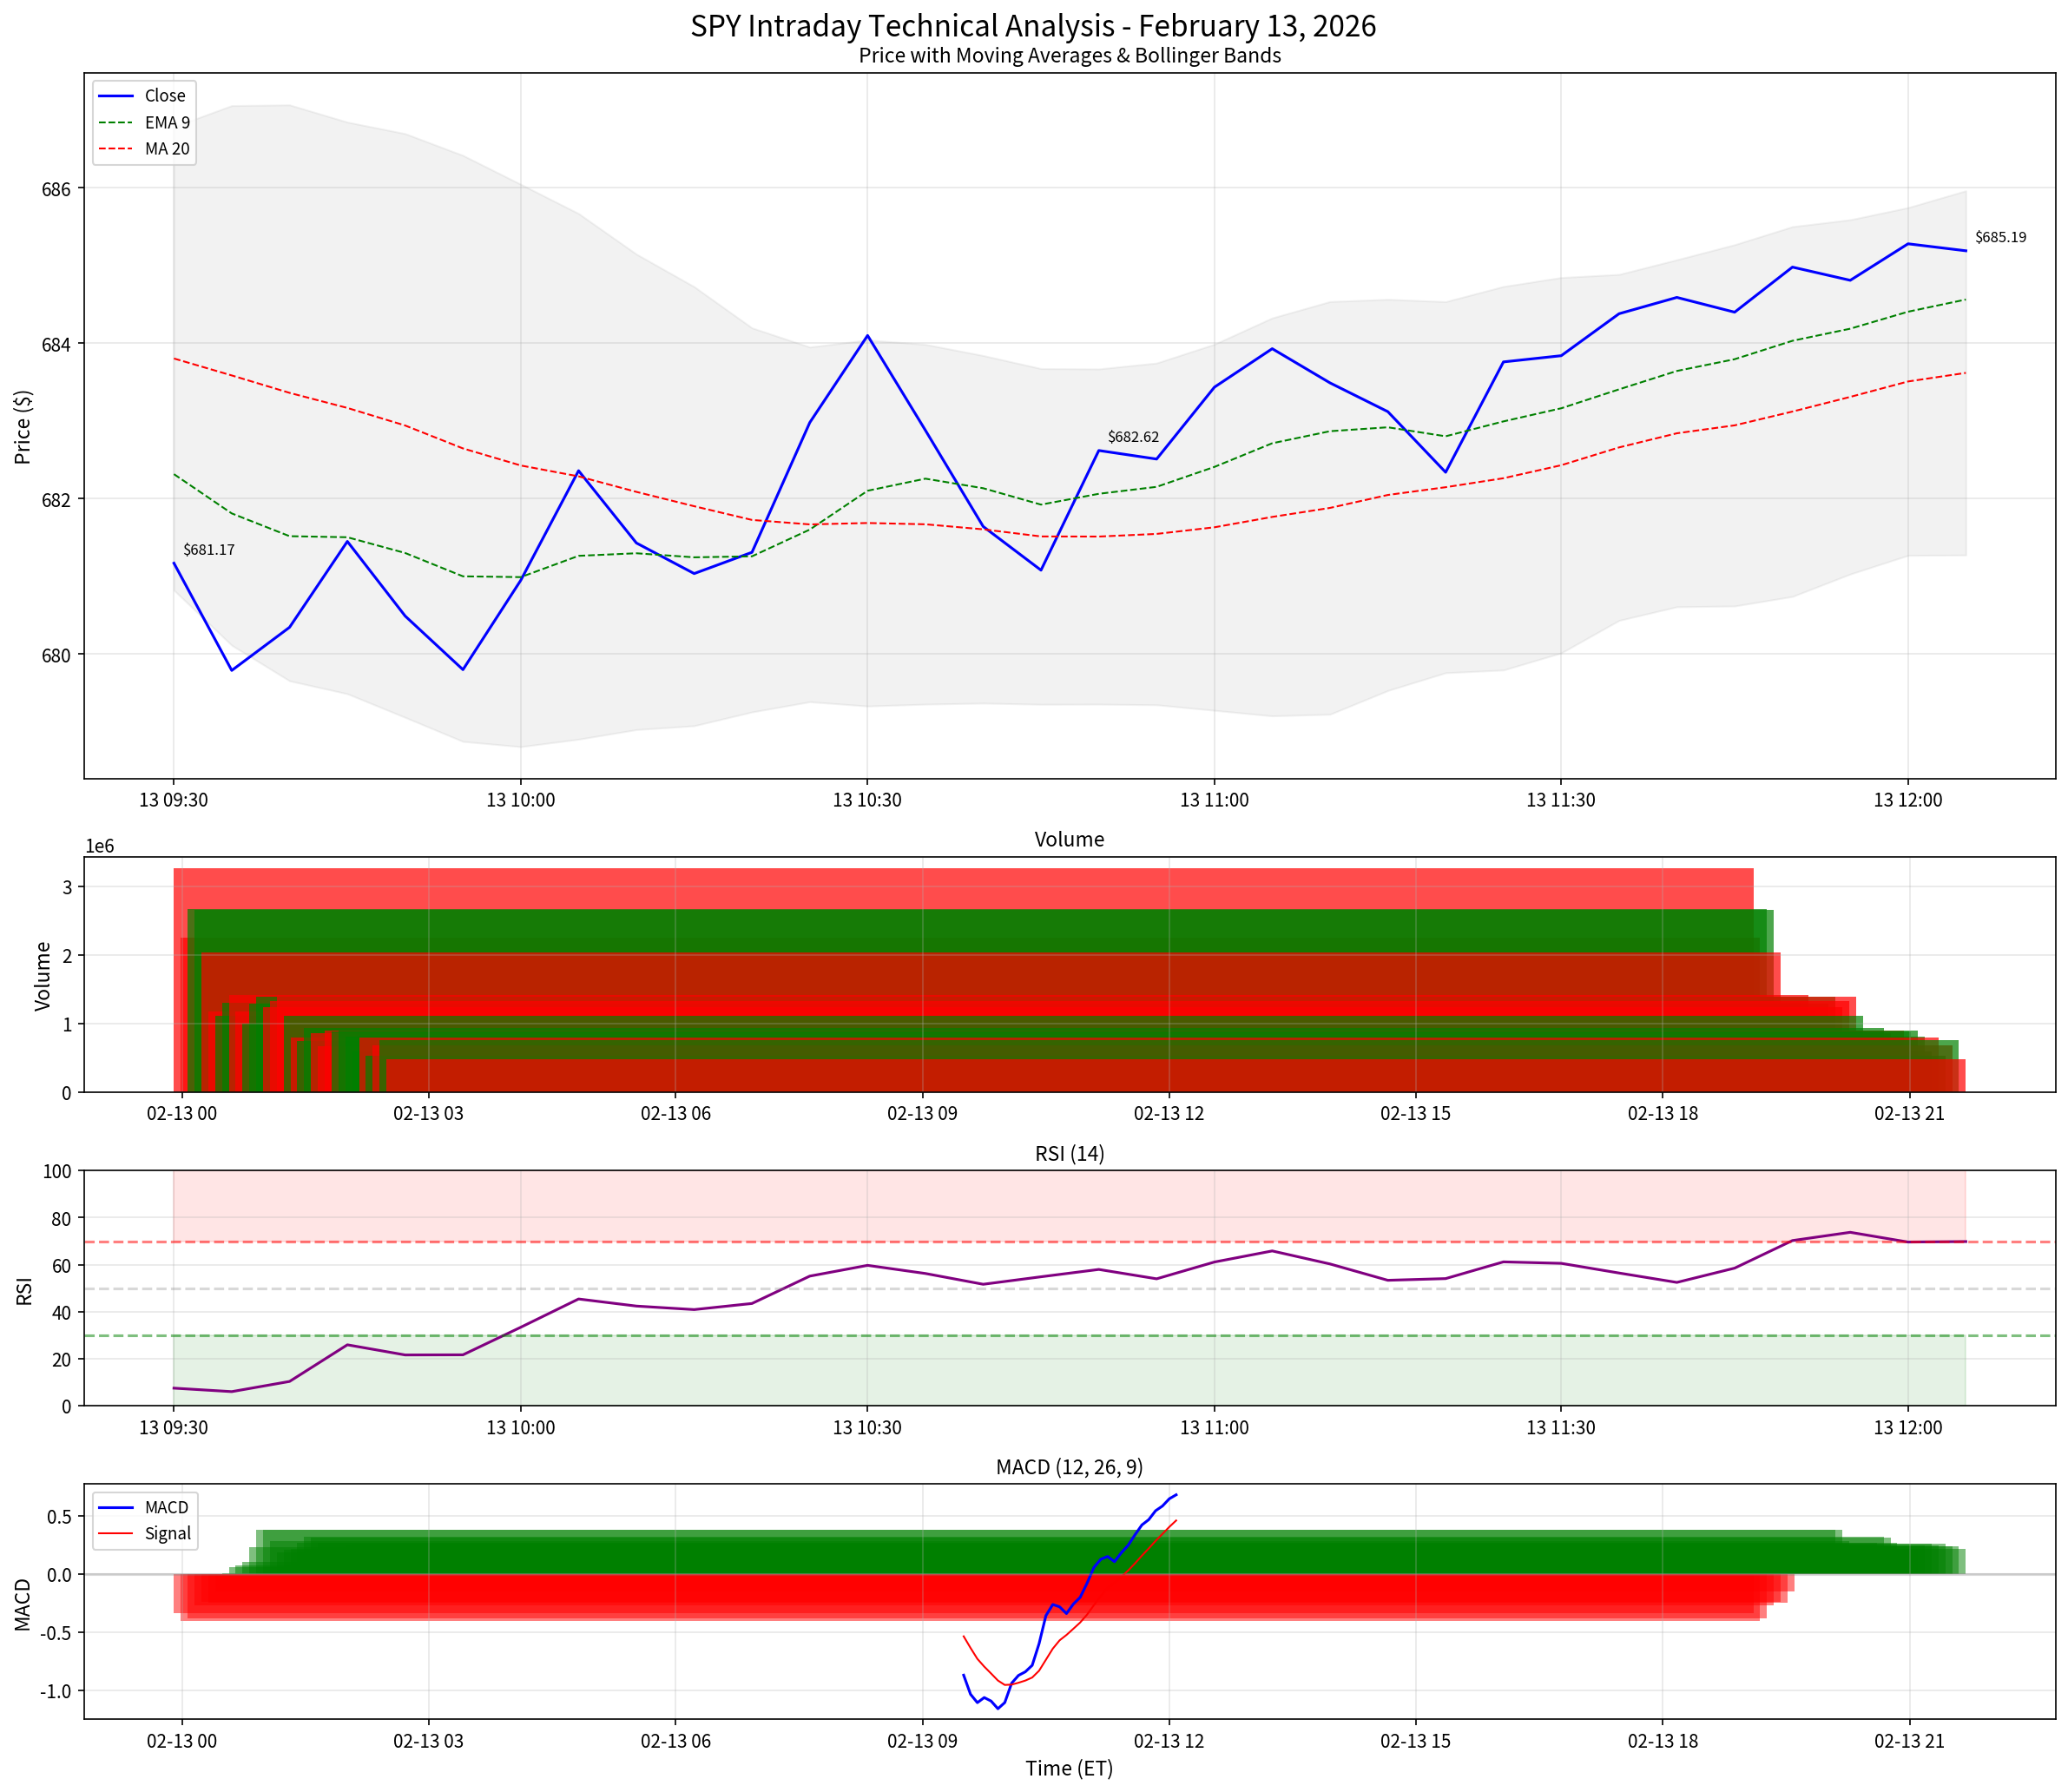
The SPY intraday chart demonstrates recovery from session lows at $677.66 to current levels around $685. The price is trading above intraday moving averages (EMA 9, MA 20), with RSI approaching overbought territory at 69.82, suggesting potential for short-term pullback.
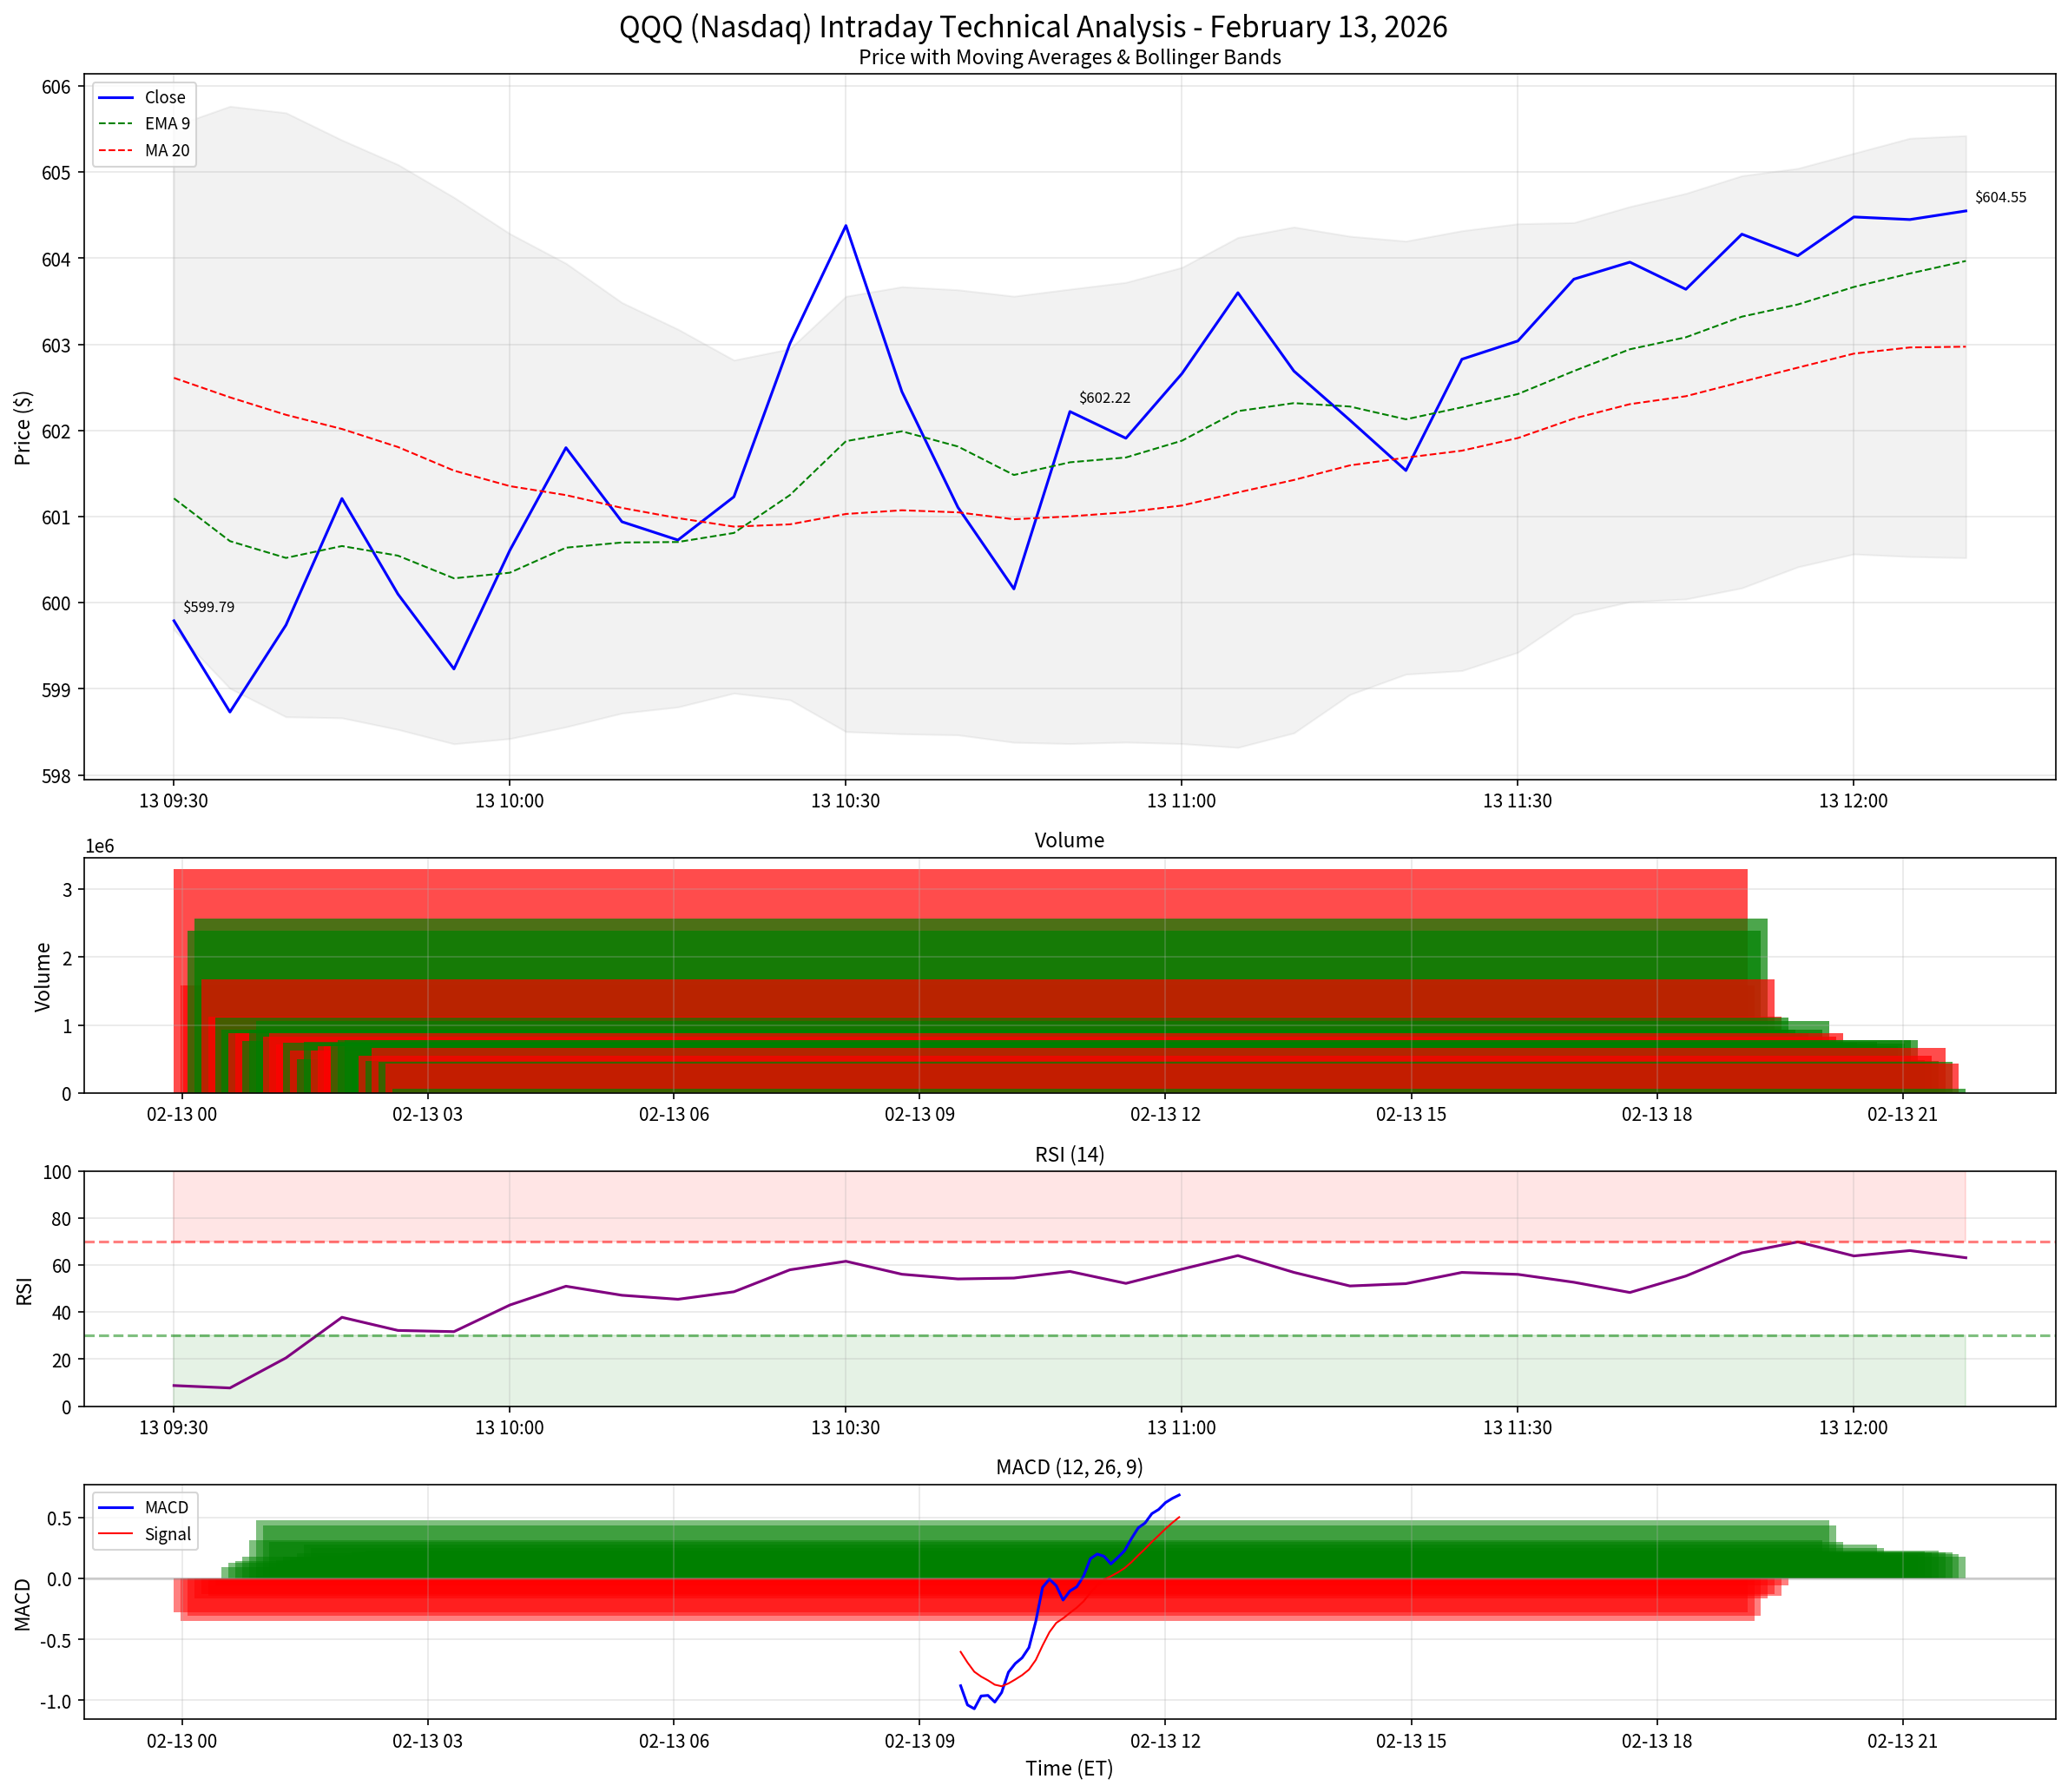
QQQ shows stronger relative performance with +0.70% gain compared to SPY’s +0.51%. The RSI at 65.91 remains in a healthier range with more room for upside before reaching overbought conditions.
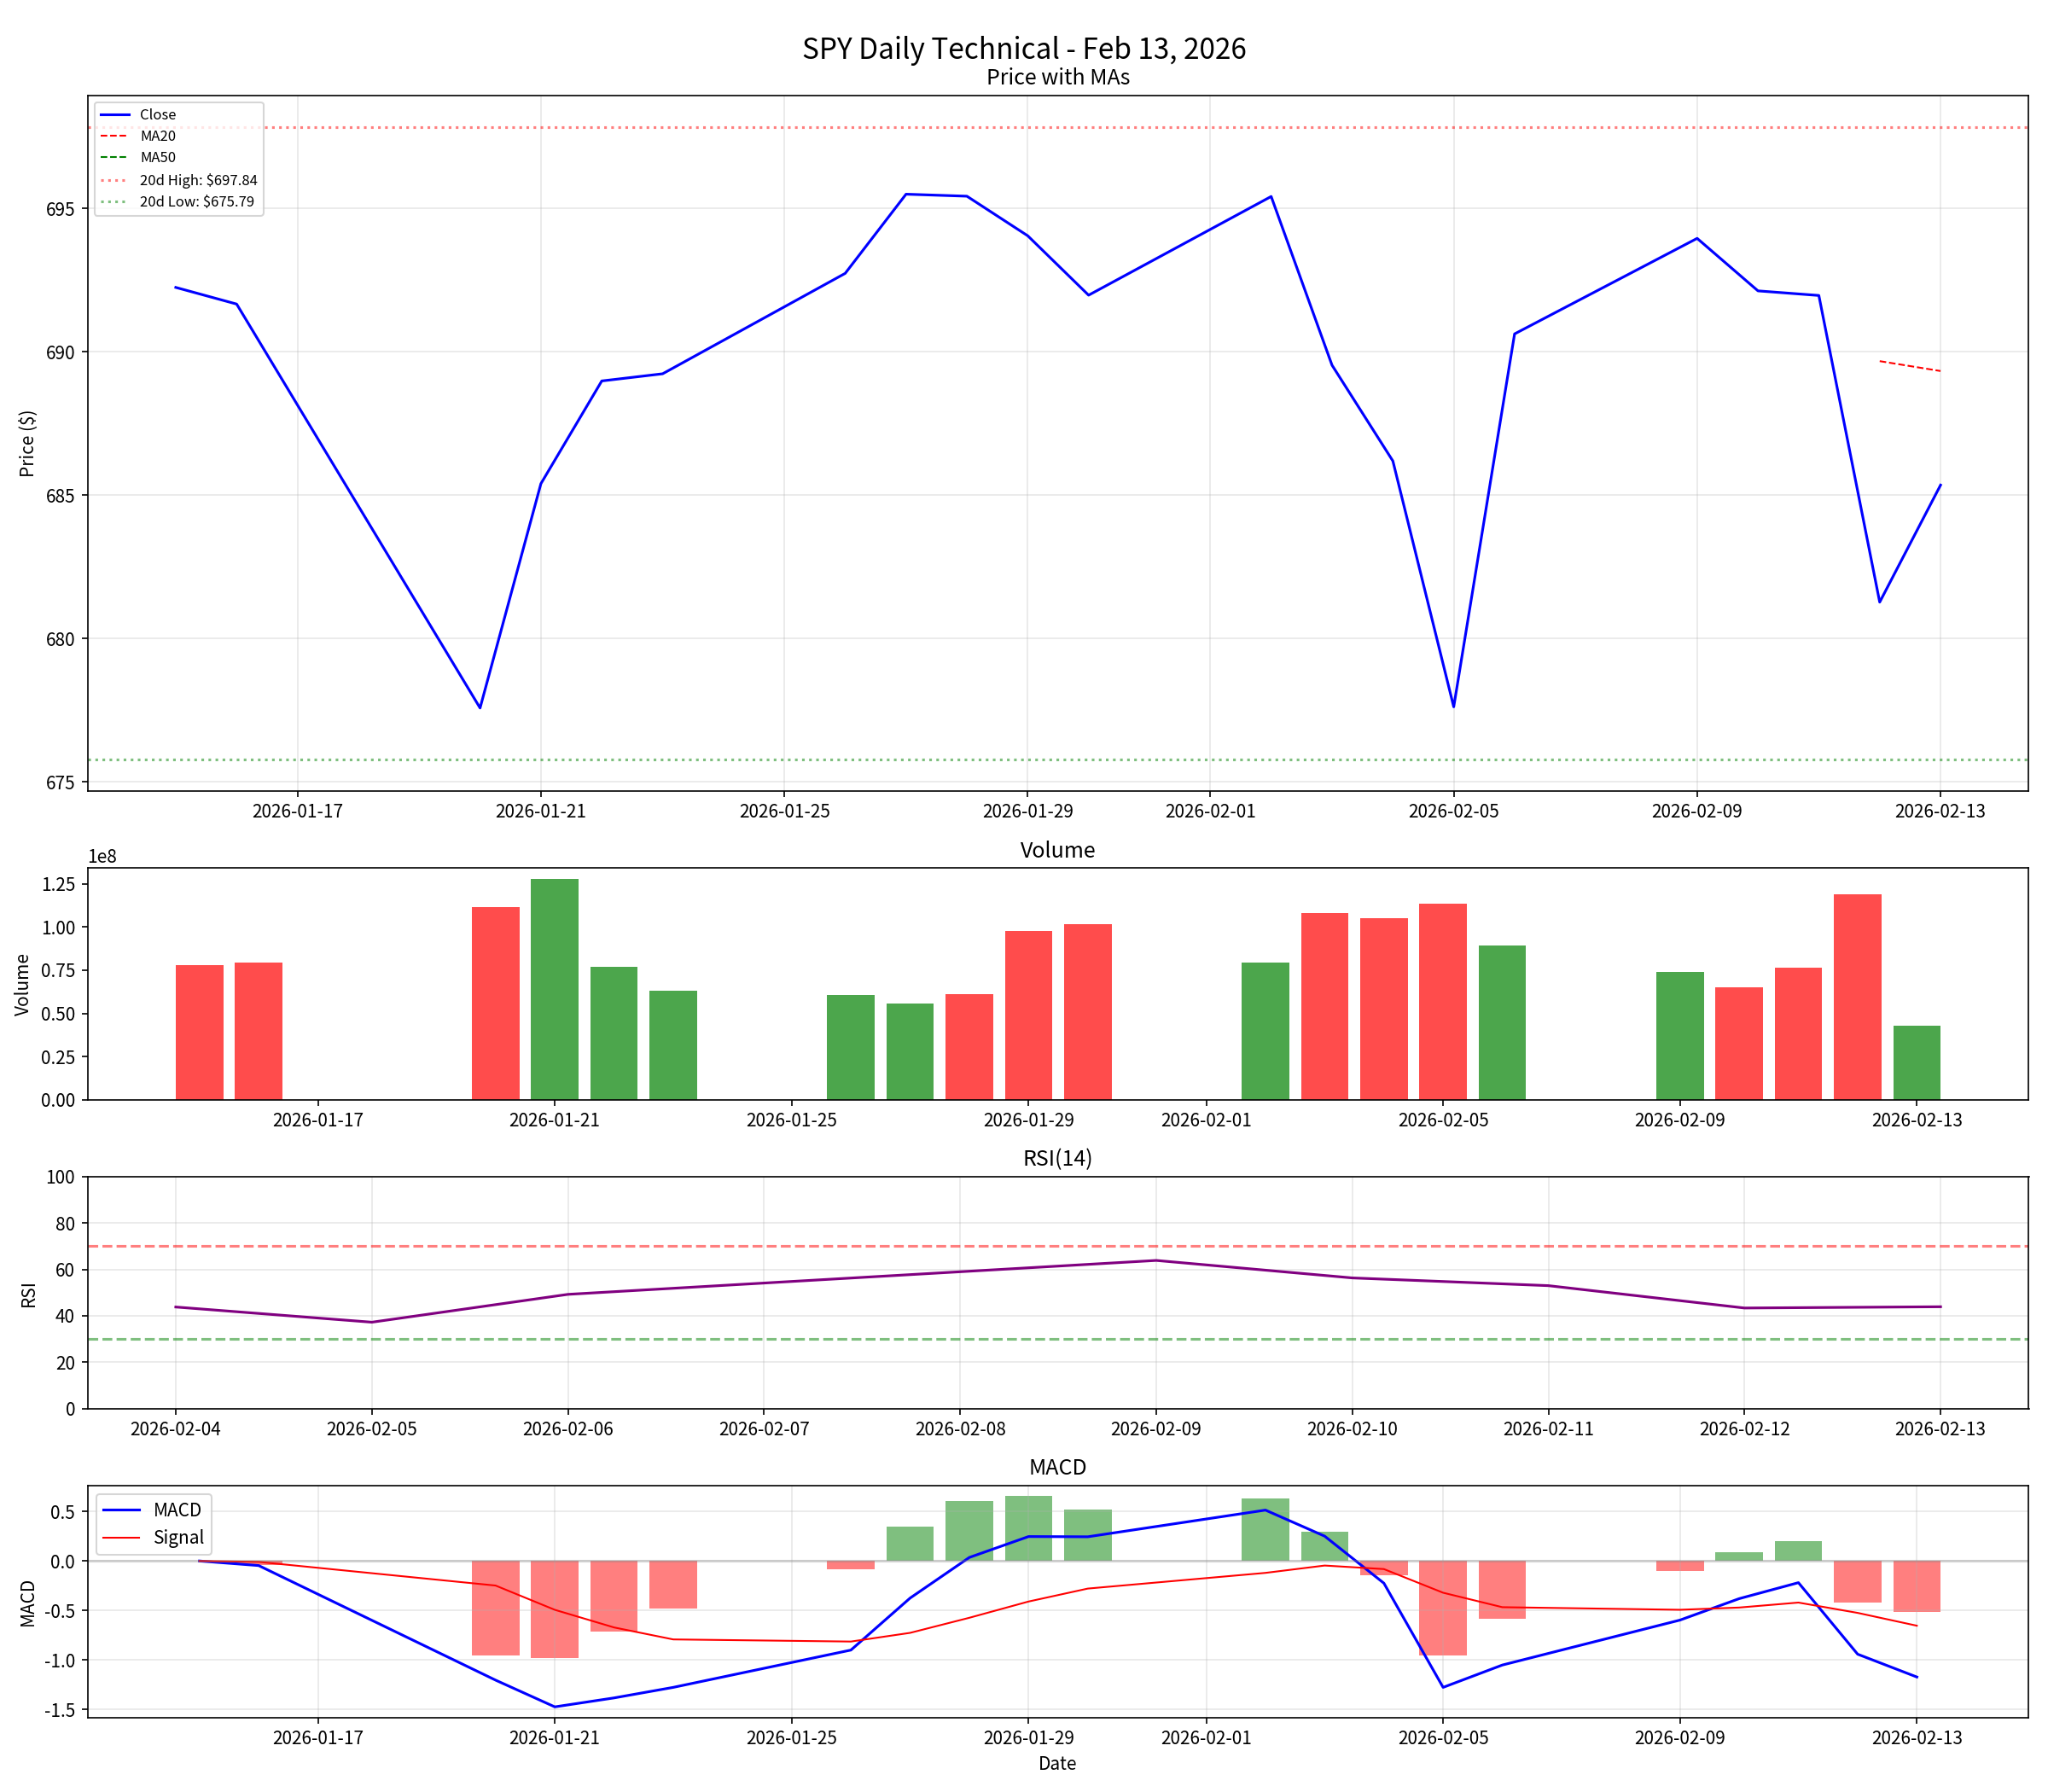
The daily chart confirms the downtrend remains intact, with price trading below the 20-day moving average. Support at $675.79 is holding so far, and the daily RSI at 43.91 remains in neutral territory.
February 13, 2026, represents a day of recovery following the significant market correction experienced on February 12. The CPI data showing inflation cooling to 2.4% year-over-year provided a supportive fundamental backdrop, sparking a bond rally and increasing expectations for Fed rate cuts. However, the market’s focus remains on AI-related sector concerns and the broader economic outlook, leading to continued rotation toward defensive sectors.
- All three major indices are trading positive intraday, with the S&P 500 leading gains at +0.61%
- Defensive sectors (utilities +3.56%, healthcare +2.25%) continue to outperform, while technology lags
- Market breadth remains weak with decliners outpacing advancers 2.17-to-1 on NYSE and 2.74-to-1 on Nasdaq
- VIX elevated at 20.82, the highest since the 2018-2019 AI panic
- CPI data exceeded expectations (2.4% vs 2.5%), supporting Fed rate cut expectations
- Technical analysis shows intraday recovery momentum but daily downtrend intact
The market is showing resilience in the face of significant selling pressure, with intraday recovery gaining momentum. However, the weak breadth indicators and elevated VIX suggest caution remains warranted. Key resistance levels to watch include $688 for SPY and $608 for QQQ. Should these levels hold as resistance, the market could see renewed selling pressure. Conversely, a break above these levels could signal a more sustainable recovery.
[0] Ginlix Quantitative Database - Market data and technical analysis
[1] Market Quick Take - 13 February 2026 - Saxo Bank
[2] Schwab Market Update - Charles Schwab
[3] Stock Market News for Feb 13, 2026 - Nasdaq
[4] Friday the 13th brings global selloff in stocks and gold as AI fear grips markets - Fortune
[5] Traders See 50% Odds of Third Fed Cut in 2026 as Inflation Ebbs - Yahoo Finance
[6] Bond Market Rallies as Cooling Inflation Data Sends 10-Year Yield Toward 4%
[7] Nasdaq down 2% as AI Worry Creates Market Selloff - FX Leaders
[8] United States Consumer Price Index (CPI) - Trading Economics
Insights are generated using AI models and historical data for informational purposes only. They do not constitute investment advice or recommendations. Past performance is not indicative of future results.
About us: Ginlix AI is the AI Investment Copilot powered by real data, bridging advanced AI with professional financial databases to provide verifiable, truth-based answers. Please use the chat box below to ask any financial question.