Ingersoll Rand (IR) Insider Selling Analysis
Unlock More Features
Login to access AI-powered analysis, deep research reports and more advanced features

About us: Ginlix AI is the AI Investment Copilot powered by real data, bridging advanced AI with professional financial databases to provide verifiable, truth-based answers. Please use the chat box below to ask any financial question.
Related Stocks
Based on my comprehensive analysis of Ingersoll Rand’s business outlook, valuation, and insider trading activity, here is my interpretation for investors:
The insider selling activity involves
- January 2026: Sale of shares worth approximately$16.8 millionat $88.12 per share [1]
- February 2026: Additional sales of approximately$461,000at $124.86 per share [1]
The transaction was executed under a
Ingersoll Rand delivered
| Metric | Result | vs. Estimate |
|---|---|---|
| EPS | $0.96 | +6.55% beat |
| Revenue | $2.09B | +2.58% beat |
| Orders | $1.95B | +8% YoY |
- 2026 Revenue Guidance: 2.5%-4.5% growth, assuming stability rather than broad market recovery [2]
- Recurring Revenue: Surpassed $450 million in 2025 with $1.1 billion backlog — demonstrating rapid expansion [2]
- M&A Pipeline: Robust with 16 deals in 2025 ($525 million invested) and 9 additional transactions under LOI entering 2026 [2]
- Segment Performance: Both ITS (Industrial Technologies & Services) and PST (Precision and Science Technologies) delivered positive organic order growth [2]
The company’s management signaled “durability in order momentum” and continues to expand recurring revenue streams, which are higher-margin and more predictable [2].
This is where the analysis becomes nuanced. The current valuation appears
| Valuation Metric | IR | Industry Benchmark |
|---|---|---|
| P/E Ratio (TTM) | 66.60x |
~20-25x for industrials |
| P/B Ratio | 3.84x |
~2-3x typical |
| DCF Base Case Fair Value | $42.65 |
-56.7% below current [0] |
The DCF analysis suggests significant downside risk:
- Conservative Scenario: $32.92 (-66.6%)
- Base Case: $42.65 (-56.7%)
- Optimistic Scenario: $63.43 (-35.6%) [0]
Meanwhile, the
-
Pre-planned 10b5-1 plan: The sale was pre-scheduled, suggesting routine portfolio diversification rather than a signal of negative sentiment [1]
-
CEO still significantly invested: As the CEO, Vicente Reynal’s personal wealth is substantially tied to IR’s performance — selling a portion does not indicate lack of confidence
-
Recent strong results: Q4 beat expectations with 10% revenue growth and 14% EPS growth [0]
-
Continued growth investments: Company is actively deploying capital into M&A and recurring revenue initiatives [2]
-
Elevated valuation: The stock trades at 66x P/E — significantly above historical norms and peers
-
Insider timing: Sales at higher prices ($88 in January, $124 in February) after the stock’s significant run-up may reflect prudent profit-taking
-
Guidance implies moderation: 2026 guidance of 2.5%-4.5% revenue growth suggests management sees headwinds, not acceleration [2]
-
DCF disconnect: The substantial gap between market price and DCF fair value suggests the stock is pricing in very optimistic assumptions
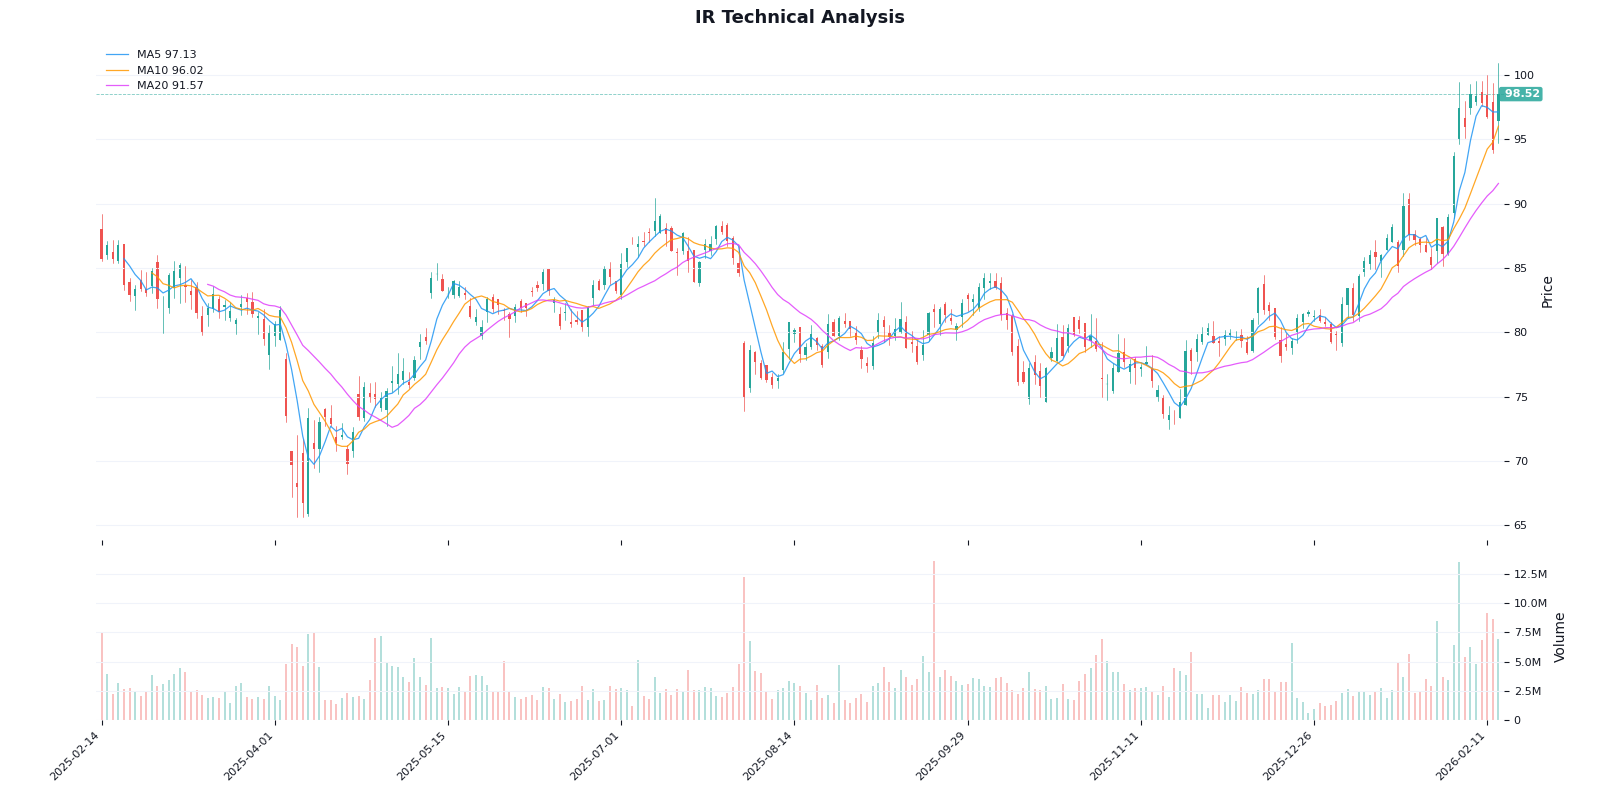
The stock is currently in a
- Support: $91.57
- Resistance: $100.13
- Beta: 1.31 (higher volatility than market) [0]
| Factor | Assessment |
|---|---|
Business Quality |
Strong — durable orders, expanding recurring revenue, active M&A |
Valuation |
Expensive — P/E 66x, DCF suggests 50%+ downside |
Insider Signal |
Neutral — pre-planned sales, but notable profit-taking at high prices |
Technical Trend |
Sideways — trading near resistance |
[0]金灵API数据
[1] InsiderScreener - Ingersoll Rand Inc Insider Trading Activity (https://www.insiderscreener.com/en/company/ingersoll-rand-inc)
[2] Seeking Alpha - Ingersoll Rand Q4 2025 Earnings Call Transcript (https://seekingalpha.com/news/4552070-ingersoll-rand-outlines-2026-revenue-growth-target-of-2_5-percentminus-4_5-percent-while)
科技股回调分析与高估值风险评估
Insights are generated using AI models and historical data for informational purposes only. They do not constitute investment advice or recommendations. Past performance is not indicative of future results.
About us: Ginlix AI is the AI Investment Copilot powered by real data, bridging advanced AI with professional financial databases to provide verifiable, truth-based answers. Please use the chat box below to ask any financial question.