Bond Market Pattern Mirrors Pre-2008 Crisis Conditions
Unlock More Features
Login to access AI-powered analysis, deep research reports and more advanced features
About us: Ginlix AI is the AI Investment Copilot powered by real data, bridging advanced AI with professional financial databases to provide verifiable, truth-based answers. Please use the chat box below to ask any financial question.
Related Stocks
This analysis examines a significant development in U.S. Treasury markets on March 19, 2026, where investors identified a pattern not observed since the months leading up to the 2008 financial crisis [1]. The specific pattern involves the 2-year Treasury yield rising above the federal funds rate—a rare occurrence that signals substantial stress in short-term funding markets.
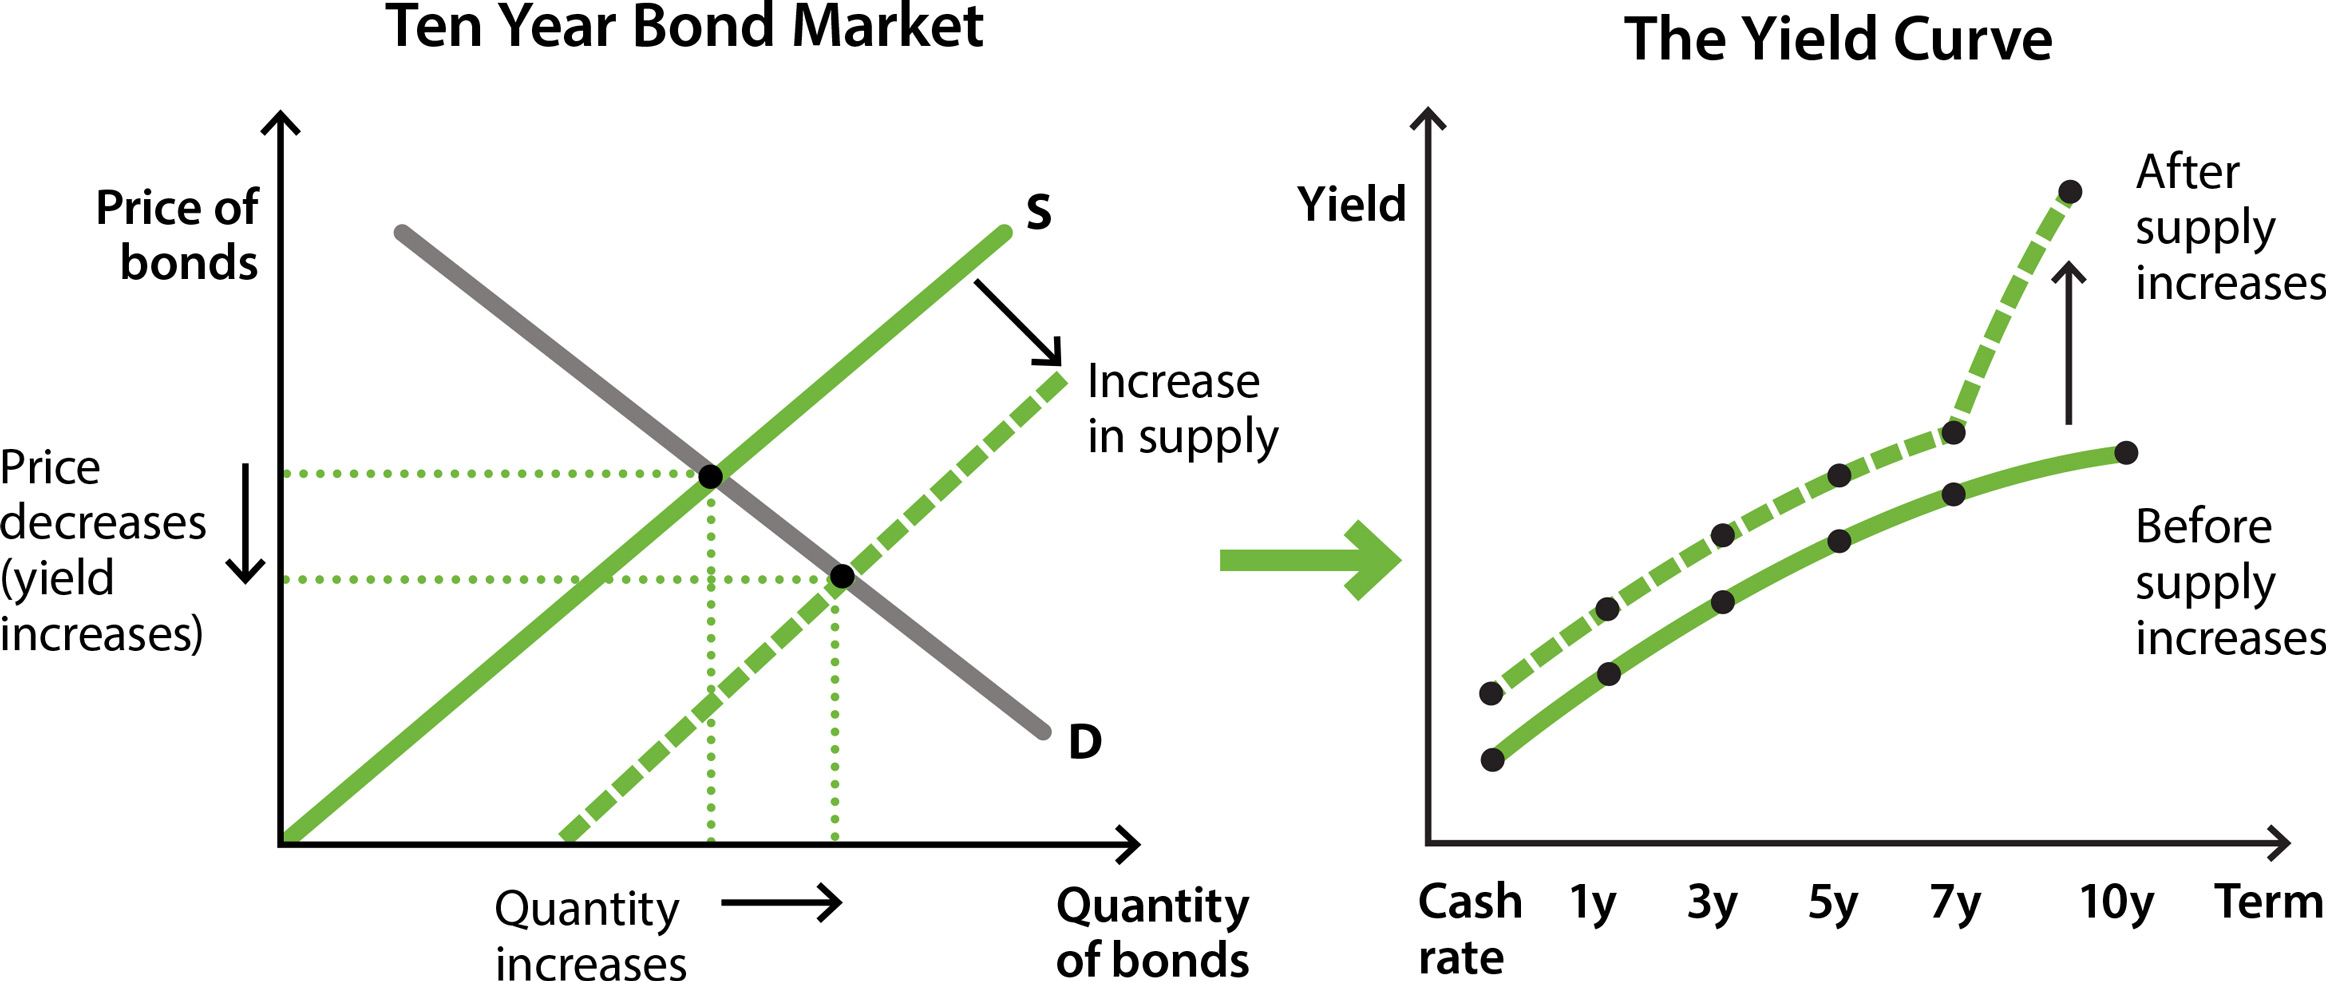
The Federal Reserve had held its benchmark interest rate steady in the 3.5%-3.75% range on March 18, 2026, with officials projecting just one quarter-point rate cut in 2026 and one in 2027 [4][5][7]. However, bond market dynamics shifted dramatically the following day, with the 2-year yield spiking to approximately 3.674%, breaching the fed funds ceiling [6]. The spread between 2-year and 10-year yields compressed by almost 8 basis points in just four minutes during what traders described as “manic minutes” featuring rapid position wash-outs [2]. The 10-year Treasury yield settled at 4.28% on March 19, 2026 [3].
While the pattern resembles conditions preceding the 2008 crisis, the underlying catalysts differ substantially. The current environment features an active U.S.-Iran conflict creating what analysts describe as “the biggest disruption to oil supply in history” [9], ongoing energy price pressures, persistently high inflation, and political uncertainty surrounding Fed leadership [8][9]. These factors combine with the technical yield curve dynamics to create a complex risk landscape.
-
Short-Term Funding Stress: The inversion at the short end indicates significant pressure in overnight lending markets, potentially foreshadowing liquidity constraints similar to those observed in 2008.
-
Yield Curve Normalization Window: Following yield curve normalization, the subsequent 0-6 month period has historically represented a “very high recession risk window” [10], suggesting elevated vulnerability in the near term.
-
Private Credit Vulnerability: Warnings from prominent economists regarding private credit market stress warrant close monitoring, as liquidity concerns could escalate to solvency concerns for non-bank lenders.
-
Energy Price Volatility: The ongoing Middle East conflict continues to create supply disruptions, adding inflationary pressure that complicates Federal Reserve policy options.
-
Market Volatility Amplification: The March 19 trading session demonstrated extreme intraday volatility with rapid position liquidations, suggesting heightened market fragility.
-
Flight to Safety: Treasury market stress typically drives demand for safer assets, potentially supporting longer-dated Treasury prices despite short-end pressures.
-
Policy Response Potential: Should economic conditions deteriorate significantly, the Federal Reserve retains capacity to adjust policy, though current projections suggest limited near-term easing.
-
Diversification Value: Portfolios with genuine diversification across asset classes may benefit from relative performance of non-correlated investments.
The bond market pattern observed on March 19, 2026, represents a technically significant development with historical precedent as a precursor to financial stress. The 2-year Treasury yield’s breach above the fed funds rate—combined with the 10-year yield at 4.28%—creates an inverted yield curve configuration at the short end that has only occurred during acute market stress periods [1][2][3].
The Federal Reserve’s March 18 decision to maintain rates at 3.5%-3.75%, with projections of minimal easing in 2026-2027, has contributed to market pricing that increasingly incorporates expectations of economic deceleration [4][5][7]. The current catalysts—geopolitical conflict, energy price shocks, and inflation persistence—differ fundamentally from the 2008 mortgage-related triggers, but the technical pattern’s warning significance remains valid [8][9].
Market participants should monitor funding spreads, credit availability in commercial paper and repo markets, and private credit sector health as indicators of whether current stress remains contained or propagates to broader financial conditions. The historical accuracy of yield curve inversions as recession predictors over 6-24 month horizons suggests elevated vigilance is warranted [10][11][12].
Insights are generated using AI models and historical data for informational purposes only. They do not constitute investment advice or recommendations. Past performance is not indicative of future results.
About us: Ginlix AI is the AI Investment Copilot powered by real data, bridging advanced AI with professional financial databases to provide verifiable, truth-based answers. Please use the chat box below to ask any financial question.