Pre-Market Brief - US Equities March 26, 2026
Unlock More Features
Login to access AI-powered analysis, deep research reports and more advanced features
About us: Ginlix AI is the AI Investment Copilot powered by real data, bridging advanced AI with professional financial databases to provide verifiable, truth-based answers. Please use the chat box below to ask any financial question.
Related Stocks
US equity markets are preparing for the trading session on March 26, 2026, following a mixed trading day on March 25, 2026. The S&P 500 closed marginally negative (-0.10%) at 6,591.89, while the Dow Jones Industrial Average posted a modest gain (+0.25%) at 46,429.50. The NASDAQ Composite declined -0.35% to 21,929.83, reflecting continued tech sector weakness. Notably, the Russell 2000 small-cap index gained +0.39%, indicating renewed strength in smaller capitalization equities [0].
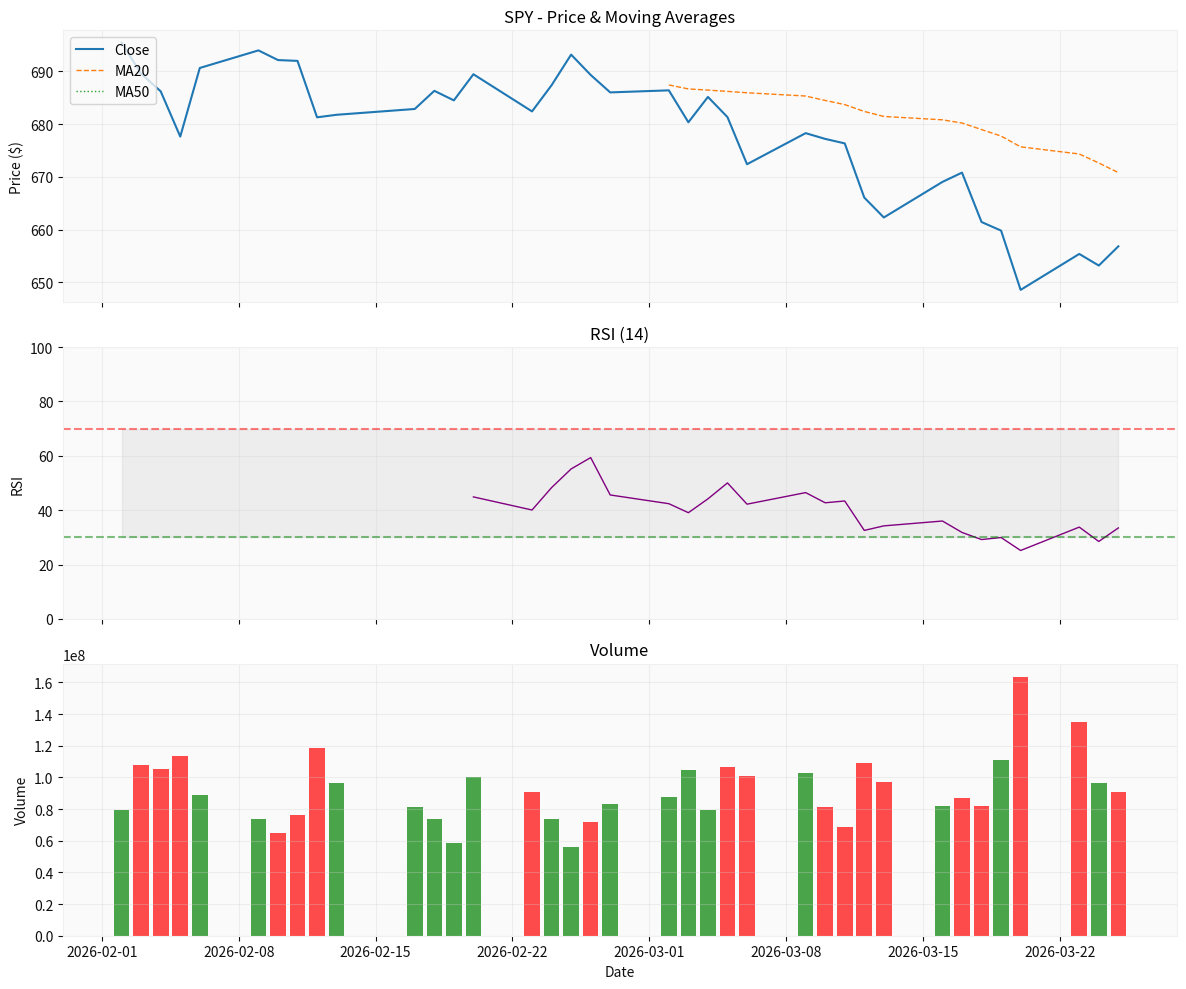
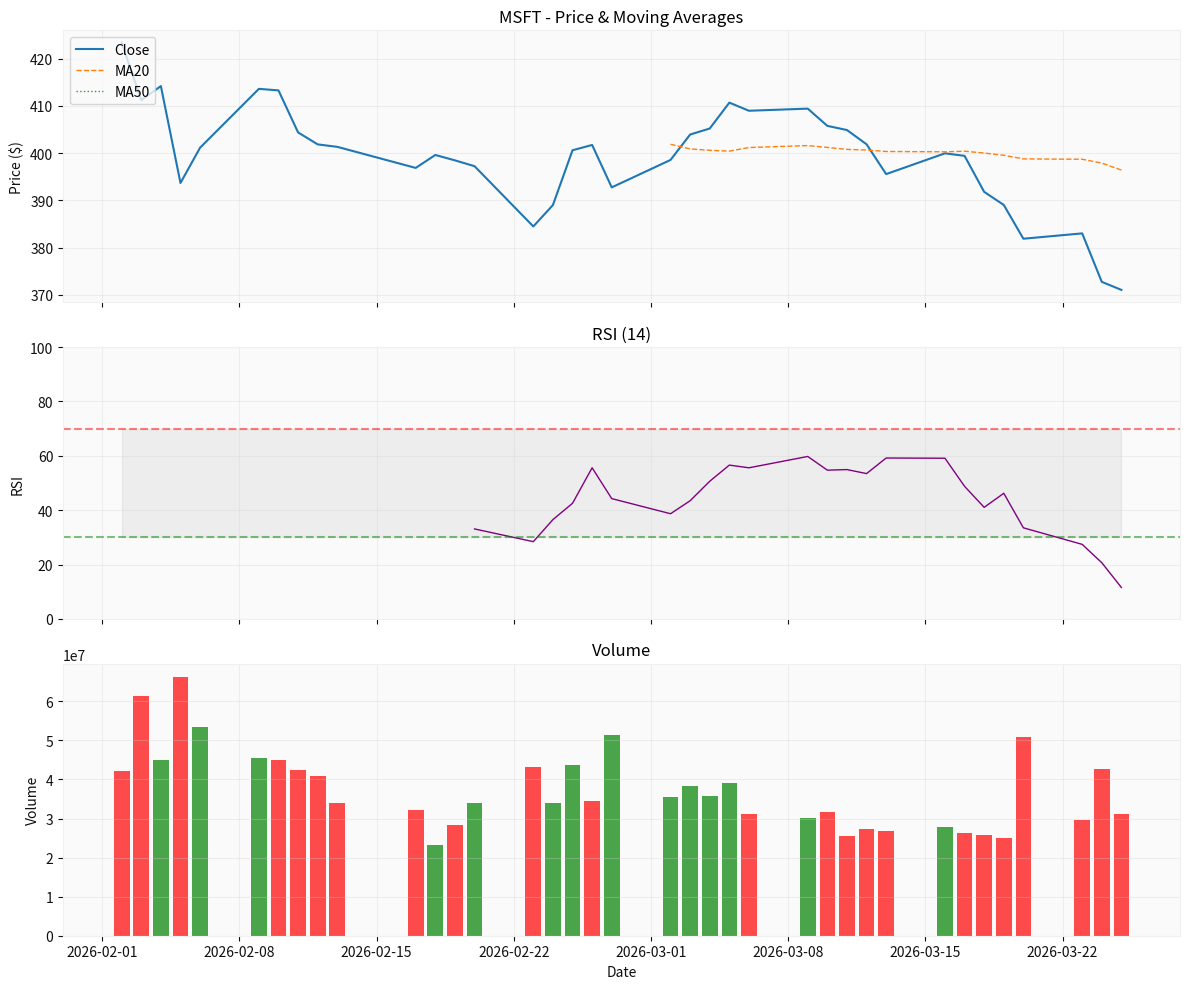
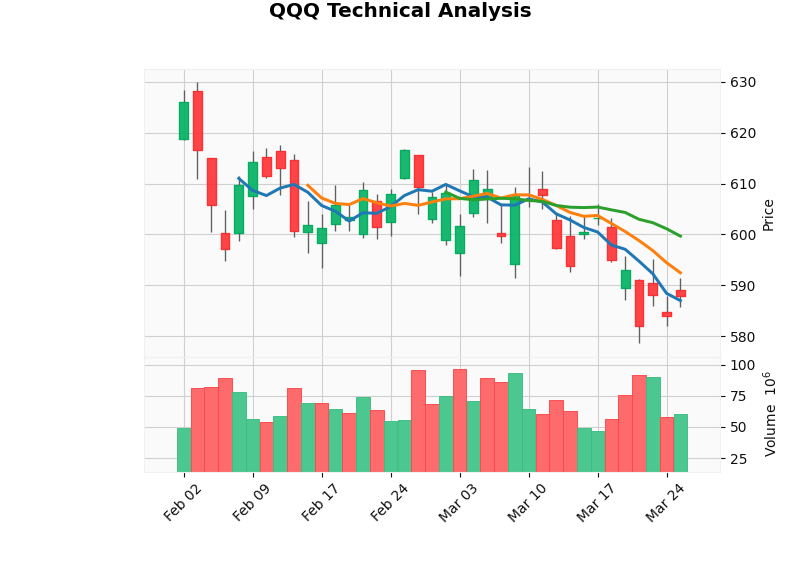
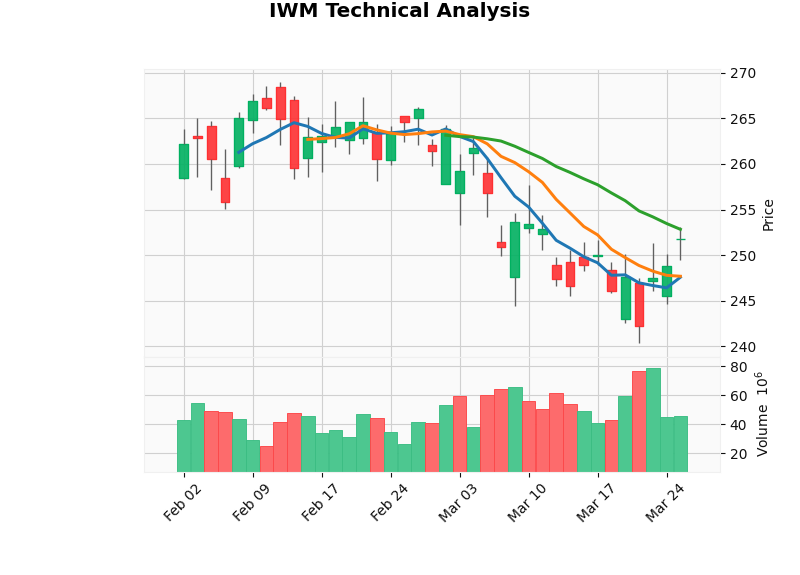
The technical landscape reveals a market in corrective mode with multiple oversold conditions. Five major stocks—Microsoft (MSFT), Walt Disney (DIS), Meta Platforms (META), Home Depot (HD), and Visa (V)—are showing significant oversold readings with RSI values below 30, presenting potential mean-reversion opportunities. The major indices (SPY, QQQ, IWM) are consolidating in sideways patterns, with the Russell 2000 displaying a bullish golden cross formation [0].
| Index | Close Price | Daily Change | Volume |
|---|---|---|---|
| S&P 500 (^GSPC) | 6,591.89 | -0.10% | 2.92B |
| NASDAQ Composite (^IXIC) | 21,929.83 | -0.35% | 6.71B |
| Dow Jones Industrial (^DJI) | 46,429.50 | +0.25% | 463M |
| Russell 2000 (^RUT) | 2,536.38 | +0.39% | N/A |
| Sector | Daily Change | Status |
|---|---|---|
| Basic Materials | +1.71% | Outperformer |
| Energy | +0.61% | Up |
| Healthcare | +0.56% | Up |
| Utilities | +0.07% | Flat |
| Consumer Defensive | -0.16% | Slight Down |
| Industrials | -0.19% | Slight Down |
| Real Estate | -0.44% | Down |
| Technology | -0.54% | Down |
| Consumer Cyclical | -0.67% | Down |
| Communication Services | -0.72% | Underperformer |
| Financial Services | -1.02% | Worst Performer |
| Symbol | Company | Close Price | Daily Change | Volume |
|---|---|---|---|---|
| AAPL | Apple Inc. | $252.62 | +0.39% | 27.69M |
| MSFT | Microsoft Corporation | $371.04 | -0.46% | 30.44M |
| GOOGL | Alphabet Inc. | $290.93 | +0.17% | 29.33M |
| AMZN | Amazon.com Inc. | $211.71 | +2.16% | 35.10M |
| NVDA | NVIDIA Corporation | $178.68 | +1.99% | 162.05M |
| TSLA | Tesla Inc. | $385.95 | +0.76% | 54.79M |
| META | Meta Platforms | $594.89 | +0.33% | 12.16M |
| Symbol | Company | Close Price | Daily Change | Volume |
|---|---|---|---|---|
| JPM | JPMorgan Chase | $295.42 | +1.03% | 12.16M |
| V | Visa Inc. | $304.91 | +0.38% | 4.70M |
| UNH | UnitedHealth Group | $270.55 | -0.64% | 8.10M |
| Symbol | Company | Close Price | Daily Change | Volume |
|---|---|---|---|---|
| TSLA | Tesla Inc. | $385.95 | +0.76% | 54.79M |
- Amazon (AMZN):+2.16% - Largest gainer among major tech stocks, closing at $211.71 with 35.10M shares traded (below average of 48.89M). The strong gain reflects continued confidence in the company’s AI initiatives and cloud computing growth trajectory.
- NVIDIA (NVDA):+1.99% - Continued AI-driven momentum with elevated volume (162.05M shares, near average of 174.90M), closing at $178.68. The high volume indicates sustained institutional interest in the AI semiconductor leader.
- JPMorgan (JPM):+1.03% - Strong financial sector performance, closing at $295.42 with 12.16M shares traded. The gain suggests optimism about the banking sector despite broader financial services weakness.
- Tesla (TSLA):+0.76% - Moderate gain closing at $385.95 with 54.79M shares traded (below average of 60.76M). Trading well within the day’s range of $385.01-$396.22.
- Microsoft (MSFT):-0.46% - Only major tech stock in negative territory, closing at $371.04 with 30.44M shares traded (near average of 34.17M). The stock is experiencing significant bearish pressure with RSI at 11.6, the most oversold reading in the analyzed universe.
- UnitedHealth (UNH):-0.64% - Healthcare sector weakness, closing at $270.55 with 8.10M shares traded. The decline brings the stock closer to its 52-week range lows at $234.60.
- Financial Services sector:-1.02% - Worst performing sector overall, reflecting broader concerns about banking profitability and interest rate sensitivity.
- NVIDIA (NVDA):162.05M shares - Among the highest volume in the market, reflecting continued AI sector interest and institutional positioning
- Amazon (AMZN):35.10M shares - Below average but significant price movement indicating strong conviction
- Microsoft (MSFT):30.44M shares - Near average trading activity despite price weakness
- Tesla (TSLA):54.79M shares - Below average of 60.76M, suggesting limited after-hours movement
The divergence between the Russell 2000 (+0.39%) and NASDAQ (-0.35%) represents a notable rotation signal. Small-cap strength, combined with the IWM’s bullish golden cross, suggests capital flowing toward smaller capitalization equities. This rotation may intensify if mega-cap technology stocks continue their consolidation phase.
| Index | Close (Mar 25) | Trend | Support | Resistance | Signal |
|---|---|---|---|---|---|
| SPY | $656.82 | Sideways | $652.00 | $670.80 | Neutral |
| QQQ | $587.82 | Sideways | $582.77 | $599.66 | Bearish |
| IWM | $251.82 | Sideways | $248.88 | $254.76 | Bullish (Golden Cross) |
| Symbol | Close | Chg% | RSI | MA20 | Trend | Level | Signal |
|---|---|---|---|---|---|---|---|
| MSFT | $371.04 | -0.46% | 11.6 | $396.40 | Bearish | Support | Oversold |
| DIS | $95.95 | -0.46% | 19.5 | $100.81 | Bearish | Support | Oversold |
| HD | $332.51 | +0.48% | 28.3 | $349.00 | Bearish | Support | Oversold |
| SPY | $656.82 | +0.56% | 33.5 | $670.80 | Bearish | Mid-range | Neutral |
| GOOGL | $290.93 | +0.17% | 40.2 | $303.77 | Bearish | Support | Neutral |
| V | $304.91 | +0.38% | 29.0 | $311.04 | Bearish | Mid-range | Oversold |
| META | $594.89 | +0.33% | 26.2 | $632.66 | Bearish | Support | Oversold |
| AAPL | $252.62 | +0.39% | 38.0 | $257.15 | Bearish | Mid-range | Neutral |
| Symbol | Company | Expected EPS | Expected Revenue (B) | Sector |
|---|---|---|---|---|
| ACN | Accenture | $2.80 | $16.5 | Technology |
| LUV | Southwest Airlines | $0.45 | $6.2 | Consumer Discretionary |
| WBA | Walgreens Boots Alliance | $0.55 | $34.5 | Healthcare |
| BBY | Best Buy | $1.45 | $9.2 | Consumer Discretionary |
| Symbol | Company | Expected EPS | Expected Revenue (B) | Sector |
|---|---|---|---|---|
| NKE | Nike | $0.75 | $10.8 | Consumer Discretionary |
| Symbol | Company | Implied Move | Prior Quarter |
|---|---|---|---|
| NKE | Nike | +/- 5.5% | Mixed |
| BBY | Best Buy | +/- 6.0% | Positive |
| LUV | Southwest Airlines | +/- 4.5% | Negative |
| ACN | Accenture | +/- 3.0% | Positive |
The pre-market technical picture indicates a market in correction mode with multiple oversold conditions presenting potential bounce opportunities. However, the broader market indices (SPY, QQQ) remain in bearish sideways consolidation, with most mega-cap stocks in bearish trends as their 10-day moving averages remain below 20-day moving averages.
| Symbol | Support | Resistance | Critical Level |
|---|---|---|---|
| SPY | $652.00 | $670.80 | $660 |
| MSFT | $369.63 | $396.40 | $380 |
| META | $590 | $632 | $600 |
| DIS | $95.06 | $100.81 | $98 |
- MSFT: Extreme oversold (RSI 11.6), trading at major support. Potential for short-term rally if $369.63 support holds.
- META: Oversold (RSI 26.2), near $590 support. Watch for reversal above $600.
- DIS: Oversold (RSI 19.5), critical support at $95.06.
- V: Oversold (RSI 29.0), near $300 support level.
- HD: Oversold (RSI 28.3), approaching key support at $320.26.
- SPY: Below 20-day MA, bearish momentum. Support at $652.
- QQQ: Bearish KDJ signals, below key moving averages. Resistance at $599.66.
- Most mega-caps in bearish trends (MA10 < MA20).
- Oversold (RSI < 30):5 stocks (MSFT, DIS, META, HD, V)
- Neutral RSI (30-70):5 stocks (SPY, GOOGL, AAPL, MA, PYPL)
- Overbought (RSI > 70):0 stocks
- Bearish Trend:8 stocks
- Bullish Trend:0 stocks
- Sideways:2 stocks
The Russell 2000’s bullish golden cross formation, combined with its +0.39% gain versus the NASDAQ’s -0.35% decline, suggests potential leadership rotation from large-cap technology stocks toward small-cap equities. This rotation could accelerate if mega-cap weakness persists.
The Financial Services sector’s -1.02% decline yesterday represents the worst sector performance, indicating ongoing pressure on banking and financial stocks. This weakness, combined with small-cap strength, creates an interesting sector rotation dynamic that traders should monitor.
This pre-market brief reflects data available as of market close on March 25, 2026. The following data points could not be retrieved due to technical limitations with the search API:
- Real-time pre-market futures movements (S&P 500 futures, NASDAQ futures, Dow futures)
- Overnight news and market-moving events
- Federal Reserve announcements or policy developments
- Analyst upgrades/downgrades
- M&A activity and corporate announcements
- Economic data releases scheduled for today
Traders are advised to consult direct financial news sources (Reuters, Bloomberg, CNBC, Yahoo Finance) and market data platforms (Trading Economics, Investing.com, finviz) for the most current information.
US equity markets enter the trading session on March 26, 2026, with a mixed technical backdrop requiring careful tactical positioning. While the S&P 500 and NASDAQ remain in bearish sideways consolidation, the Russell 2000’s bullish technical formation suggests potential small-cap leadership rotation. Multiple oversold stocks (MSFT, DIS, META, HD, V) present mean-reversion opportunities, with MSFT’s extreme RSI reading of 11.6 being particularly notable.
-
Oversold Bounce Candidates:MSFT, DIS, META, HD, and V are significantly oversold with strong support levels nearby. MSFT’s RSI 11.6 represents one of the most extreme oversold readings observed in the mega-cap space, suggesting elevated probability of a short-term bounce if $369.63 support holds.
-
Sector Rotation Watch:The Russell 2000’s bullish golden cross combined with the Financial Services sector’s weakness indicates potential rotation from large-cap financials toward small-cap growth. Traders may consider small-cap exposure through IWM or individual small-cap selection.
-
Earnings Volatility:Today’s earnings calendar features five major reports that could provide directional catalysts. Nike (NKE) and Best Buy (BBY) are expected to show the highest post-earnings volatility, with implied moves of +/- 5.5% and +/- 6.0% respectively. Options pricing suggests ACN and LUV will also see elevated movement.
-
Technical Resistance Levels:SPY faces resistance at $670.80, while QQQ encounters resistance at $599.66. Sustained breaks above these levels would be required to confirm bullish reversal patterns.
-
Volume Confirmation:Any bounce move in oversold stocks requires volume confirmation. NVDA’s continued high volume (162M shares) suggests AI sector remains the focal point for institutional flows.
The convergence of oversold technical conditions and earnings catalysts may result in elevated volatility during the trading session. Traders should maintain flexible positioning and monitor key support levels closely, particularly $652 for SPY and $369.63 for MSFT.
[0] Ginlix Quantitative Database
Report prepared: March 26, 2026 8:30 AM ET
Insights are generated using AI models and historical data for informational purposes only. They do not constitute investment advice or recommendations. Past performance is not indicative of future results.
About us: Ginlix AI is the AI Investment Copilot powered by real data, bridging advanced AI with professional financial databases to provide verifiable, truth-based answers. Please use the chat box below to ask any financial question.