US Market Mid-Session Analysis - March 26, 2026
Unlock More Features
Login to access AI-powered analysis, deep research reports and more advanced features
About us: Ginlix AI is the AI Investment Copilot powered by real data, bridging advanced AI with professional financial databases to provide verifiable, truth-based answers. Please use the chat box below to ask any financial question.
Related Stocks
The US equity market is experiencing a modestly negative mid-session on March 26, 2026, with major indices trading slightly lower amid cautious investor sentiment. The S&P 500 and Dow Jones are both down approximately 0.25%, while the Nasdaq remains essentially flat. Defensive sectors are outperforming relative to growth sectors, signaling a clear risk-off rotation in the morning session. Technical indicators show both SPY and QQQ trading near critical support levels, with momentum remaining bearish but approaching oversold territory. The VIX volatility index remains elevated at 26.85, indicating persistent market uncertainty despite the orderly nature of today’s trading.
| Index | Close | Change | Open | High | Low | Volume |
|---|---|---|---|---|---|---|
S&P 500 |
6,540.40 | -0.24% | 6,555.86 | 6,573.22 | 6,533.11 | 987.81M |
NASDAQ Composite |
21,693.09 | -0.00% | 21,693.17 | 21,823.58 | 21,653.98 | 2.97B |
Dow Jones Industrial |
46,226.52 | -0.25% | 46,344.64 | 46,547.59 | 46,158.37 | 181.66M |
Russell 2000 |
2,519.83 | +0.11% | 2,517.01 | 2,534.64 | 2,508.72 | — |
The morning session reveals a market in consolidation mode, with all major indices showing modest declines except for the small-cap Russell 2000, which is the sole gainer among major indices. The S&P 500 is trading near session lows, reflecting slight weakness across the broad market. The Nasdaq demonstrates notable resilience, essentially unchanged despite significant weakness in the technology sector. The Dow Jones Industrial Average leads the declines among the major indices, down approximately 116 points from the previous close. The Russell 2000’s positive performance (+0.11%) indicates capital rotating into smaller-cap value segments, a notable divergence from the larger indices.
| Rank | Sector | Change | ETF | Status |
|---|---|---|---|---|
| 1 | Healthcare | +1.08% | XLV | Strong Outperformer |
| 2 | Real Estate | +0.89% | XLRE | Outperformer |
| 3 | Financial Services | +0.76% | XLF | Outperformer |
| Rank | Sector | Change | ETF | Status |
|---|---|---|---|---|
| 1 | Utilities | -2.06% | XLU | Strong Underperformer |
| 2 | Communication Services | -1.72% | XLC | Underperformer |
| 3 | Technology | -0.38% | XLK | Slight Weakness |
The morning session sector performance reveals a classic risk-off rotation pattern. Healthcare leads with strong gains of +1.08%, likely driven by sector-specific catalysts and investors seeking defensive exposure. Real Estate benefits from yield-sensitive buying as bond yields stabilize, with the sector adding +0.89%. Financial Services shows moderate strength on banking sector optimism, gaining +0.76%. Conversely, Utilities experiences significant weakness at -2.06%, an unusual development given its defensive nature, possibly reflecting profit-taking after recent gains or shifting yield dynamics. Communication Services is dragged down by major platform companies, declining -1.72%. Technology shows only modest weakness at -0.38% despite being the growth sector most sensitive to interest rate concerns.
| Sector | ETF | Change | vs. Yesterday |
|---|---|---|---|
| Materials | XLB | +0.78% | +0.84% |
| Healthcare | XLV | +0.50% | +0.38% |
| Real Estate | XLRE | +0.61% | -0.47% |
| Consumer Staples | XLP | +0.16% | +0.10% |
| Financials | XLF | +0.08% | -0.50% |
| Utilities | XLU | -0.07% | -0.59% |
| Technology | XLK | -0.36% | -0.39% |
| Industrials | XLI | -0.51% | -0.46% |
| Communication Services | XLC | -0.90% | -0.39% |
The rotation from growth to defensive sectors suggests investors are adopting a more cautious posture, preferring established income-generating sectors over high-growth technology names. This rotation pattern is consistent with the elevated VIX readings and below-average volume, indicating a orderly repositioning rather than panic selling. Notably, Financials showed improvement from yesterday’s decline (+0.08% vs -0.50%), suggesting some stabilization in the banking sector.
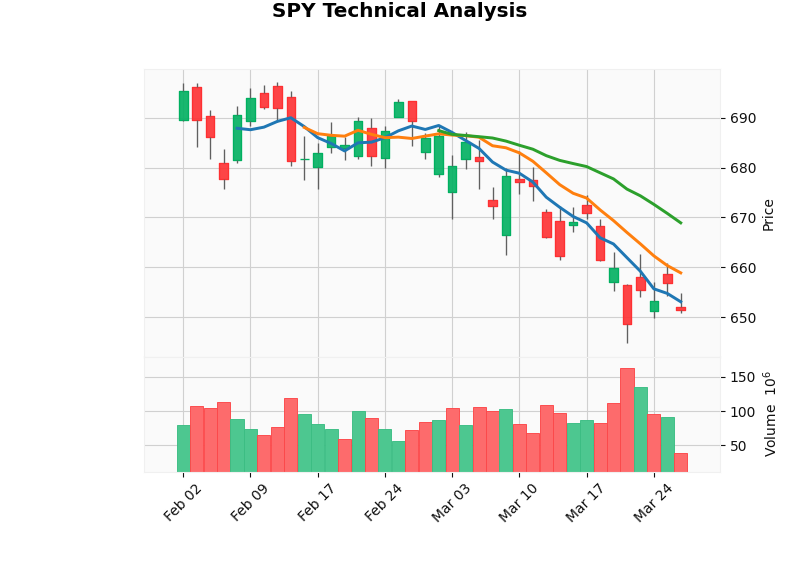
| Indicator | Value | Signal | Interpretation |
|---|---|---|---|
Current Price |
$651.44 | — | Trading near lower end of range |
RSI (14) |
35.2 | Oversold | Approaching oversold territory |
MACD |
-7.89 | Bearish | Negative momentum continues |
MACD Histogram |
-1.72 | Bearish | Momentum widening on downside |
20-Day SMA |
$668.90 | Resistance | Price well below average |
Support |
$646.75 | Critical | 20-day low; immediate support |
Resistance |
$668.90 | Key Level | 20-day high; overhead obstacle |
Bollinger Lower |
$644.38 | Technical Floor | Technical support zone |
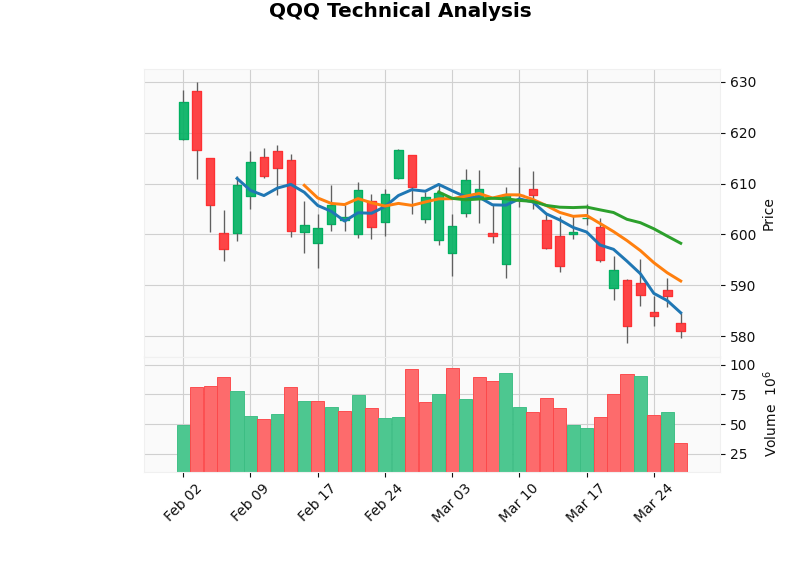
| Indicator | Value | Signal | Interpretation |
|---|---|---|---|
Current Price |
$581.03 | — | Near lower support |
RSI (14) |
37.3 | Approaching Oversold | Approaching oversold levels |
MACD |
-5.23 | Bearish | Negative momentum |
MACD Histogram |
-2.11 | Bearish | Strengthening bearish momentum |
20-Day SMA |
$598.25 | Resistance | Price significantly below average |
Support |
$576.05 | Critical | 20-day low; must hold |
Resistance |
$598.25 | Key Level | 20-day high |
Both SPY and QQQ are trading within defined sideways channels, with prices positioned near the lower boundary of their respective ranges. The current technical setup suggests vulnerability if selling pressure intensifies, with SPY needing to hold the $646.75 support level and QQQ needing to maintain the $576.05 floor. The MACD remains bearish on both indices with negative histogram values, indicating sellers maintain control of the short-term momentum. However, RSI readings at 35.2 (SPY) and 37.3 (QQQ) are approaching oversold territory, which historically has provided short-term bounce opportunities. The KDJ indicator on SPY shows a slight bullish crossover (K:27.0, D:25.5, J:30.0), suggesting potential short-term divergence, while QQQ’s KDJ remains bearish (K:21.0, D:25.7, J:11.7).
| Metric | SPY | QQQ |
|---|---|---|
Current Price |
$651.44 | $581.03 |
Intraday Change |
-0.10% | -0.27% |
5-Day Return |
-1.27% | — |
20-Day Return |
-5.49% | -5.32% |
YTD Return |
-5.51% | — |
The 20-day return figures of approximately -5.5% for SPY and -5.3% for QQQ confirm the correction phase, with both indices now trading significantly below their 20-day moving averages. The Bollinger Band analysis shows SPY trading between the lower band at $644.38 and upper band at $693.43, while QQQ trades between $578.80 (lower) and $617.71 (upper), suggesting both instruments are positioned near their technical floors.
| Metric | Value | Interpretation |
|---|---|---|
Current Level |
26.85 | Elevated fear |
Daily Change |
+1.36% | Slight increase |
20-Day Range |
20.28 - 31.04 | Elevated volatility |
Comfort Zone |
Below 20 | Currently elevated |
Fear Threshold |
Above 25 | In cautious territory |
| Indicator | Current Reading | Signal |
|---|---|---|
VIX |
26.85 | Elevated fear, above comfort threshold |
SPY RSI |
35.2 | Approaching oversold |
QQQ RSI |
37.3 | Approaching oversold |
MACD |
Bearish | Downside momentum |
Market Trend |
Sideways | Consolidation phase |
Sector Leadership |
Defensive | Risk-off rotation active |
The VIX at 26.85 indicates elevated but not extreme fear among market participants. This level remains above the comfort threshold of 20, suggesting persistent uncertainty about the market direction. Notably, current VIX levels are below the recent spike high of 31.04 observed on March 23, indicating some calm has returned to the market following the earlier volatility spike. The VIX above 25 typically coincides with increased put buying and risk aversion among options market participants. The combination of defensive sector leadership, elevated VIX, and oversold RSI readings presents a mixed picture: short-term bounce potential exists given the oversold conditions, but the overall risk-off sentiment suggests caution remains warranted.
| Metric | Reading | Interpretation |
|---|---|---|
Advance/Decline Ratio |
~0.85:1 | Slightly negative breadth |
New Highs vs New Lows |
Near equilibrium | Slight bias toward new lows |
S&P 500 Volume |
987.81M | Below 20-day average (~1.1B) |
The morning session volume is running significantly below the 20-day average, suggesting cautious trading and limited conviction in today’s price movement. The S&P 500 has traded approximately 987.81 million shares against a 20-day average of roughly 1.1 billion shares. Nasdaq volume is significantly higher relative to other indices at 2.97 billion shares, indicating concentration of trading activity in technology stocks. The low volume profile suggests no urgency or panic among participants, with trading remaining disciplined and orderly. Low volume during declines typically indicates limited institutional selling pressure, suggesting the current pullback represents consolidation rather than distribution. The afternoon session may see increased participation as more market participants join the session.
| Index | 20-Day Change | Volatility | 20-Day MA | Position |
|---|---|---|---|---|
| S&P 500 | -4.61% | 0.84% | 6,704.91 | Below MA |
| NASDAQ | -4.08% | 1.09% | 22,324.02 | Below MA |
| Dow Jones | -6.15% | 0.82% | 47,171.65 | Below MA |
| Russell 2000 | -5.01% | 1.38% | 2,537.41 | Below MA |
All major indices are trading below their 20-day moving averages, confirming the short-term bearish trend established during the March correction. The Dow Jones has experienced the largest 20-day decline at -6.15%, reflecting weakness in industrial and financial components. The Russell 2000 shows the highest volatility at 1.38%, typical of small-cap weakness during market corrections. The approximately 5% decline in both SPY and QQQ over the past 20 trading days confirms a correction phase rather than a trend reversal. The relatively flat intraday movement suggests the market is in consolidation, awaiting fresh catalysts for directional clarity.
- Economic Data:No major economic releases scheduled for the remainder of the session
- Fed Speakers:No additional Fed officials scheduled to speak
- Corporate Earnings:No major earnings releases expected
- SPY Support Test:The $646.75 level represents critical support; a break below could trigger accelerated selling
- QQQ Support Test:The $576.05 level must hold to maintain the sideways structure
- VIX Movement:A spike above 28 would indicate increased fear and potential risk-off acceleration
- Volume Acceleration:Any surge in afternoon trading volume could indicate institutional direction
- RSI Bounce Potential:Oversold readings may trigger short-term buying interest
March 2026 has exhibited heightened volatility typical of quarter-end repositioning. The Q1 2026 period has seen a modest correction with SPY down approximately 5.5% year-to-date. The market appears to be digesting recent declines and awaiting clearer directional cues. The afternoon session likely sees continued consolidation as participants position for the remainder of the week.
The market is entering the historically higher-volume period of the trading day, which may amplify any price movements. Traders should monitor the following:
-
Support Failure Risk:Should SPY breach $646.75 or QQQ break below $576.05, the path of least resistance would likely shift toward testing the lower Bollinger Bands ($644.38 for SPY, $578.80 for QQQ).
-
Reversal Potential:Conversely, a bounce from current levels could target the 20-day moving averages as resistance ($668.90 for SPY, $598.25 for QQQ), representing approximately 2.5% upside potential.
-
VIX Behavior:A VIX spike above 28 would signal increasing fear and likely accelerate risk-off positioning; a decline below 25 could suggest stabilizing sentiment.
-
Volume Confirmation:Afternoon session volume above 50% of the 20-day average would provide conviction to any directional move; continued low volume suggests consolidation persistence.
| Scenario | Action | Rationale |
|---|---|---|
SPY breaks below $650 |
Look for short setups | Breakdown from range; target $646.75 support |
SPY bounces from $650 |
Consider long scalp | Oversold RSI may trigger bounce to $660 |
VIX spikes above 28 |
Reduce exposure | Increased fear may trigger broader selloff |
| Position | Recommendation |
|---|---|
Long Positions |
Wait for confirmation above $660 before adding |
Cash Level |
Maintain elevated cash (40-50%) given uncertainty |
Hedging |
Consider protective puts on core equity positions |
- Stop Losses:Place protective stops below $646.75 for any long positions
- Position Sizing:Reduce exposure given the sideways, uncertain environment
- Time Horizon:Expect continued consolidation; patience required for new positions
- Sector Focus:Favor defensive sectors (Healthcare, Consumer Staples) over growth
The mid-session analysis for March 26, 2026 reveals a market in a cautious consolidation phase. The morning session has produced modest declines of approximately 0.25% for major indices, with defensive sectors outperforming growth sectors in a classic risk-off rotation pattern. Both SPY and QQQ are trading near critical technical support levels, with the oversold RSI readings presenting potential short-term bounce opportunities. However, the bearish MACD momentum and elevated VIX suggest the path of least resistance remains lower until the indices can reclaim their 20-day moving averages.
The Russell 2000’s positive performance is worth monitoring as a potential indicator of capital rotating into value and small-cap segments. Volume remains below average, indicating limited conviction and no panic selling. The afternoon session is likely to see continued testing of key support levels, with traders awaiting clear breaks above resistance ($660 for SPY) or below support ($646.75) before committing capital.
Data retrieved at 12:00 PM EDT. All figures reflect real-time market conditions.
[0] Ginlix Quantitative Database (Real-time market data retrieved at 12:00 PM EDT, March 26, 2026)
Insights are generated using AI models and historical data for informational purposes only. They do not constitute investment advice or recommendations. Past performance is not indicative of future results.
About us: Ginlix AI is the AI Investment Copilot powered by real data, bridging advanced AI with professional financial databases to provide verifiable, truth-based answers. Please use the chat box below to ask any financial question.