Mid-Session US Market Analysis - March 27, 2026
Unlock More Features
Login to access AI-powered analysis, deep research reports and more advanced features
About us: Ginlix AI is the AI Investment Copilot powered by real data, bridging advanced AI with professional financial databases to provide verifiable, truth-based answers. Please use the chat box below to ask any financial question.
The US equity markets are experiencing a notably negative mid-session on March 27, 2026, with all major indices trading lower and technical indicators signaling significant bearish momentum. The S&P 500 is down 0.39% at $640.27, the Nasdaq Composite has declined 0.52% to $568.39, while the Dow Jones Industrial Average shows the largest decline at 0.73%. The Russell 2000 small-cap index demonstrates relative resilience, down only 0.28% [0].
A clear defensive rotation is evident in sector performance, with Utilities (+2.71%) significantly outperforming as investors gravitate toward safe-haven plays. Conversely, Consumer Cyclical stocks lag badly at -1.87%, reflecting risk-off behavior amid uncertain market conditions. Technical analysis reveals deeply oversold conditions across both the S&P 500 and Nasdaq, with RSI readings below 25 on both indices—levels that historically suggest extreme bearish sentiment and potential for short-term corrective rallies, though momentum indicators continue to favor sellers [0].
Market breadth remains modestly negative with 6 of 11 sectors declining, though the defensive composition of advancing sectors (Utilities, Energy, Real Estate, Consumer Defensive) underscores the cautious sentiment prevailing in the session. Trading volume is elevated on the Nasdaq at 3.55 billion shares, reflecting heightened technology sector activity amid the selloff.
| Index | Current Level | Daily Change | Status |
|---|---|---|---|
| S&P 500 (^GSPC) | 6,428.45 | -0.39% | Negative |
| Nasdaq Composite (^IXIC) | 21,175.76 | -0.52% | Negative |
| Dow Jones Industrial (^DJI) | 45,568.08 | -0.73% | Negative |
| Russell 2000 (^RUT) | 2,474.05 | -0.28% | Negative |
The mid-session trading landscape reveals broad-based weakness across all major US equity indices. The Dow Jones Industrial Average registers the most significant decline at 0.73%, followed by the Nasdaq at 0.52% and the S&P 500 at 0.39%. Notably, the Russell 2000 small-cap index demonstrates relative resilience with only a 0.28% decline, suggesting some capital rotation toward smaller capitalization names as investors seek potential value opportunities amid the broader market weakness [0].
The S&P 500 opened the session at 6,453.89 but has declined to mid-session levels near 6,428.45, representing a decline of approximately 25 basis points from the opening. The Nasdaq has exhibited the most volatility among the major indices, trading in a range of over 200 points between 21,089.07 and 21,293.50, reflecting the more pronounced sensitivity of technology stocks to the prevailing risk-off sentiment [0].
| Sector | Daily Change | Performance |
|---|---|---|
| Utilities | +2.71% | Strong Outperformance |
| Energy | +0.90% | Moderate Gains |
| Real Estate | +0.72% | Positive |
| Consumer Defensive | +0.41% | Modest Gains |
| Industrials | +0.05% | Flat |
| Sector | Daily Change | Performance |
|---|---|---|
| Financial Services | -0.02% | Marginally Negative |
| Technology | -0.15% | Modest Decline |
| Communication Services | -0.45% | Moderate Decline |
| Healthcare | -0.88% | Significant Decline |
| Basic Materials | -1.46% | Strong Decline |
| Consumer Cyclical | -1.87% | Severe Decline |
The mid-session sector composition reveals a classic risk-off environment characterized by pronounced defensive rotation. Investors are systematically shifting capital from growth-oriented and economically sensitive sectors toward defensive havens—a pattern that typically emerges during periods of elevated market uncertainty or when economic outlooks deteriorate [0].
| Indicator | Current Value | Interpretation |
|---|---|---|
| Current Price | $640.27 | Near session lows |
| RSI (14-day) | 24.97 | Deeply Oversold (threshold <30) |
| MACD | -9.88 | Bearish, below signal line |
| MACD Histogram | -2.25 | Widening negative momentum |
| SMA20 | $666.30 | Price 3.91% below |
| SMA50 | $679.65 | Price 5.79% below |
| Bollinger Lower Band | $639.11 | Price at lower band |
| Daily ATR | $9.44 | Current volatility |
| Indicator | Current Value | Interpretation |
|---|---|---|
| Current Price | $568.39 | Near session lows |
| RSI (14-day) | 24.80 | Deeply Oversold (threshold <30) |
| MACD | -8.52 | Bearish, below signal line |
| MACD Histogram | -2.59 | Widening negative momentum |
| SMA20 | $595.95 | Price 4.63% below |
| SMA50 | $606.59 | Price 6.30% below |
| Bollinger Lower Band | $571.65 | Price near lower band |
| Daily ATR | $9.54 | Current volatility |
| Level Type | Price | Distance from Current | Status |
|---|---|---|---|
| Resistance 3 | $688.62 | +7.56% | Major overhead supply |
| Resistance 2 | $674.44 | +5.33% | Medium-term resistance |
| Resistance 1 | $662.62 | +3.49% | Near-term resistance |
Current |
$640.27 | — | Mid-session price |
| Support 1 | $638.35 | -0.30% | Critical support |
| Support 2 | $628.00 | -1.92% | Key breakdown level |
| Level Type | Price | Distance from Current | Status |
|---|---|---|---|
| Resistance 3 | $610.00 | +7.32% | Major overhead supply |
| Resistance 2 | $595.00 | +4.68% | Medium-term resistance |
| Resistance 1 | $584.00 | +2.75% | Near-term resistance |
Current |
$568.39 | — | Mid-session price |
| Support 1 | $565.66 | -0.48% | Critical support |
| Support 2 | $555.00 | -2.36% | Key breakdown level |
The S&P 500 is currently testing critical support at $638.35, representing only a 0.30% decline from current levels. A breakdown below this support level would open downside risk toward the next major support cluster near $628, representing approximately 2% additional decline. The Nasdaq faces similar conditions, with support at $565.66 representing only 0.48% below current levels [0].
The market is exhibiting a classic downtrend pattern characterized by consecutive lower highs and lower lows. The S&P 500 opened at $642.50 and has declined to session lows near $640.27, while the Nasdaq opened near $572 and declined to session lows at $565.66. Trading volume has been elevated on declines, confirming institutional selling participation rather than purely retail-driven selling [0].
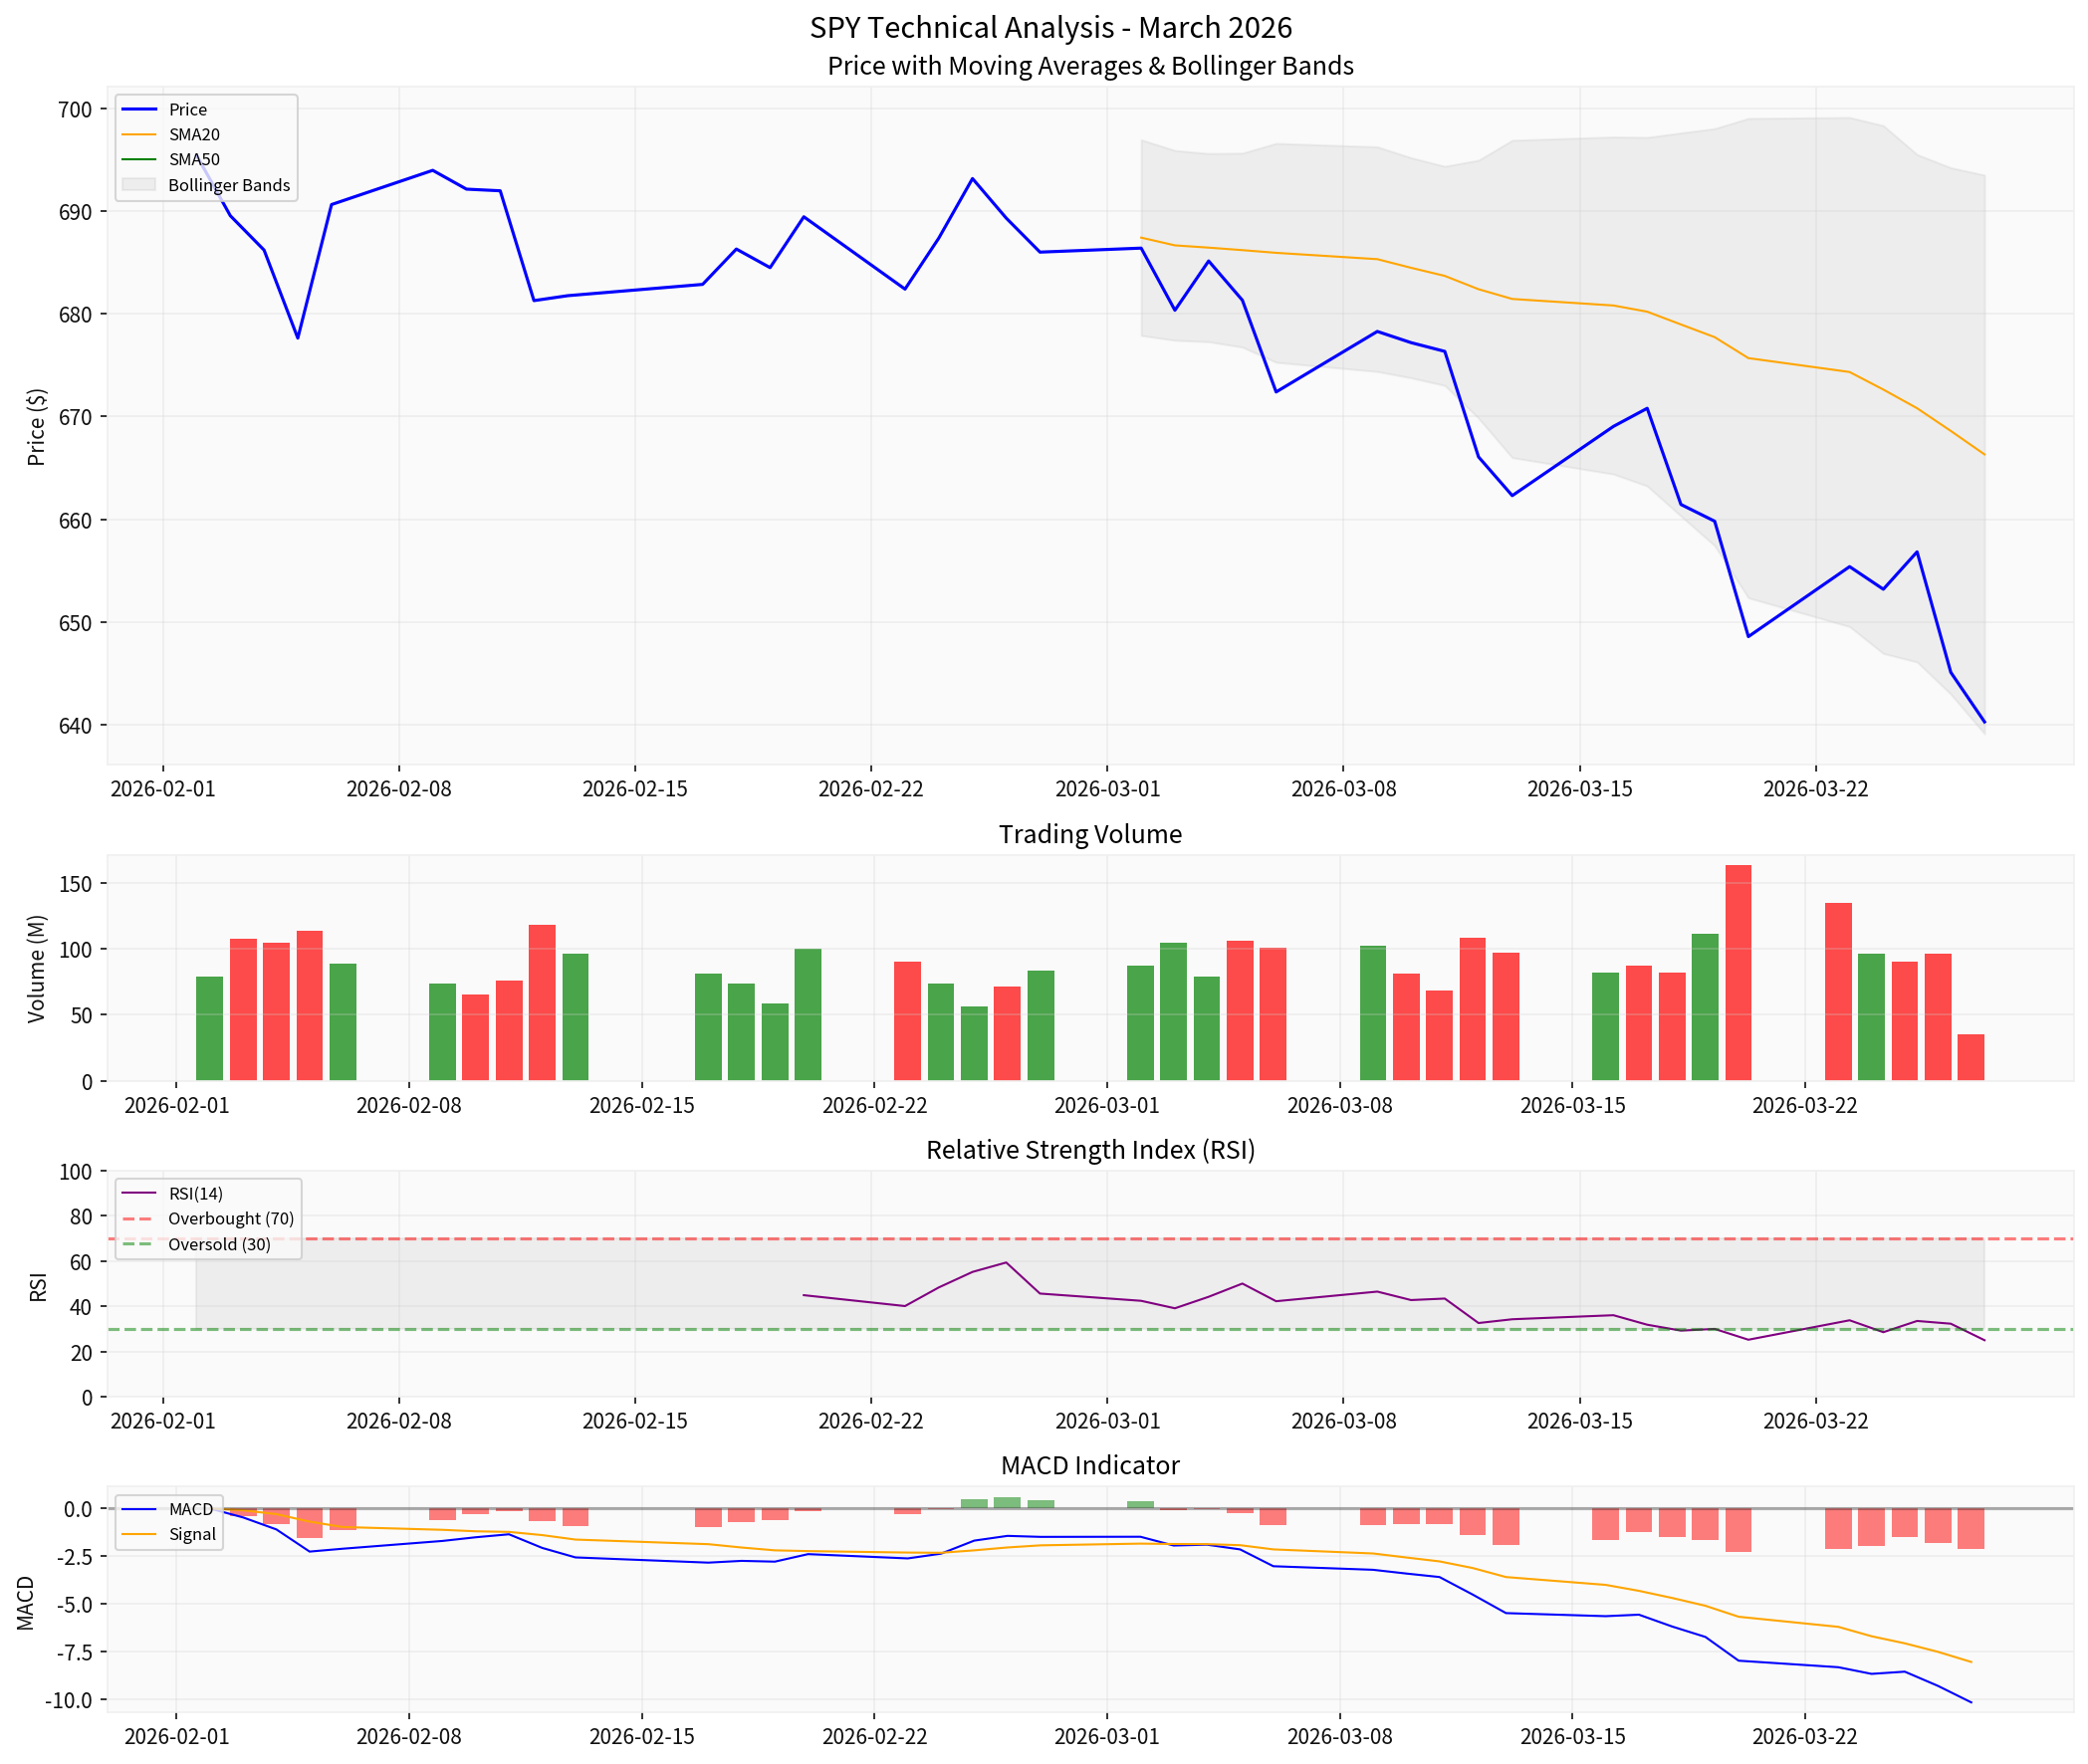
The technical chart above illustrates the S&P 500’s (SPY) price action over the past two months, showing the clear downtrend with price trading below both the 20-day and 50-day moving averages. The RSI panel shows readings consistently below the 30-point oversold threshold, while the MACD histogram remains widened in negative territory, confirming sustained bearish momentum [0].
| Index | Trading Volume | Interpretation |
|---|---|---|
| S&P 500 | 1.07 billion shares | Moderate activity |
| Nasdaq | 3.55 billion shares | High activity |
| Dow Jones | 220.67 million shares | Moderate activity |
The Nasdaq’s significantly elevated trading volume of 3.55 billion shares reflects substantial technology sector activity during the session. This volume concentration in growth stocks contrasts with the relatively defensive sector rotation observed in the broader market, suggesting tech-related positions are being actively reduced or adjusted. The volume pattern—with elevated activity accompanying price declines—confirms institutional participation in the downward move rather than purely sentiment-driven retail selling [0].
The mid-session market exhibits characteristics consistent with
-
Defensive Sector Leadership:Utilities (+2.71%) leading with significant gains, a classic safe-haven rotation pattern that typically emerges when investors prioritize capital preservation over growth.
-
Growth Sector Weakness:Technology (-0.15%) and Consumer Cyclical (-1.87%) underperforming materially, reflecting reduced appetite for growth exposure and consumer discretionary risk.
-
Oversold Technical Conditions:RSI readings below 25 on both major indices indicate extreme bearish sentiment, though this can persist in strong downtrends.
-
Accelerating Negative Momentum:The MACD histogram widening in negative territory suggests selling pressure is intensifying rather than exhausting.
-
Small-Cap Resilience:Russell 2000 relative outperformance (down only 0.28% vs. broader market declines of 0.39-0.73%) may signal selective value-seeking or speculative positioning, often a characteristic of late-stage corrections.
- Key Catalysts:Support holds at $638 (SPY) / $565 (QQQ), oversold RSI triggers corrective buying
- Technical:Short-term bounce toward SMA20 at $666 (SPY) / $596 (QQQ)
- Sector:Defensive sectors (Utilities +2.71%) stabilizing broader market
- Probability:Moderate, given deeply oversold conditions but accelerating momentum
- Key Catalysts:Support breakdown below $638 (SPY) / $565 (QQQ)
- Technical:Next support at $628 (SPY) represents ~2% downside
- Momentum:Widening MACD histogram suggests acceleration not exhaustion
- Probability:Higher probability given technical momentum alignment
- Upside: $650 (minor resistance), $660 (major resistance)
- Downside: $638 (critical support), $628 (key breakdown level)
- Upside: $575 (minor resistance), $585 (major resistance)
- Downside: $565 (critical support), $555 (key breakdown level)
For day traders and short-term participants, the technical bias remains bearish until price recovers above the SMA20 moving averages ($666 for SPY, $596 for QQQ). The oversold conditions suggest caution on new short positions near current levels, as corrective bounces from extreme oversold readings are common. Risk management should emphasize tight stops below daily lows given the accelerated decline pattern.
For swing traders, the higher timeframe analysis confirms the medium-term downtrend remains intact with price below the 50-day moving averages on both indices. Position sizing should remain conservative given the elevated technical stress indicators. Waiting for RSI recovery above 35-40 before establishing new long positions is advisable.
- Extreme oversold conditions can persist in strong downtrends as momentum continues to feed upon itself
- Critical support levels may fail in bear market environments, accelerating declines once support gives way
- The absence of current breaking news due to technical limitations means potential market-moving information may not be reflected in prices
- Defensive rotations typically accelerate in late-stage corrections, potentially indicating broader market stress
The mid-session market on March 27, 2026, reflects a notably defensive posture with pronounced sector rotation toward Utilities and other defensive sectors, while growth and cyclical names experience significant pressure. All major indices trade in negative territory, with the Dow Jones experiencing the largest decline at 0.73%.
Technically, both the S&P 500 and Nasdaq are exhibiting deeply oversold conditions with RSI readings below 25, though momentum indicators (widening negative MACD histogram) suggest selling pressure is intensifying rather than exhausting. The markets are testing critical support levels at $638 (SPY) and $565 (QQQ), with breakdown potentially opening modest downside from current levels.
The defensive sector rotation pattern—Utilities up 2.71% while Consumer Cyclical down 1.87%—represents the most significant market development of the session, signaling investors are prioritizing capital preservation amid uncertain conditions. While oversold readings suggest caution on aggressively bearish positioning near current levels, the technical momentum configuration favors continued weakness until price can reclaim moving average resistance levels.
[0] Ginlix Quantitative Database - Mid-session market data for March 27, 2026, including major index levels, sector performance metrics, technical indicators (RSI, MACD, Bollinger Bands, moving averages), support/resistance levels, and trading volume data.
Insights are generated using AI models and historical data for informational purposes only. They do not constitute investment advice or recommendations. Past performance is not indicative of future results.
About us: Ginlix AI is the AI Investment Copilot powered by real data, bridging advanced AI with professional financial databases to provide verifiable, truth-based answers. Please use the chat box below to ask any financial question.