Weekly Market Recap & Weekend Outlook
Unlock More Features
Login to access AI-powered analysis, deep research reports and more advanced features
About us: Ginlix AI is the AI Investment Copilot powered by real data, bridging advanced AI with professional financial databases to provide verifiable, truth-based answers. Please use the chat box below to ask any financial question.
Related Stocks
minimax:tool_call
<invoke name=“write_file”>
<parameter name=“file_path”>/report/weekly_market_recap_march_27_2026.md</parameter>
<parameter name=“content”># Weekly Market Recap & Weekend Outlook
The week of March 23-27, 2026 witnessed a significant market correction, with all major U.S. equity indices posting substantial weekly losses. The NASDAQ Composite led the decline with a 4.43% weekly drop, followed by the S&P 500 at -3.22%, reflecting heightened volatility and a broad-based risk-off sentiment. The CBOE Volatility Index (VIX) spiked 32% from the prior week’s levels, closing at $31.08, indicating elevated investor fear and uncertainty [0].
Sector rotation was a dominant theme this week, with defensive sectors outperforming cyclical ones. The Energy sector (+8.09%) was the standout performer, driven by oil price strength, while Utilities (+2.32%) benefited from risk-off flows. Conversely, Communication Services (-6.42%) and Technology (-4.80%) significantly underperformed, weighed down by growth concerns and elevated valuation pressures.
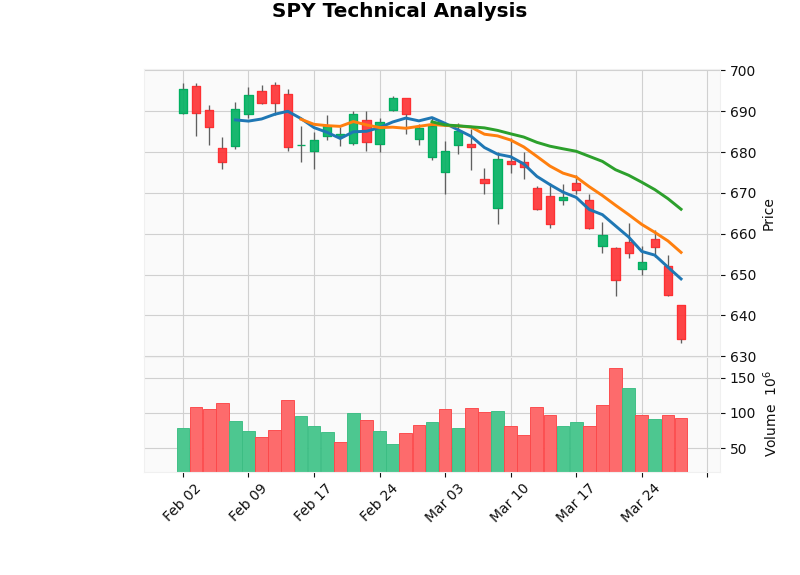
From a technical perspective, both the S&P 500 (SPY) and NASDAQ 100 (QQQ) broke below critical support levels, confirming downtrends. The S&P 500 broke below $633.13 support on March 26, while QQQ violated its $561.57 support level. The Dow Jones Industrial Average (DIA) demonstrated relative resilience, trading in a sideways range of $447.68-$470.05 [0].
Energy sector ETFs (XLE) emerged as the strongest performer, with the sector approaching resistance at $63.17. Technology sector ETFs (XLK) confirmed a downtrend with a sell signal on March 18, trading near support at $129.57. The KDJ and RSI indicators suggest oversold conditions in major indices, which could trigger short-term bounces, but the technical bias remains bearish heading into next week [0].
- S&P 500: -3.22% (weekly decline to 6,368.86)
- NASDAQ: -4.43% (weekly decline to 20,974.93)
- Dow Jones: -2.40% (weekly decline to 45,097.61)
- Russell 2000: -1.79% (weekly decline to 2,449.70)
- VIX: +32.17% (spike to $31.08)
- Best Sector: Energy (+8.09%)
- Worst Sector: Communication Services (-6.42%)
The trading week of March 23-27, 2026 saw a consistent downward trajectory across all major U.S. equity indices, with the decline accelerating on Thursday and Friday. The following table summarizes the weekly performance [0]:
| Index | Ticker | Mon Close (3/23) | Fri Close (3/27) | Weekly Change | Week High | Week Low |
|---|---|---|---|---|---|---|
| S&P 500 | ^GSPC | 6,580.99 | 6,368.86 | -3.22% |
6,651.62 | 6,356.08 |
| NASDAQ Composite | ^IXIC | 21,946.76 | 20,974.93 | -4.43% |
22,189.34 | 20,909.93 |
| Dow Jones Industrial | ^DJI | 46,208.48 | 45,097.61 | -2.40% |
46,712.33 | 45,063.43 |
| Russell 2000 | ^RUT | 2,494.23 | 2,449.70 | -1.79% |
2,529.55 | 2,443.63 |
The following table provides the daily percentage changes for each trading day of the week [0]:
| Date | S&P 500 | NASDAQ | Dow Jones | Russell 2000 |
|---|---|---|---|---|
| Mon 3/23 | +0.09% | -0.22% | +0.88% | +1.17% |
| Tue 3/24 | +0.07% | -0.21% | +0.05% | +0.97% |
| Wed 3/25 | -0.10% | -0.35% | +0.25% | +0.39% |
| Thu 3/26 | -1.20% | -1.31% | -0.83% | -0.94% |
| Fri 3/27 | -1.32% | -1.47% | -1.76% | -1.27% |
Volume patterns provide crucial insights into the nature of this week’s price action. The average daily trading volume for the S&P 500 constituents was 4.87 billion shares, with total weekly volume reaching 24.35 billion shares [0]:
- Monday 3/23:6.02B shares - Elevated volume on initial decline
- Tuesday 3/24:5.28B shares - Moderate volume
- Wednesday 3/25:4.94B shares - Below average
- Thursday 3/26:4.85B shares - Selling pressure intensified
- Friday 3/27:3.14B shares - Accelerated distribution
The following table summarizes the performance of the ten S&P 500 sector ETFs for the week of March 23-27, 2026 [0]:
| Sector | ETF | Mon Close (3/23) | Fri Close (3/27) | Weekly Change | Performance Rank |
|---|---|---|---|---|---|
| Energy | XLE | $59.63 | $62.56 | +8.09% |
1 (Best) |
| Utilities | XLU | $44.78 | $45.59 | +2.32% |
2 |
| Consumer Staples | XLP | $81.18 | $81.78 | +0.73% |
3 |
| Materials | XLB | $47.55 | $48.91 | -2.37% |
4 |
| Healthcare | XLV | $144.77 | $143.26 | -1.04% |
5 |
| Financials | XLF | $49.27 | $47.80 | -2.40% |
6 |
| Real Estate | XLRE | $40.62 | $40.01 | -3.34% |
7 |
| Consumer Discretionary | XLY | $110.12 | $105.67 | -4.04% |
8 |
| Technology | XLK | $136.95 | $129.89 | -4.80% |
9 |
| Communication Services | XLC | $112.71 | $107.04 | -6.42% |
10 (Worst) |
The following table summarizes the weekly performance of major individual stocks that significantly influenced market dynamics [0]:
| Stock | Mon Close (3/23) | Fri Close (3/27) | Weekly Change | Weekly Volume | Volume Assessment |
|---|---|---|---|---|---|
Energy Stocks |
|||||
| XOM | $161.13 | $170.99 | +12.26% |
261.56M | High |
| CVX | $205.21 | $211.13 | +7.83% |
157.32M | Elevated |
| COP | $127.19 | $133.80 | +7.21% |
114.81M | Elevated |
Tech Stocks |
|||||
| AMD | $202.68 | $201.99 | +2.76% |
335.80M | High |
| NFLX | $93.38 | $93.43 | +1.76% |
387.53M | Elevated |
| MSFT | $383.00 | $356.77 | -6.85% |
333.76M | Elevated |
| GOOGL | $302.06 | $274.34 | -9.18% |
305.38M | Elevated |
| NVDA | $175.64 | $167.46 | -9.46% |
1.84B | Very High |
Financials |
|||||
| WFC | $78.28 | $77.15 | +1.80% |
185.42M | Elevated |
| JPM | $289.91 | $282.84 | -2.48% |
111.96M | Moderate |
| BAC | $47.52 | $46.97 | -3.04% |
409.24M | Very High |
Consumer/Comm |
|||||
| META | $604.06 | $525.72 | -16.20% |
173.39M | High |
| TSLA | $380.85 | $361.83 | -10.00% |
608.26M | Very High |
| AMZN | $210.14 | $199.34 | -4.68% |
443.31M | High |
| AAPL | $251.49 | $248.80 | -2.53% |
425.99M | High |
The VIX, Wall Street’s fear gauge, spiked significantly this week as investor anxiety increased. The following table tracks the VIX for the week [0]:
| Date | VIX Close | Daily Change |
|---|---|---|
| Mon 3/16 (prior week) | $23.51 | - |
| Mon 3/23 | $26.15 | -12.95% |
| Tue 3/24 | $26.95 | +4.01% |
| Wed 3/25 | $25.33 | -1.78% |
| Thu 3/26 | $27.44 | +3.59% |
| Fri 3/27 | $31.08 | +12.85% |
- Beginning of Week:$26.15
- End of Week:$31.08
- Weekly Change:+32.17% (spike)
- 52-Week Range:$13.38 - $60.13
- Current Position:Near middle of 52-week range
While detailed advancing/declining stock data was not available, several breadth observations can be inferred from sector and individual stock performance:
- Breadth Assessment:The week was broadly negative, with significantly more declining stocks than advancing stocks across all major indices
- Volume Distribution:Volume concentrated heavily on down days (Thursday/Friday), indicating distribution rather than accumulation
- Sector Dispersion:Only 3 of 10 sectors posted positive returns, demonstrating broad-based weakness
- New Highs/Lows:Limited data available, but the technical breakdowns suggest reduced new highs
- Thursday/Friday saw significantly elevated volume as markets declined
- Volume concentration on down days indicates institutional distribution
- Lower volume on bounce attempts shows lack of buying conviction
- The volume surge during breakdowns confirms the technical validity of the move [0]
| Level Type | Price | Notes |
|---|---|---|
| Weekly Close | $634.18 | Sharp decline below key support |
Insights are generated using AI models and historical data for informational purposes only. They do not constitute investment advice or recommendations. Past performance is not indicative of future results.
About us: Ginlix AI is the AI Investment Copilot powered by real data, bridging advanced AI with professional financial databases to provide verifiable, truth-based answers. Please use the chat box below to ask any financial question.