Buffett Indicator Signals Extreme U.S. Stock Market Overvaluation at 223.8% of GDP
Unlock More Features
Login to access AI-powered analysis, deep research reports and more advanced features
About us: Ginlix AI is the AI Investment Copilot powered by real data, bridging advanced AI with professional financial databases to provide verifiable, truth-based answers. Please use the chat box below to ask any financial question.
Related Stocks
This analysis is based on the Wall Street Journal report [1] published on November 4, 2025, highlighting that U.S. stocks have crossed a significant valuation milestone for only the second time in history. The Buffett Indicator, a renowned valuation metric measuring total U.S. stock market value to GDP, has reached unprecedented levels suggesting potentially challenging years ahead for investors [1].
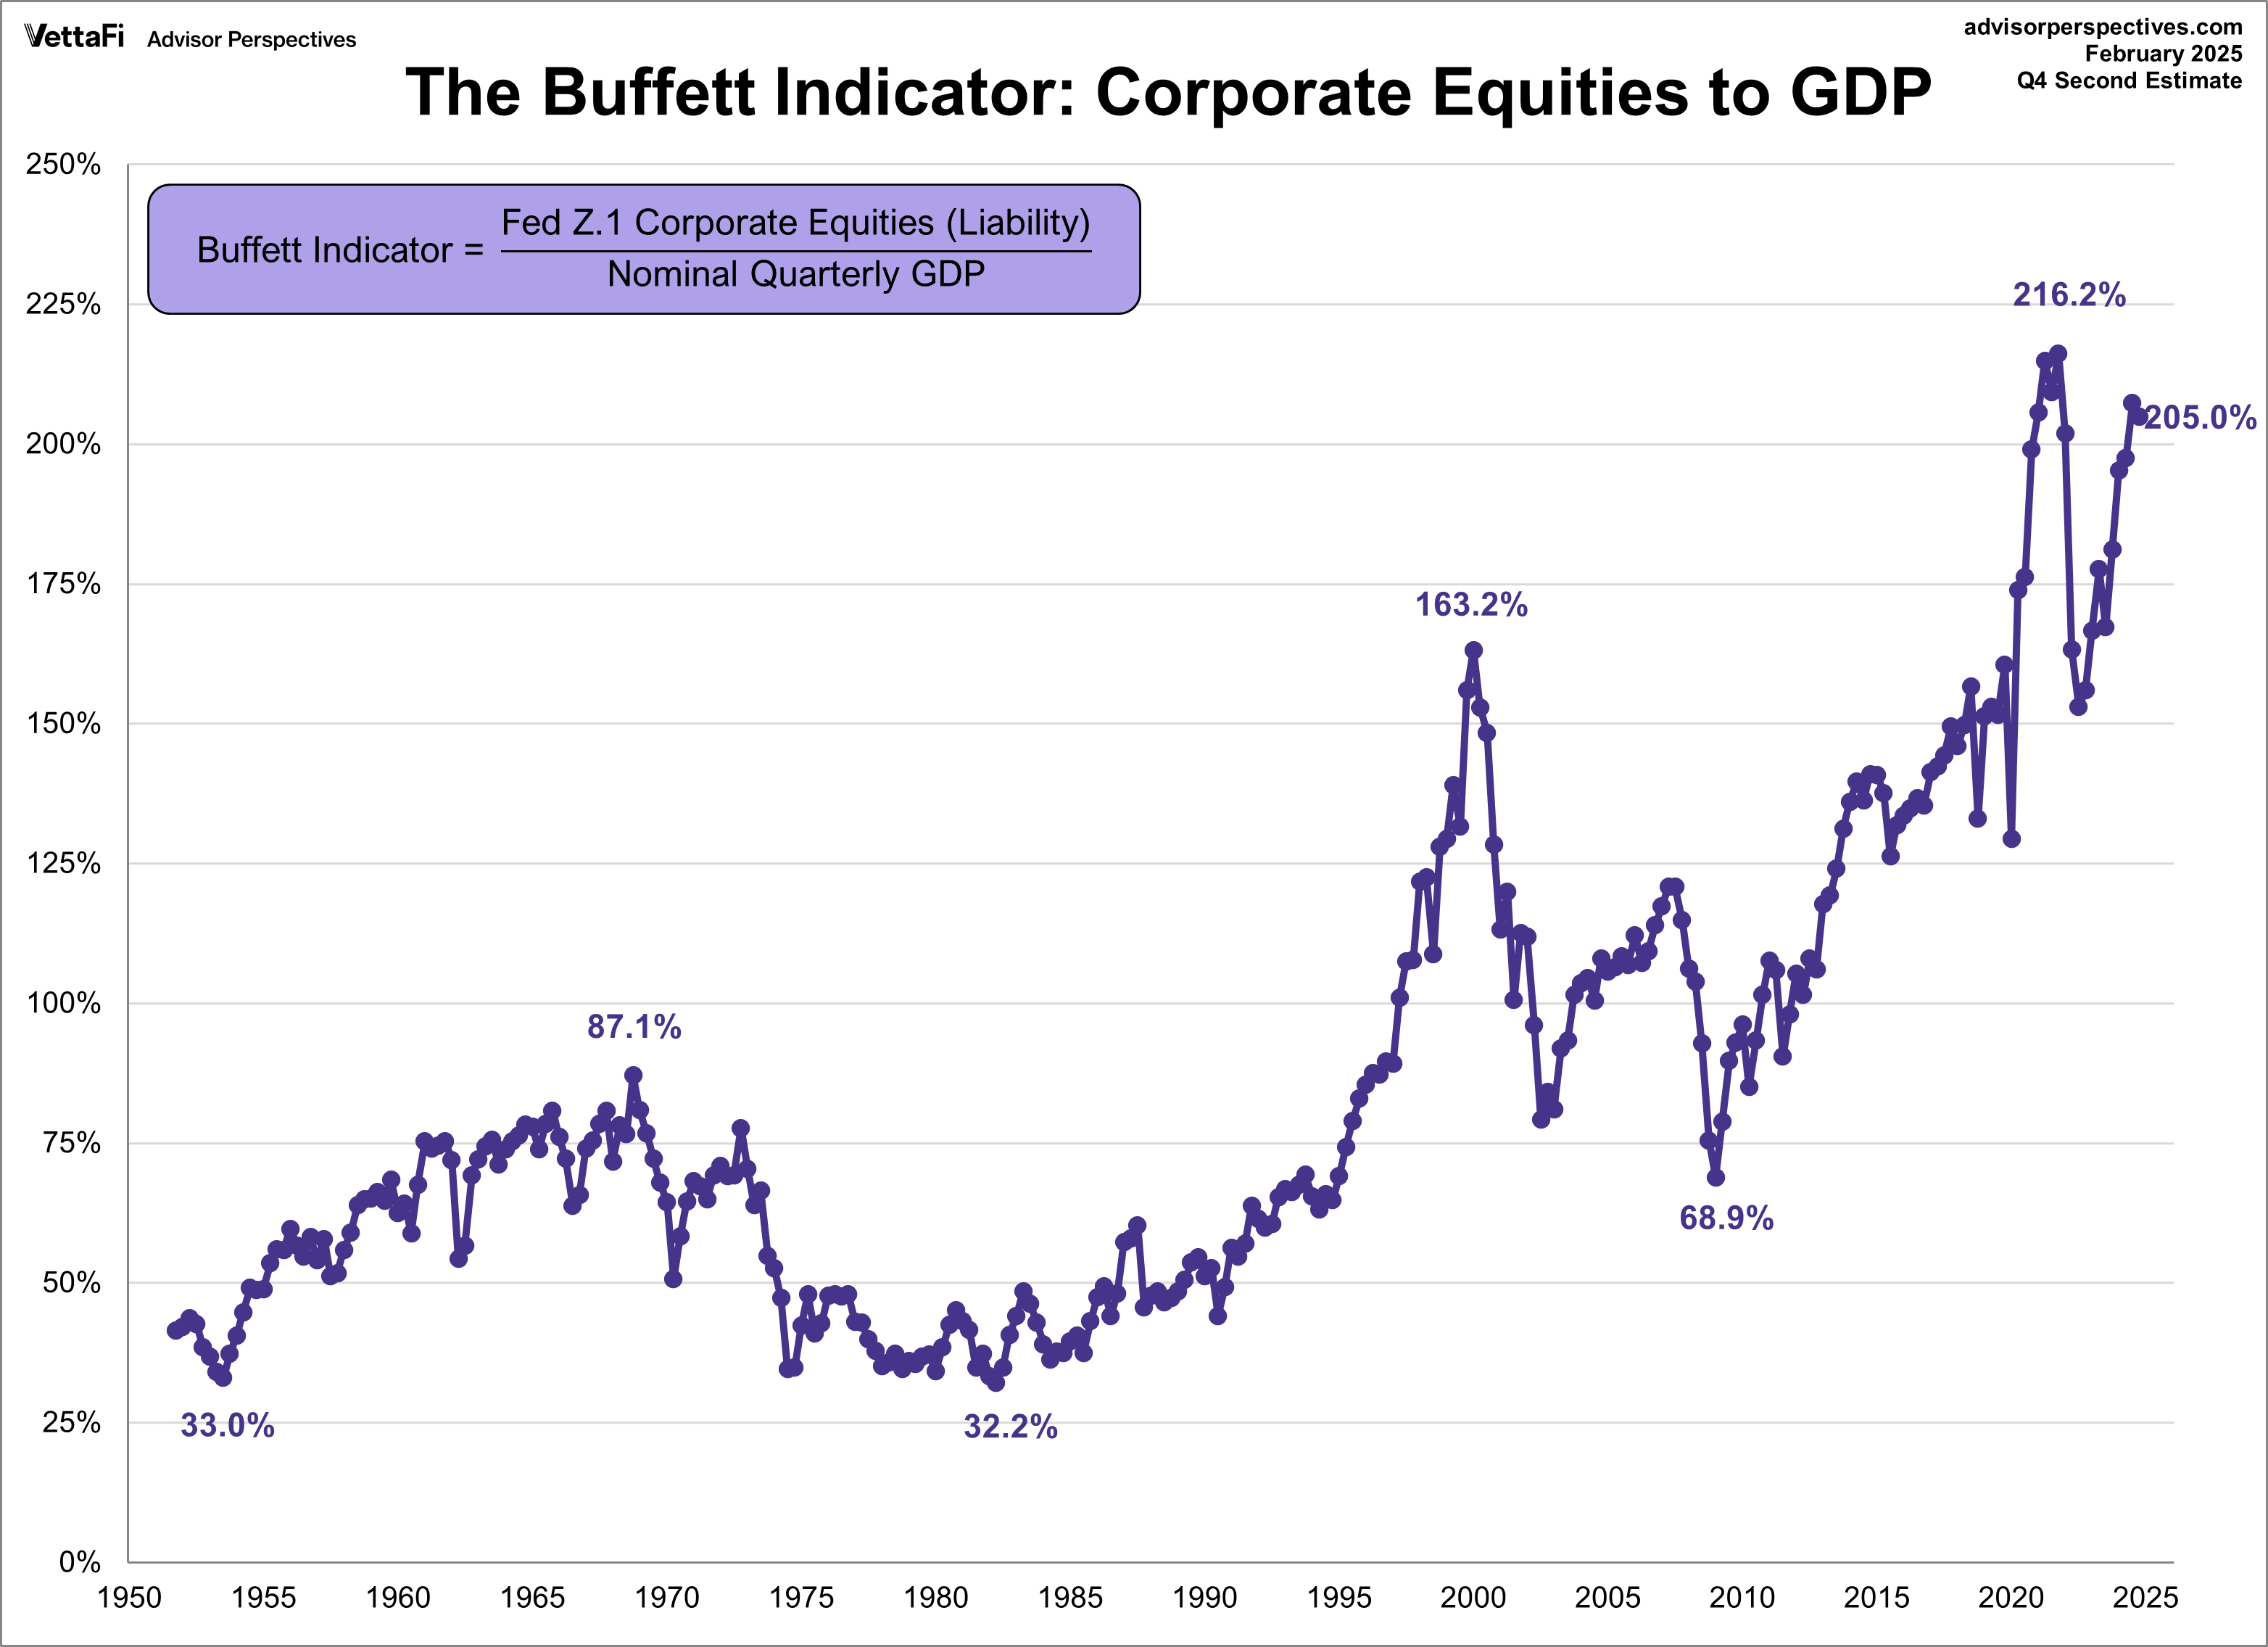
The Buffett Indicator currently stands at 223.8% as of October 31, 2025, with total U.S. stock market value at $68.24 trillion against annualized GDP of $30.49 trillion [0]. This represents the second time in history that this metric has crossed such extreme levels, with the previous occurrence being during the dot-com bubble peak around 1999-2000 [0]. According to established valuation frameworks, markets are considered “Significantly Overvalued” when the ratio exceeds 163%, placing the current market well into extreme territory [0].
Despite these concerning valuation levels, U.S. markets have demonstrated strong recent performance [0]:
- S&P 500: +2.38% over the past 30 days, closing at $6,851.97
- NASDAQ Composite: +4.62% over the past 30 days, closing at $23,834.72
- Dow Jones Industrial: +2.10% over the past 30 days, closing at $47,336.69
- Russell 2000: +0.16% over the past 30 days, closing at $2,471.24
This performance divergence is largely driven by AI sector enthusiasm, with capital expenditures exceeding $250 billion in 2025 and AI-related stocks now accounting for 44% of S&P 500 market capitalization [2]. Additionally, strong corporate earnings, with approximately 83% of S&P 500 companies beating estimates, have supported market momentum [3].
The current valuation level exceeds even the 1999-2000 peak that preceded a significant market correction. Historical patterns suggest that when the Buffett Indicator approaches 200%, investors may be “playing with fire” [0]. The current reading of 223.8% therefore represents an extreme deviation from historical norms, potentially indicating elevated risk of mean reversion.
A critical insight is the extreme concentration in AI-related stocks, which now represent 44% of S&P 500 market capitalization [2]. This creates a dual vulnerability: (1) overall market overvaluation and (2) sector-specific concentration risk. Any correction in AI valuations could have outsized impact on broader market indices.
The strong recent market performance despite extreme valuations suggests a potential disconnect between market psychology and fundamental valuation metrics. This disconnect may be sustained by continued capital flows into AI and technology sectors, but creates vulnerability to sentiment shifts or catalyst events.
-
Valuation Mean Reversion Risk: Markets tend to revert to historical averages, potentially implying lower returns or corrections over the medium to long term [0]
-
Concentration Risk: The heavy weighting of AI stocks (44% of S&P 500) creates sector-specific vulnerability that could trigger broader market declines [2]
-
Earnings Sustainability Risk: Current earnings levels may not be sustainable in higher interest rate environments or if AI investment cycles slow
-
Liquidity Risk: High valuations combined with potential economic headwinds could trigger rapid outflows, particularly from institutional investors rebalancing portfolios
- Defensive Positioning: Current conditions may favor quality companies with sustainable earnings and reasonable valuations
- Sector Diversification: Opportunities may exist in undervalued sectors outside the AI concentration
- International Diversification: U.S. overvaluation may create relative value opportunities in international markets
- Cash Reserve Strategy: Maintaining adequate liquidity could position investors to capitalize on potential correction opportunities
- Buffett Indicator Sustainability: Watch for sustained levels above 200% and any acceleration or deceleration trends [0]
- Fed Policy Impact: Interest rate decisions affecting discount rates and valuation multiples
- AI Investment Cycle: Monitor capital expenditure trends and earnings sustainability in AI-related companies [2]
- Sector Rotation Patterns: Track capital flows between overvalued technology sectors and potentially undervalued traditional sectors
- International Capital Flows: Global investors’ response to U.S. overvaluation and potential reallocation to other markets
The Buffett Indicator has reached an unprecedented 223.8% of GDP, marking only the second time in history this extreme valuation level has been exceeded [0][1]. This reading surpasses the 1999-2000 dot-com bubble peak and falls well into the “Significantly Overvalued” category (which begins at 163%) [0].
Despite these valuation concerns, markets have shown resilience with the S&P 500 gaining 2.38% and NASDAQ advancing 4.62% over the past 30 days [0]. This performance is largely driven by AI sector enthusiasm, with AI stocks representing 44% of S&P 500 market capitalization and capital expenditures exceeding $250 billion in 2025 [2].
The combination of extreme overall market valuation and sector concentration creates a complex risk environment. Historical precedent suggests such valuation levels typically precede market corrections, though timing remains uncertain [0]. Current market momentum appears disconnected from fundamental valuation metrics, potentially creating vulnerability to sentiment shifts or catalyst events.
Corporate earnings remain strong with 83% of S&P 500 companies beating estimates [3], providing some fundamental support, but the sustainability of these earnings levels in the context of high valuations and potential economic headwinds remains a key consideration for investors.
Insights are generated using AI models and historical data for informational purposes only. They do not constitute investment advice or recommendations. Past performance is not indicative of future results.
About us: Ginlix AI is the AI Investment Copilot powered by real data, bridging advanced AI with professional financial databases to provide verifiable, truth-based answers. Please use the chat box below to ask any financial question.