Analysis of Reddit Thesis on US Debt Management via 1946-Style Financial Repression
Unlock More Features
Login to access AI-powered analysis, deep research reports and more advanced features
About us: Ginlix AI is the AI Investment Copilot powered by real data, bridging advanced AI with professional financial databases to provide verifiable, truth-based answers. Please use the chat box below to ask any financial question.
Related Stocks
The Reddit post [1] argues the U.S. should use 1946-style financial repression (capping bond yields, letting inflation run, AI-driven GDP growth) to reduce its $40T debt-to-GDP ratio, recommending short bonds (TLT), long equities (SPY/QQQ), and hard assets. Critics counter with five key points:
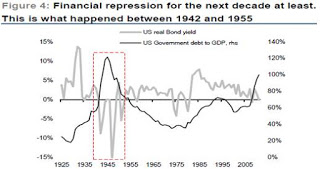
- Historical Context Irrelevance: 1946 U.S. had global manufacturing monopoly and temporary war debt vs current structural debt (spending > revenue) [2][3].
- Unrealistic GDP Projection: 7-8% annual growth is unsupported by recent data [3].
- Position Conflict: Short-term options (Jan2026) contradict long-term (10-15y) thesis [1].
- Inflation Risk: Yield curve control could trigger runaway inflation if bondholders dump assets [6].
- Repackaged Ideas: Financial repression is well-documented in economic literature [2].
Market performance: TLT down 1.73% (Oct-Nov2025) [4] (supports short), SPY down1.14% [5] (contradicts long).
- Historical Mismatch: 1946 debt was temporary war debt vs current structural debt; U.S. no longer dominates global manufacturing [2][3].
- Credibility Gap: Long-term thesis but short-term positions suggest lack of conviction [1].
- Mixed Market Response: Bond ETFs fall but equity ETFs don’t rise as recommended [4][5].
- Risks: Yield curve control leading to runaway inflation [6]; unrealistic GDP projections; structural debt issues [3].
- Opportunities: Shorting TLT may be profitable short-term [4], but long-term equity gains depend on unproven growth [3].
- U.S. debt: $38.04T (Oct2025), debt-to-GDP ~99.8% [3].
- Post-war precedent: Debt-to-GDP fell from119% (1946) to 23% (1974) via financial repression [2].
- Market trends: TLT down 1.73% (Oct-Nov2025), SPY down1.14% [4][5].
- Gaps: No AI growth details; missing current inflation data; Fed stance unknown; OP’s position details unclear.
Insights are generated using AI models and historical data for informational purposes only. They do not constitute investment advice or recommendations. Past performance is not indicative of future results.
About us: Ginlix AI is the AI Investment Copilot powered by real data, bridging advanced AI with professional financial databases to provide verifiable, truth-based answers. Please use the chat box below to ask any financial question.