In-Depth Case Analysis of Leggett & Platt (LEG): Research on the Replicability of InvestingPro's Stock Selection Methodology
Unlock More Features
Login to access AI-powered analysis, deep research reports and more advanced features

About us: Ginlix AI is the AI Investment Copilot powered by real data, bridging advanced AI with professional financial databases to provide verifiable, truth-based answers. Please use the chat box below to ask any financial question.
Related Stocks
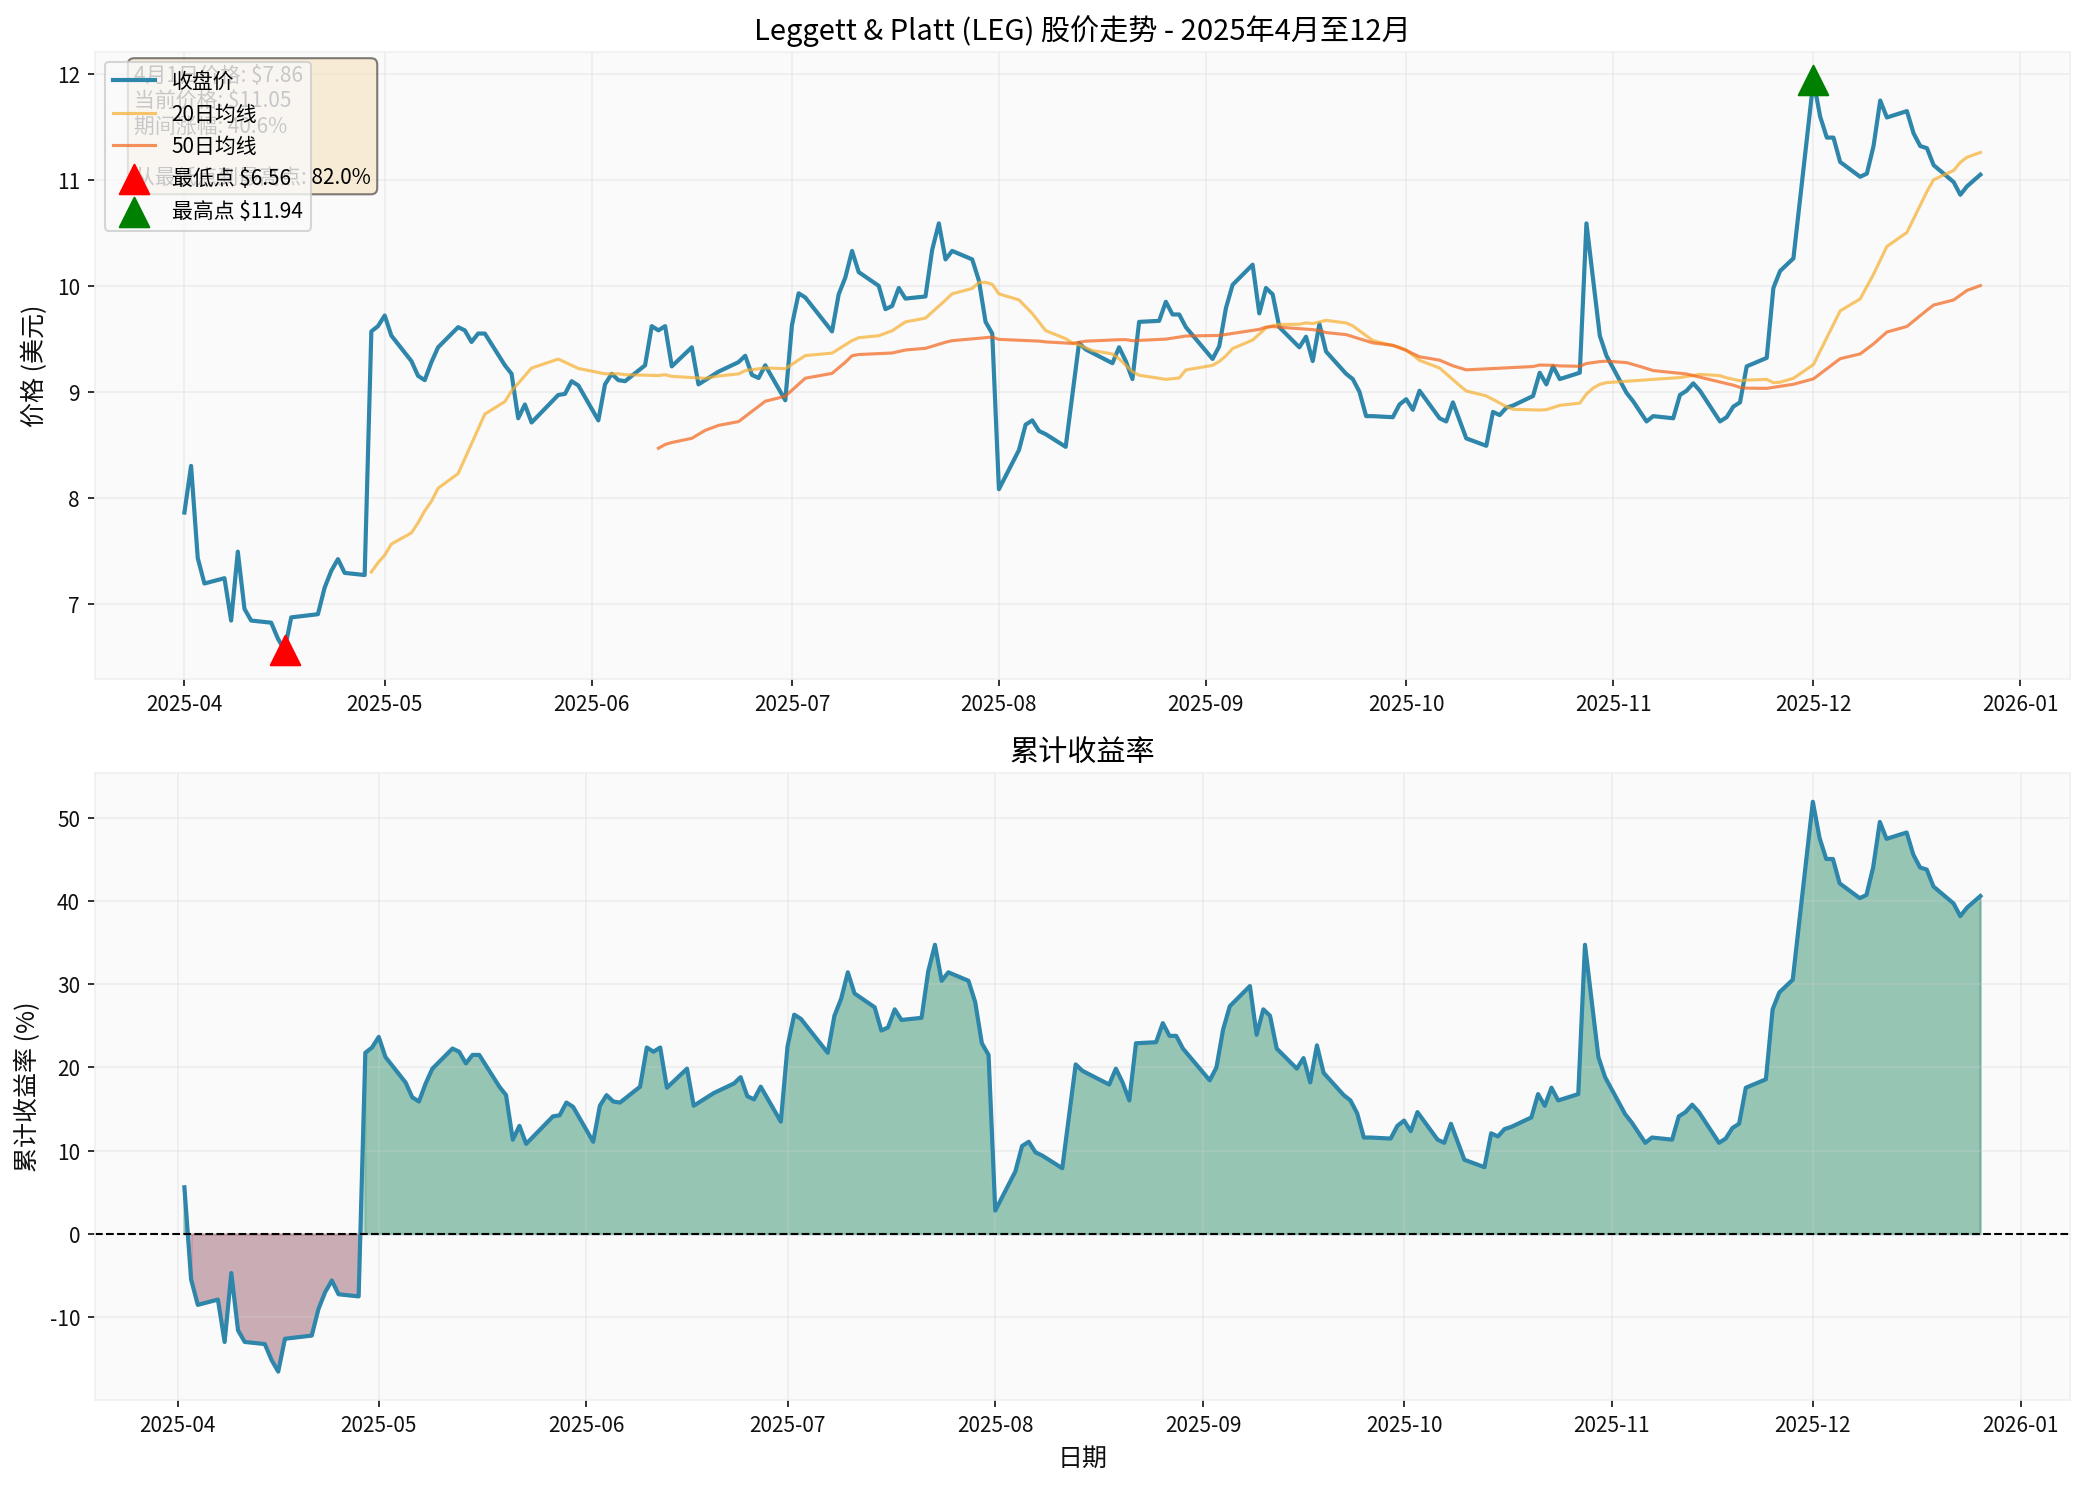
According to brokerage API data, Leggett & Platt (LEG) indeed experienced a significant valuation repair rally in 2025:
- April 1 to December 27:Rose from $7.86 to $11.05, an increase of40.6%[0]
- Mid-April to December 27:Rose from approximately $6.95 to $11.05, an increase of59.0%[0]
- From annual lowest point(April 16, $6.56) to current: Increase of68.4%[0]
- From lowest point to highest point(December 1, $11.94): Peak increase reached82.0%[0]
 [0]
[0]
- Price-to-Earnings Ratio (P/E):6.86x[0]
- Price-to-Book Ratio (P/B):1.58x[0]
- Return on Equity (ROE):27.49%[0]
- Net Profit Margin:5.38%[0]
- Current Ratio:2.15[0]
- 52-Week Price Range:$6.48 - $12.03[0]
- Median Target Price: $12.00 (8.6% upside potential from current price)[0]
- Rating Distribution: 28.6% Buy, 71.4% Hold[0]
According to web search data, InvestingPro’s Fair Value model adopts a comprehensive evaluation framework of
- Discounted Cash Flow (DCF) Model
- Dividend Discount Model (DDM)
- Relative Valuation Method(P/E, P/B, EV/EBITDA, etc.)
- Analyst Target Price Synthesis
- 52-Week Price Range Analysis
The platform uses high-quality data sources in partnership with
According to brokerage API’s DCF analysis (based on 2024 financial report data):
- Conservative Scenario:Fair Value $58.37 (vs current price +428.2%)[0]
- Base Scenario:Fair Value $88.51 (vs current price +701.0%)[0]
- Optimistic Scenario:Fair Value $187.77 (vs current price +1599.3%)[0]
- Beta Coefficient:0.77 (lower than market volatility)[0]
- Risk-Free Rate:4.5%[0]
- Equity Risk Premium:7.0%[0]
- Weighted Average Cost of Capital (WACC):6.1%[0]
- Historical 5-Year Revenue CAGR: 0.6%[0]
- EBITDA Margin: 7.6%[0]
- Terminal Growth Rate: 2.0%-3.0%[0]
| Valuation Dimension | Market Data | Analysis Interpretation |
|---|---|---|
Absolute Valuation |
P/E=6.86x | Far below S&P500 average (~20x), in historical low range[0] |
Relative Valuation |
P/B=1.58x | Close to book value, implying overly pessimistic market expectations[0] |
Profitability |
ROE=27.49% | High ROE with low valuation, typical feature of avoiding value traps[0] |
Financial Health |
Current Ratio=2.15 | Sound financial condition, low debt repayment risk[0] |
Technical Aspect |
Price above 50-day/200-day moving average | Upward trend formed after April, technical strength improved[0] |
- In early 2025, the market was extremely pessimistic about the prospects of the furniture components industry
- LEG’s stock fell to a 52-week low of $6.48 (down over 80% from historical high)[0]
- P/E compressed to single digits, reflecting that the worst-case scenario was priced in
According to web search data, InvestingPro successfully predicted multiple similar cases (e.g., 45% drop in Bullish stock, 35% drop in Atai Life Sciences), indicating its model excels at identifying moments of
- Mattress Products: 40.2% ($1.78B)[0]
- Furniture, Flooring and Textiles: 31.7% ($1.40B)[0]
- Professional Products: 28.1% ($1.24B)[0]
- US: 60.1%[0]
- Europe:15.1%[0]
- China:10.1%[0]
This diversified business structure provided resilience amid macro uncertainty, supporting valuation repair.
From the technical analysis chart[0]:
- After forming an important low on April 16, the stock price climbed steadily
- 20-day and 50-day moving averages formed a bullish alignment
- Moderate volume increase, showing institutional capital gradually entering
- Reduce Single Model Bias:Cross-validation across multiple dimensions such as DCF, relative valuation, and analyst targets[1][2]
- Dynamic Adjustment Capability:Model parameters can be adjusted according to market environment and personal expectations[2]
- Data Quality Assurance:Uses authoritative data sources like S&P Global[2]
According to web searches, InvestingPro’s model recently successfully predicted:
- 45% drop in Bullish (BLSH)[3]
- 35% drop in Atai Life Sciences[4]
- Showing consistency in identifying extreme pricing errors
- Input Assumption Sensitivity:DCF is highly sensitive to growth rate and discount rate assumptions
- LEG’s base scenario assumes only 0.6% revenue growth; if actual growth is lower, valuation will be sharply reduced[0]
- Historical Data Dependence:Models are based on historical financial data and may fail to capture structural changes
- Market Sentiment Factors:The time dimension of value repair is uncontrollable and may last for years
LEG’s 63% rally stemmed from the following special conditions:
- Industry Cycle Bottom:Furniture components industry was at the trough of the business cycle
- Extreme Valuation Level:P/E below 7x, in historical extreme range
- Financial Soundness:High ROE (27.49%) with low debt
- Macro Environment Change:Interest rate expectation shift favorable to value stocks
| Dimension | Replicability | Explanation |
|---|---|---|
Model Framework |
★★★★☆ | Multi-model valuation methodology can be systematically applied[1][2] |
Data Acquisition |
★★☆☆☆ | Ordinary investors find it difficult to obtain S&P-level data[2] |
Opportunity Identification |
★★★☆☆ | Limited number of extreme undervaluation cases, requiring broad coverage |
Execution Discipline |
★★★★☆ | Quantitative signals can reduce emotional interference |
Time Cost |
★★☆☆☆ | Value repair may take years |
Comprehensive Score |
★★★☆☆ | Moderate Replicability |
The LEG case confirms the core principles of value investment:
- Market prices will return to intrinsic value in the long run
- Margin of safety provides downside protection
- Patience is the core competitiveness of value investors
| Dimension | Traditional Value Investment | InvestingPro-Style Data-Driven |
|---|---|---|
Analysis Tools |
Financial report analysis + qualitative research | Multi-model quantitative framework[1][2] |
Information Sources |
Company announcements + industry research | Big data + analyst consensus[2] |
Decision Basis |
Subjective judgment + experience rules | Quantitative signals + probability assessment |
Coverage Scope |
Deep coverage of a few targets | Broad monitoring of the entire market[2] |
Applicable Crowd |
Professional investors | Institutional + individual investors[1] |
-
Build Your Own Valuation Framework
- Learn basic methods like DCF and relative valuation
- Focus on multiple indicators such as P/E, P/B, and EV/EBITDA
- Conduct cross-validation with analyst expectations
-
Focus on “Quality + Value” Dual Factors
- The LEG case shows high ROE (27.49%) with low valuation is a strong signal[0]
- Avoid pure “cheapness” and focus on financial health
-
Adopt Phased Position Building Strategy
- Valuation repair time is uncertain; phased entry reduces timing risk
- Set stop-loss discipline to prevent “value traps”
-
Use Tools to Assist Decision-Making
- Reference quantitative signals from platforms like InvestingPro
- But understand model assumptions and avoid mechanical application
- Reference multi-model integration frameworks to enhance decision robustness
- Combine deep fundamental research with quantitative signals to improve win rate
- Establish systematic value stock screening and tracking systems
Although InvestingPro’s methodology performed well in cases like LEG, investors should note:
- Historical Performance Does Not Represent Future Results:Each case has different macro environments and industry backgrounds
- Model Risk:Any valuation model is based on assumptions; wrong assumptions may lead to misjudgment
- Market Efficiency:As information spreads faster, extreme pricing errors may decrease
- Execution Difficulty:Identifying opportunities is easy, but long-term holding requires strong psychological quality
InvestingPro’s “undervalued” judgment on Leggett & Platt achieved significant gains, essentially due to the resonance of
- High-Quality Data Sources(S&P Global level)[2]
- Multi-Model Cross-Validation Mechanism[1][2]
- Ability to Identify Extreme Pricing Errors[3][4]
- Sufficient Patience to Wait for Value Repair
For investors, understanding the logic behind this methodology is more important than mechanical replication. The essence of value investment is always
[0] Jinling API Data - Stock Prices, Financial Indicators, DCF Valuation, Technical Analysis
[1] InvestingPro Support - “InvestingPro’s Fair Value” (https://pro.investing-support.com/hc/en-us/articles/4408902181137-InvestingPro-s-Fair-Value)
[2] InvestingPro Support - “InvestingPro’s Fair Value methodology” (https://www.investing-support.com/hc/en-us/articles/360017732117-InvestingPro-s-Fair-Value)
[3] Investing.com - “InvestingPro’s Fair Value model predicted Bullish’s 45% stock collapse” (https://www.investing.com/news/investment-ideas/investingpros-fair-value-model-predicted-bullishs-45-stock-collapse-93CH-4367171)
[4] Investing.com - “InvestingPro’s fair value model accurately predicted Atai’s 35% decline” (https://www.investing.com/news/investment-ideas/investingpros-fair-value-model-accurately-predicted-atais-35-decline-93CH-4422841)
Insights are generated using AI models and historical data for informational purposes only. They do not constitute investment advice or recommendations. Past performance is not indicative of future results.
About us: Ginlix AI is the AI Investment Copilot powered by real data, bridging advanced AI with professional financial databases to provide verifiable, truth-based answers. Please use the chat box below to ask any financial question.