Empirical Analysis of Asset Class Performance and Allocation Strategies in 2025
Unlock More Features
Login to access AI-powered analysis, deep research reports and more advanced features

About us: Ginlix AI is the AI Investment Copilot powered by real data, bridging advanced AI with professional financial databases to provide verifiable, truth-based answers. Please use the chat box below to ask any financial question.
Related Stocks
I will first summarize the roles and actual performance of various asset classes in 2025, then analyze the empirical effects of different asset allocation strategies in 2025, and finally provide allocation recommendations under the current market environment.
- Role Definition:Provide the core growth engine of the portfolio, bear the main risk exposure, suitable for long-term holding.
- Empirical Performance in 2025:
- US stocks generally rose; the S&P 500 Index, Nasdaq Composite Index, and Dow Jones Industrial Average rose by approximately 2.95%, 3.09%, and 4.89% respectively from October to the end of December 2025 [0]. As of the end of December, the S&P 500 Index hovered around the historic high of approximately 6930 points, while the Nasdaq Index and Dow Jones Index were around 23593 points and 48711 points respectively [1, 2].
- Sector performance diverged significantly: Communication Services, Real Estate, Consumer Staples, and Materials sectors rose by approximately 0.70%, 0.38%, 0.24%, and 0.19% in the latest trading day, while Technology, Industrials, Healthcare, Financials, Energy, Utilities, and Consumer Discretionary sectors fell [0]. This highlights the necessity of sector diversification and rotation.
- Role Definition:Provide stable cash flow and defensive protection, buffer portfolio volatility when the stock market falls or the economy slows.
- Empirical Performance in 2025:
- Driven by the Federal Reserve’s three interest rate cuts in 2025, the US bond market achieved an “all-round rise”: As of December 17, 2025, the US Aggregate Bond Index rose by approximately 7.05%, the US Treasury Index rose by approximately 6.16%, the US Investment Grade Corporate Bond Index rose by approximately 7.42%, and the US High Yield Bond Index rose by approximately 8.01% [4].
- Despite the overall good performance of US bonds, long-term bonds experienced significant volatility. Taking TLT (long-term US bond ETF) as an example, its 2025 interval return was only 0.19%, but the maximum drawdown reached -9.56%, with an annualized volatility of approximately 12.06% [0]. This indicates that while bonds provide stability, their internal duration and credit risk still require refined management.
- Role Definition:Hedge geopolitical risks, inflation, and currency fluctuations, and play “insurance” and “rotation” roles in specific phases.
- Empirical Performance in 2025:
- Spot gold performed strongly in 2025, with a cumulative annual increase of over 60% and setting more than 50 historic highs, reaching a historic peak of 4381 USD/oz in October [3]. Gold’s strength was jointly driven by “rising geopolitical and economic uncertainty, weakening US dollar, and sustained price momentum trends” [3].
- Despite the excellent performance of spot gold, some gold-related tools (such as futures contracts) experienced significant drawdowns in 2025 (with an interval drawdown of approximately -42% based on partial tool data statistics), highlighting the importance of tool selection [0].
- Role Definition:Provide liquidity, safety, and reinvestment opportunities, and wait for better entry points when the market is uncertain.
- Current Background:Against the backdrop of the stock market approaching historic highs at the end of 2025, a moderate cash allocation helps maintain flexibility and optionality in future market volatility [1, 2].
By simulating 2025 data, we can quantify the risk-return characteristics of different allocation strategies:
- Aggressive Allocation (70% Stocks/15% Bonds/15% Gold):Annual return of approximately 23.11%, annualized volatility of approximately 14.38%, maximum drawdown of approximately -13.32%, Sharpe ratio of approximately 1.40 [0]. This strategy achieved high returns in 2025, but volatility and drawdown were also relatively large.
- Balanced Allocation (50% Stocks/30% Bonds/20% Gold):Annual return of approximately 22.56%, annualized volatility of approximately 11.58%, maximum drawdown of approximately -9.48%, Sharpe ratio of approximately 1.69 [0]. With similar returns, this strategy significantly reduced volatility and drawdown, resulting in better risk-adjusted returns.
- Conservative Allocation (30% Stocks/50% Bonds/20% Gold):Annual return of approximately 18.47%, annualized volatility of approximately 9.78%, maximum drawdown of approximately -6.61%, Sharpe ratio of approximately 1.58 [0]. This strategy controlled drawdown to the greatest extent, suitable for investors with low risk tolerance.
- All-Stock Allocation (100% Stocks):Annual return of approximately 18.47%, annualized volatility of approximately 19.57%, maximum drawdown of approximately -19.00%, Sharpe ratio of approximately 0.79 [0]. Although the return was similar to the conservative allocation, volatility and drawdown were significantly larger, and risk-adjusted returns were clearly inferior to diversified allocations.
- Traditional 60/40 Stock-Bond Allocation:Annual return of approximately 11.42%, annualized volatility of approximately 13.15%, maximum drawdown of approximately -11.74%, Sharpe ratio of approximately 0.64 [0]. Against the backdrop of gold’s outstanding performance in 2025, multi-asset allocation strategies including gold had more advantages in risk-return ratio.
The following chart further visually shows the performance comparison of these strategies:
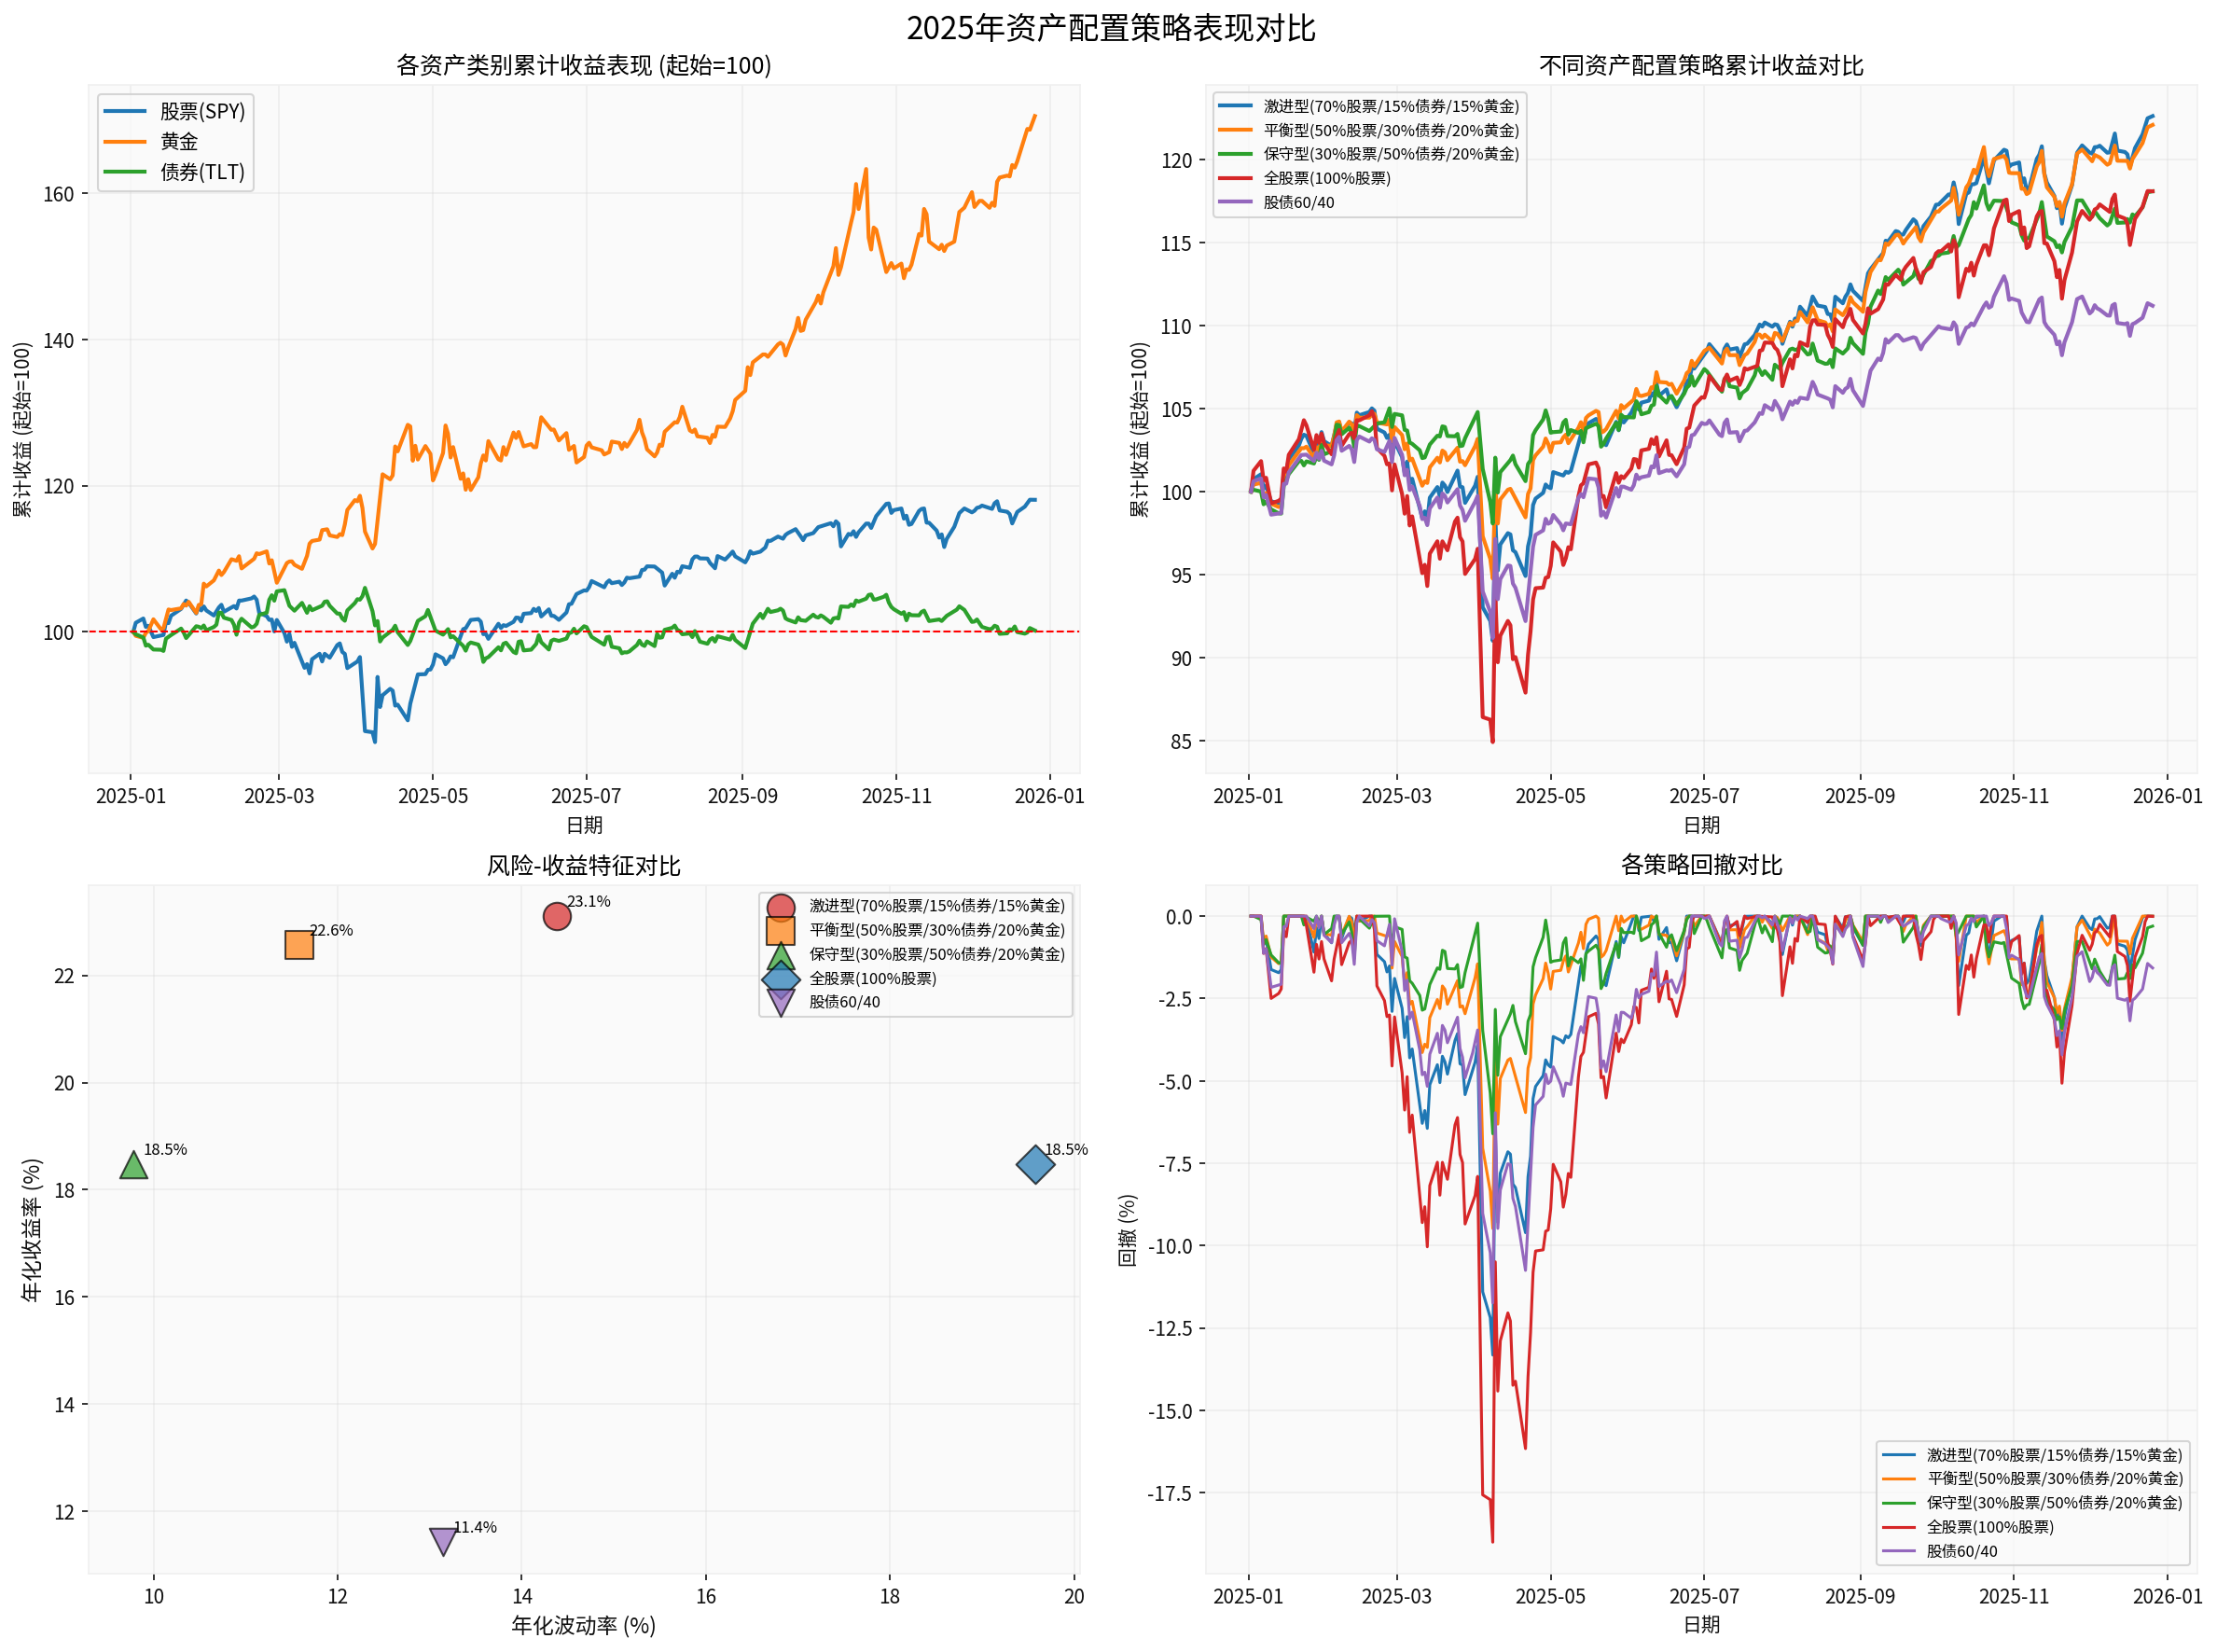
- Top Left:Shows the cumulative return performance of stocks, gold, and bonds in 2025 (starting from 100), reflecting gold’s strong trend, stocks’ steady rise, and bonds’ relative stability.
- Top Right:Shows the cumulative return trends of the five allocation strategies. Multi-asset allocation strategies had obvious advantages in controlling drawdown while maintaining considerable returns.
- Bottom Left:Shows the risk-return characteristics of each strategy. Balanced allocation achieved the lowest volatility at the same return level, reflecting the “free lunch” effect of asset allocation.
- Bottom Right:Shows the drawdown comparison of each strategy. The all-stock strategy had the deepest drawdown, while multi-asset allocation strategies effectively smoothed volatility.
Based on 2025 market data and the latest trends, the following are allocation recommendations based on asset roles:
- Core Allocation (40%-60%):US stocks remain the core engine of long-term growth. The S&P 500 Index hovers near historic highs, indicating market optimism about corporate profit prospects [1, 2]. It is recommended to use low-cost index funds as core allocations.
- Satellite Allocation (10%-20%):Focus on structural opportunities. For example, AI-related sectors performed prominently in 2025, and companies like Nvidia rose against the trend due to partnerships with AI enterprises [1, 2]. At the same time, moderately pay attention to Chinese tech leaders with attractive valuations and European markets benefiting from fiscal stimulus [5].
- Sector Diversification:Given that sectors such as Technology, Industrials, and Healthcare fell in the latest trading day [0], it is recommended to diversify allocations to defensive sectors such as Consumer Staples, Utilities, and Healthcare to reduce portfolio volatility.
- Short-Term and Medium-Term Bonds (20%-30%):Against the backdrop of the Federal Reserve’s three interest rate cuts in 2025, the US bond market rose across the board [4]. Current US bond yields are still at relatively high levels (the 10-year US Treasury yield is around 4.13% [1, 2]). It is recommended to lock in high coupons through short-term to medium-term bonds while reducing interest rate risk.
- Investment Grade Corporate Bonds (5%-10%):The US Investment Grade Corporate Bond Index outperformed Treasuries in 2025 [4]. Under the expectation of a “soft landing”, high-quality corporate bonds offer a good risk-return ratio.
- Cautious Allocation to Long-Term Bonds:Although Wall Street institutions believe that long-term US bonds are expected to benefit from safe-haven funds and moderate economic growth in 2026, the sharp volatility of long-term Treasuries in 2025 still requires vigilance [4]. It is recommended to control long-duration exposure or dynamically manage duration risk through bond ETFs.
- Gold (5%-10%):Gold performed excellently in 2025, rising by more than 60% for the year and hitting many historic highs [3]. Current gold prices are in the historic high range (GLD’s current price is 416.74 USD/oz, at the 52-week high [0]). It is recommended to treat gold as a long-term strategic allocation rather than a short-term trading tool. Against the backdrop of sustained geopolitical and economic uncertainty, gold remains an effective hedging tool and value anchor in investment portfolios [3].
- Other Commodities (0%-5%):Energy and industrial metals can provide inflation protection during economic recovery. Allocate tactically and closely monitor global supply-demand and inventory changes.
- Cash and Short-Term Tools (5%-15%):With the stock market near historic highs, moderate cash positions help seize callback opportunities in the future [1, 2].
- Money Market Funds:Offer risk-free returns at current relatively high interest rates, an effective cash management tool.
The core of asset allocation is to diversify risks and optimize returns through the low correlation of different assets. The 2025 market performance fully verified this principle:
- Risk Balance:Balanced allocation achieved similar returns to aggressive allocation but with lower volatility and drawdown, resulting in better risk-adjusted returns.
- Clear Roles:Stocks for growth, bonds for stability, commodities as phased hedges, and cash for optionality—each asset class has a clear role and together builds a robust portfolio.
- Dynamic Adjustment:As market conditions change (such as Federal Reserve rate cuts, geopolitical risks, sector volatility), investors should regularly review and adjust allocation weights to keep the portfolio’s risk-return characteristics in line with their own risk tolerance.
[0] Jinling API Data
[1] Lianhe Zaobao - “US Stock Market: Light Trading at Year-End, S&P 500 Posts Best Weekly Gain in a Month” (https://www.zaobao.com.sg/finance/world/story20251227-8018573)
[2] Sina Finance - “US Stock Market: S&P 500 Records Largest Weekly Gain in a Month, Nvidia Shares Rise” (https://finance.sina.com.cn/stock/usstock/c/2025-12-27/doc-inheepay0504528.shtml)
[3] Sina Finance - “Up 60% This Year and Hit Over 50 Historic Highs! 2026 Outlook: Gold Unlikely to Plunge Deeply” (https://finance.sina.com.cn/roll/2025-12-29/doc-inhemqav0396869.shtml)
[4] Howbuy Private Equity - “Rate Cuts Continue, All-Round Rise! How to View US Bond Investment Opportunities Ahead?” (https://www.howbuy.com/news/2025-12-25/5829247.html)
[5] Hang Seng Bank - “2026 Asset Allocation Strategy: Diversified Allocation, Steady Progress” (https://www.hangseng.com/cms/ipd/chi/analyses/PDF/allocationsc.pdf)
[6] Jin10 Data - “Goldman Sachs: Gold Will Be ‘Top Commodity’ in 2026, Bullish to 4900 USD” (https://xnews.jin10.com/details/204946)
Insights are generated using AI models and historical data for informational purposes only. They do not constitute investment advice or recommendations. Past performance is not indicative of future results.
About us: Ginlix AI is the AI Investment Copilot powered by real data, bridging advanced AI with professional financial databases to provide verifiable, truth-based answers. Please use the chat box below to ask any financial question.