Ascent Solar (ASTI) Director Forrest Reynolds' 98% Share Reduction Event Analysis
Unlock More Features
Login to access AI-powered analysis, deep research reports and more advanced features
About us: Ginlix AI is the AI Investment Copilot powered by real data, bridging advanced AI with professional financial databases to provide verifiable, truth-based answers. Please use the chat box below to ask any financial question.
Related Stocks
Based on the collected data and analysis, I will provide you with a comprehensive assessment of the share reduction event involving Forrest Reynolds, a director of Ascent Solar (ASTI).
Forrest Reynolds T. (Director) sold
The timing of this reduction is noteworthy:
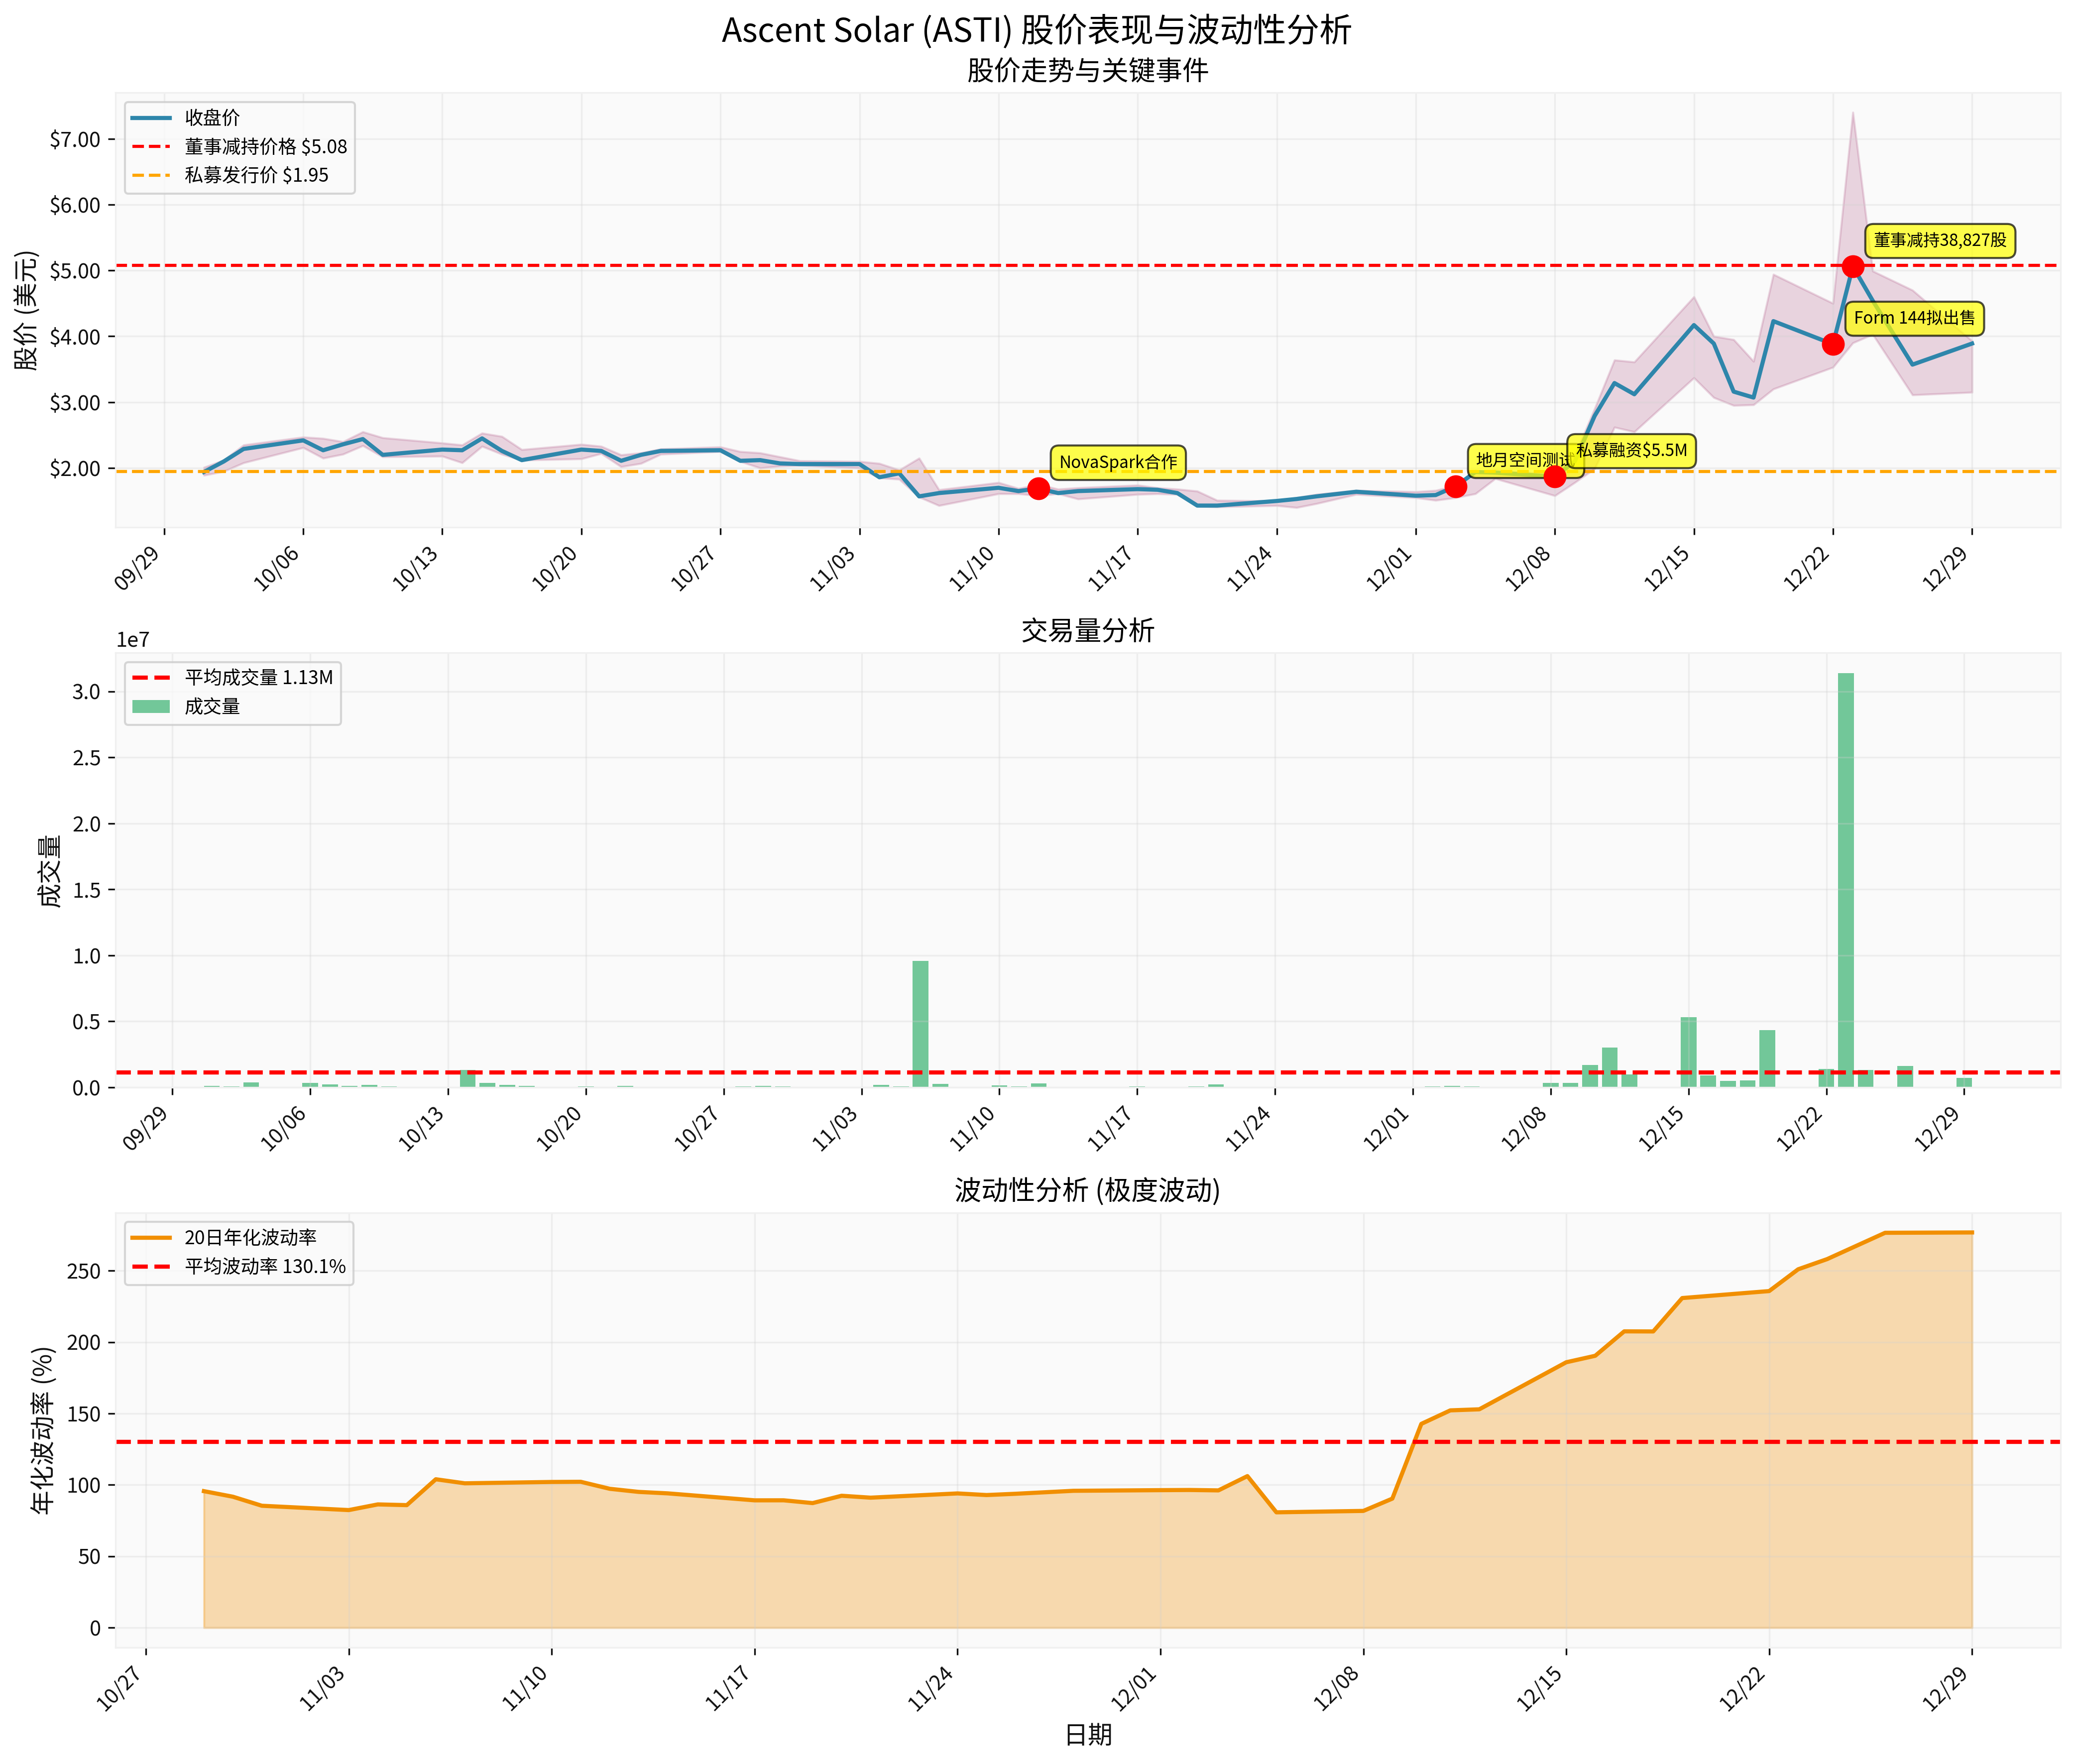
- Reduction price vs current price: $5.08 vs $3.89 (premium of30.6%)[0]
- Reduction price vs private placement price: $5.08 vs $1.95 (premium of160.5%)[0]
- Reduction price vs period high: $5.08 vs $7.40 (31.4%below peak)[0]
The director chose to reduce shares after the stock price pulled back from the high ($7.40) but still enjoyed a significant premium over the private placement price. This indicates that insiders believe there is an
Only two weeks earlier, on December 8, the company conducted a private placement at
- Severe information asymmetry: Insiders know the true value, while external investors pay a high premium
- Valuation confusion: Market pricing for micro-cap stocks is extremely unstable
- Potential dilution risk: The private placement price is significantly lower than the market price, causing severe dilution for existing shareholders
Technical analysis shows ASTI is in a
- Support level: $3.07 (20-day moving average)
- Resistance level: $4.34
- Trend: No clear direction, high volatility
- Beta: 2.3 (extremely high systematic risk)
The director’s reduction occurred at $5.08, far above the current resistance level, which is a
- Insider ownership ratio:10.21%(considered high)[3]
- Institutional ownership ratio: Only10.55%(extremely low institutional participation)[3]
- Key insiders: CEO Paul Warley, Directors David Peterson, Forrest Reynolds, Gregory Thompson[3]
- After the reduction, the director still holds 833 shares and did not fully liquidate, indicating not a complete loss of confidence
- However, the reduction幅度 is as high as 98%(from 38,827 shares to 833 shares), which is astrong bearish signal
- Institutional ownership of only 10.55% indicates a lack of confidence from professional investors in the company
Let’s observe the market reaction to key events:
| Date | Event | Stock Price Reaction |
|---|---|---|
| Nov 12 | Collaboration with NovaSpark Energy | +2.42%[4] |
| Dec 3 | Cislunar space test module supply | +8.18%[4] |
| Dec 8 | $5.5M private placement | -3.11%[4] |
| Dec 22 | Form 144 intended sale notice | To be observed |
| Dec 23 | Director’s share reduction | - |
| Dec 26 | Latest trading day | $3.57 (-21.37%)[3] |
The 21.37% plunge in stock price on December 26 may partially reflect the news of the director’s share reduction.
The impact of insider reduction on investor confidence is reflected in:
- Negative signal transmission: Insiders know the company’s true status best; large-scale reduction is interpreted as “insider bearishness”
- Price suppression effect: After the reduction news is released, buyers become cautious and sellers increase, putting downward pressure on the stock price
- Liquidity concerns: Micro-cap stocks already have insufficient liquidity; insider reduction further hits market depth
- Trust crisis: Investors question why the private placement price was only $1.95 two weeks ago while the director could sell at $5.08
| Indicator | Value | Assessment |
|---|---|---|
| Market cap | $13.25M | Micro-cap, high risk |
| P/E ratio | -1.67x | Operating at a loss |
| ROE | -239.73% | Extremely poor |
| Net profit margin | -1244.98% | Huge losses |
| Operating margin | -1250.35% | No profitability |
| Current ratio | 1.23 | Barely sufficient |
| Quick ratio | 1.03 | Close to danger line |
| P/B ratio | 4.55x | Overvalued |
- Negative return on equity: ROE of -239.73% means the company loses $2.4 for every $1 of capital invested
- Unsustainable losses: Net profit margin of -1244.98% indicates fundamental issues with the company’s business model
- Liquidity risk: Current ratio of 1.23 is close to the danger line (generally considered safe above 2)
Despite poor financial conditions, the company has positive business developments [1]:
- November 12: Signed a cooperation agreement with NovaSpark Energy to combine photovoltaics and mobile hydrogen power generation systems for defense and disaster relief applications
- December 3: Provided thin-film photovoltaic test modules to a leading aerospace company for cislunar spacecraft power generation tests
- December 8: Completed a private placement of up to $5.5M
- 3-year performance: -99.99%[0]
- 5-year performance: -100%[0]
- Past month: +132.32% (abnormal volatility)[0]
- Past 5 days: -20.46% (correction)[0]
This
Possible reasons include:
- Profit taking: The stock price rose from $1.40 to $7.40 (+428%), and insiders locked in profits
- Risk control: Believed current valuation is unsustainable and exited early
- Personal financial needs: Diversified investment portfolio (but the scale of $197k is small, low possibility)
- Company outlook concerns: Insiders know the risk of worsening financial conditions
According to MarketBeat data, ASTI is often compared with companies like Enphase Energy (ENPH) and Solar Integrated Roofing (SIRC) [1]. But key differences:
- ENPH: Profitable, institutional ownership, market cap over $30B
- ASTI: Loss-making, retail-dominated, market cap $13M
- Before reduction: 38,827 shares + 833 shares = 39,660 shares
- After reduction: Only 833 shares remain
- Reduction ratio:98%
This is a
-
Financial risk:
- Sustained huge losses (net profit margin -1244%)
- Negative cash flow
- Possible further equity financing, diluting shareholder rights
-
Valuation risk:-
- High P/B ratio of 4.55x, far above book value
- Annualized volatility of 130.1%, extremely high
- Valuation without profit support is unsustainable
-
Liquidity risk:-
- Average daily volume of 1.13M, but highly volatile
- Prone to manipulation
- Insider reduction further reduces market depth
-
Business risk:-
- Uncertain commercialization prospects of thin-film solar technology
- Uncertainty about whether collaboration projects can generate revenue
- Strong competitors (First Solar, SunPower, etc.)
-
Corporate governance risk:-
- Huge price gap between private placement and reduction
- Questions about information disclosure transparency
- Common management conflicts of interest in micro-cap stocks
Based on technical analysis and event-driven factors:
- Optimistic scenario: Stock price fluctuates between $3.07 and $4.34
- Neutral scenario: Breaks support at $3.07 and tests $2.50
- Pessimistic scenario: Drops back to around the private placement price of $1.95
If you already hold ASTI stock:
- Reassess holding reasons: What is your investment logic? Speculation or investment?
- Strict stop-loss: It is recommended to set a stop-loss level to avoid further losses
- Diversify risk: Do not let a single micro-cap stock account for too much of your portfolio
- Follow subsequent earnings reports: Pay attention to whether there are signs of improvement
If you are considering investing in ASTI:
- Extremely high risk: Extremely poor financial indicators, not suitable for investors with low risk tolerance
- Insider signal: Director’s 98% reduction is a strong warning
- Insufficient liquidity: Large bid-ask spread, difficult to enter and exit
- No valuation support: No profit, high P/B ratio, relying on speculation
- High risk tolerance
- Small speculative positions (no more than 1-2% of the portfolio)
- Fully understand micro-cap stock risks
- Can bear 100% principal loss
If you still decide to hold or invest:
- Position control: Minimal position (<1% of portfolio)
- Stop-loss discipline: Set strict stop-loss (e.g., -20%)
- Take-profit strategy: Micro-cap stocks are highly volatile; take profits in time
- Regular review: Reassess investment logic weekly
- Avoid chasing highs: Do not chase after limit-up moves; easy to get stuck at high levels
-
Insider reduction signal: Forrest Reynolds’ 98% reduction ($197k) is astrong bearish signal, indicating insiders believe the stock price above $5 is overvalued
-
Severe valuation imbalance: The huge gap (160% premium) between the private placement price of $1.95 and the director’s reduction price of $5.08 within two weeks exposes information asymmetry and valuation confusion
-
Worsening financial conditions: ROE of -239% and net profit margin of -1245% indicate fundamental issues with the company’s business model; sustained losses are unsustainable
-
Investor confidence hit: Insider reduction加剧了 market concerns about ASTI; the 21% plunge on December 26 may have already reflected this negative news
-
Asymmetric risk-reward: Limited upside potential (technical resistance at $4.34) and huge downside risk (can drop to $1.95 or lower), not suitable for value investment
- Short-term: Stock price is under pressure, technical breakdown, increased selling pressure
- Medium-term: Investor trust is damaged and may take time to repair
- Long-term: Depends on whether the company can improve financial conditions and convert collaborations into actual revenue
[0] Gilin API Data - ASTI company overview, financial analysis, technical analysis, historical price data
[1] Investing.com - “Forrest Reynolds T, director at Ascent Solar, sells $197k in stock” (https://www.investing.com/news/insider-trading-news/forrest-reynolds-t-director-at-ascent-solar-sells-197k-in-asti-93CH-4424375)
[2] FinViz - ASTI insider trading data (https://finviz.com/quote.ashx?t=ASTI)
[3] MarketBeat - “Ascent Solar Technologies (ASTI) Stock Price, News & Analysis” (https://www.marketbeat.com/stocks/NASDAQ/ASTI/)
[4] StockTitan - “Ascent Solar supplies thin-film PV modules for cislunar tests” (https://www.stocktitan.net/news/ASTI/ascent-solar-technologies-provides-leading-space-company-with-thin-066bmzxpag95.html)
Insights are generated using AI models and historical data for informational purposes only. They do not constitute investment advice or recommendations. Past performance is not indicative of future results.
About us: Ginlix AI is the AI Investment Copilot powered by real data, bridging advanced AI with professional financial databases to provide verifiable, truth-based answers. Please use the chat box below to ask any financial question.