Analysis of Investment Impact on the Energy Sector Following Crude Oil Price Volatility
Unlock More Features
Login to access AI-powered analysis, deep research reports and more advanced features

About us: Ginlix AI is the AI Investment Copilot powered by real data, bridging advanced AI with professional financial databases to provide verifiable, truth-based answers. Please use the chat box below to ask any financial question.
Related Stocks
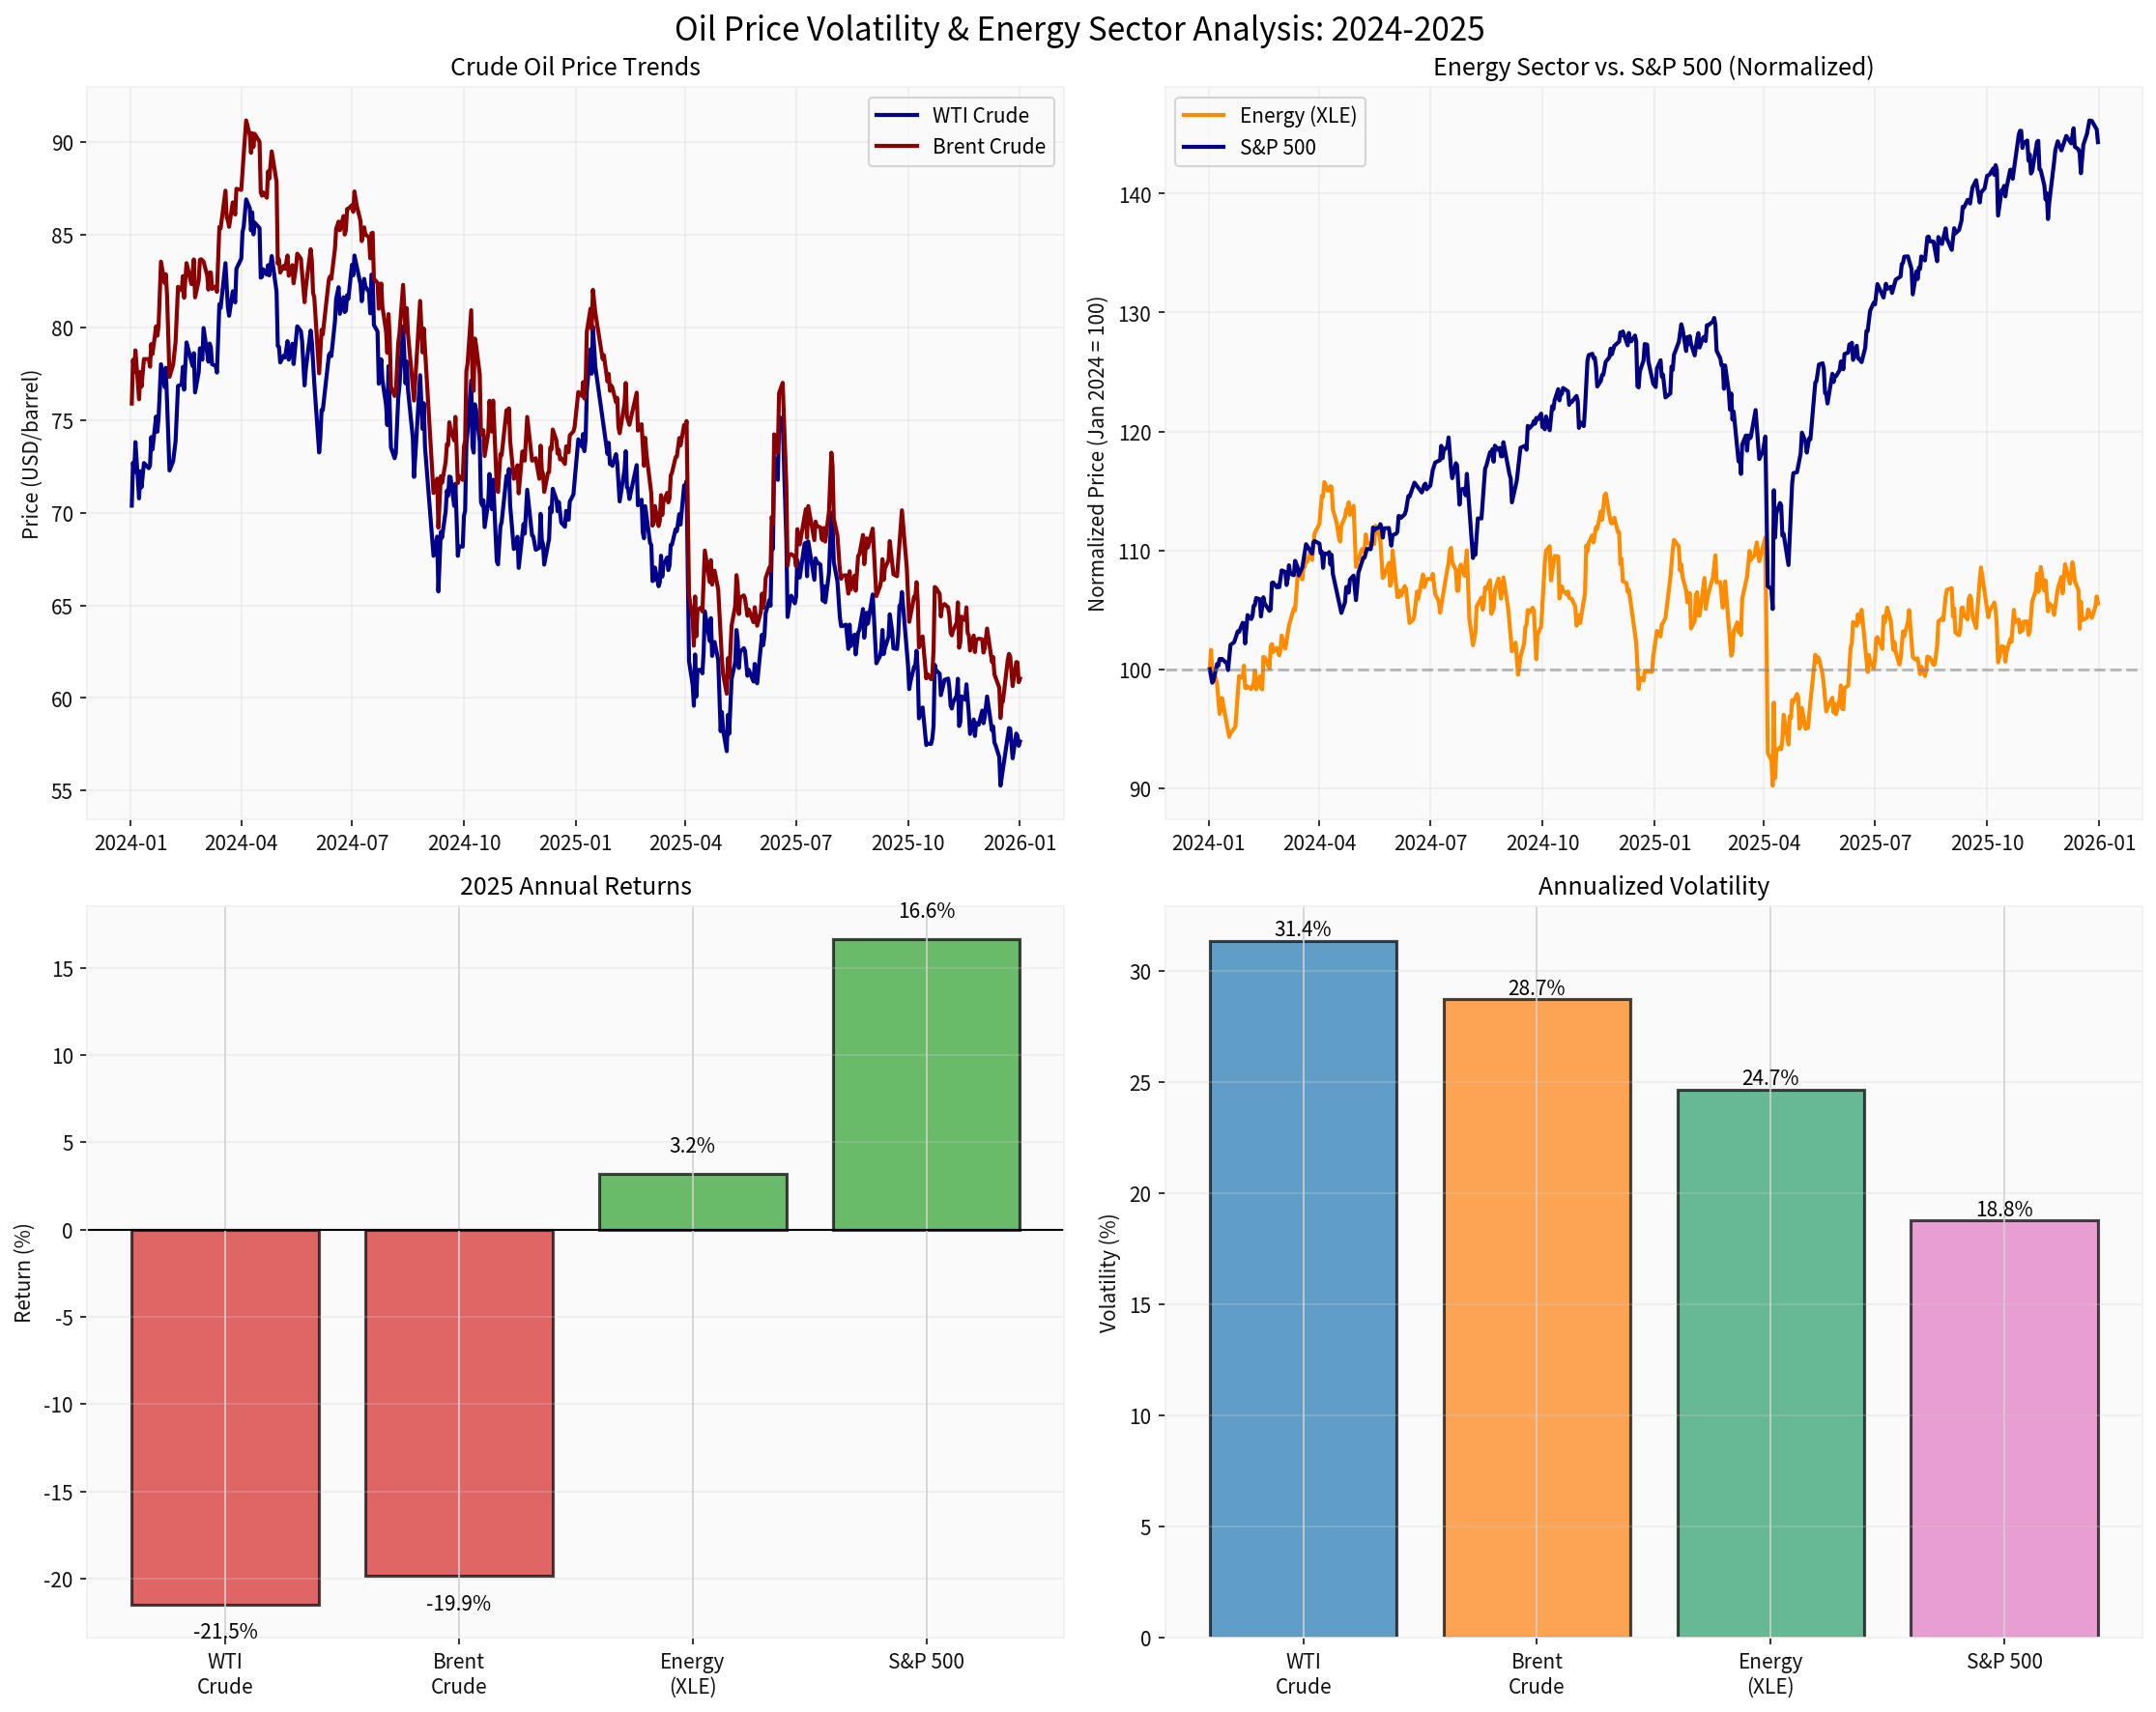
In 2025, the crude oil market experienced its worst annual decline since the 2020 COVID-19 shock. WTI crude oil price fell from $73.13 per barrel to $57.42, a 21.48% annual drop; Brent crude fell from $75.93 to $60.85, a 19.86% decline [0]. This sharp volatility has had a profound impact on energy sector investments and diversified portfolios, creating unique opportunities and risks for investors.
According to data [0], the crude oil market experienced the following key changes in 2025:
| Indicator | Initial Price | End Price | Annual Return | Annualized Volatility |
|---|---|---|---|---|
| WTI Crude Oil | $73.13 | $57.42 | -21.48% | 31.36% |
| Brent Crude Oil | $75.93 | $60.85 | -19.86% | 28.72% |
| Energy ETF (XLE) | $43.33 | $44.71 | +3.18% | 24.67% |
| S&P 500 Index | 5868.55 | 6845.50 | +16.65% | 18.79% |
According to the latest market news [1,2,3], the main driving factors for the crude oil price drop include:
- OPEC+ Gradually Lifts Production Cuts: After strict production cuts from 2023 to 2024, OPEC+ gradually relaxed production restrictions in 2025, increasing market supply [2]
- U.S. Production Hits Record: U.S. crude oil production reached a record 13.87 million barrels per day in October 2025, further exacerbating the supply surplus [1]
- Geopolitical Premium Fades: Despite ongoing geopolitical tensions, the impact of sanctions on Russia, Iran, and Venezuela has weakened
- Expectations of slowing global economic growth
- Accelerated energy transition leads to uncertain long-term demand prospects
- Tariff policies of the U.S. and other economies affect trade flows
The annualized volatility of the crude oil market reached 31.36% (WTI) and 28.72% (Brent), significantly higher than the S&P 500’s 18.79% [0]. This high volatility reflects:
- Supply Surplus Risk: Market concerns about ongoing supply surplus
- Geopolitical Uncertainty: Geopolitical events such as Ukrainian drone attacks on Russian oil facilities and U.S. blockades of Venezuelan exports caused price fluctuations [1]
- Policy Uncertainty: Uncertainty in trade policies and sanctions
Although energy companies’ businesses are closely related to crude oil prices, there was a significant divergence between the energy sector’s performance and crude oil prices:
- Energy ETF (XLE) rose slightly by 3.18% in 2025, far below the S&P 500’s 16.65% gain [0]
- The energy sector underperformed the broader market by 13.47 percentage points, indicating the market’s cautious attitude toward energy stocks
- Relatively High Volatility: XLE’s 24.67% annualized volatility is higher than the S&P 500, showing the high-risk nature of energy stocks
- Current Market Cap: $50.749 billion
- P/E Ratio: 17.40x (Reasonable Valuation)
- ROE:11.42% (Stable Profitability)
- Annual Performance: +12.14% (Significantly Outperformed XLE ETF)
- Analyst Target Price: $143.00 (18.8% Upside Potential)
- Rating Distribution:42.3% Buy,50.0% Hold
- Current Market Cap: $30.472 billion
- P/E Ratio:21.49x (Slightly Overvalued)
- ROE:8.01% (Lower Than ExxonMobil)
- Annual Performance:+3.89% (In Line With Sector)
- Analyst Target Price:$169.00 (10.9% Upside Potential)
- Rating Distribution:64.0% Buy,32.0% Hold
The valuation levels of the energy sector are divergent:
- Overall valuation is in a reasonable range relative to historical levels
- High dividend yield provides income buffer
- Strong cash flow supports dividends and buybacks
- Uncertainty in long-term demand prospects suppresses valuation
- Policy pressure from energy transition
- ESG investment trends lead to capital outflows
For investors with energy exposure, the 2025 crude oil price drop brought the following challenges:
- Investors directly holding crude oil futures or related ETFs suffered significant losses
- Energy stocks failed to provide sufficient hedging protection
- The overall energy sector became a drag on the portfolio
- High volatility of energy assets (31.36%) increases overall portfolio risk
- The correlation between the energy sector and the market may rise during periods of stress
- Reduces the risk-adjusted return of the portfolio
Despite poor short-term performance, energy assets still have important value in diversified portfolios:
- Historically, energy prices have performed well during periods of rising inflation
- Physical assets can hedge against currency depreciation risk
- The current low-price environment may be an entry point for long-term inflation hedging
- The correlation between the energy sector and other asset classes is relatively low
- Provides uncorrelated returns in certain economic cycle stages
- Especially the safe-haven value during geopolitical events
According to the analysis of professional institutions [7,8,9], 2026 investment strategies should consider the following factors:
- Diversification Remains Key: Global diversification, inflation and currency hedging, and commodity allocation are crucial in 2026 [8]
- Hedge Fund Strategies: Equity Long-Short (ELS) strategies are attractive in 2026, providing defensiveness while retaining growth potential [7]
- Physical Asset Allocation: Commodities such as gold, silver, and crude oil may perform well in an inflationary environment [8]
- The most attractive energy stocks for 2026 include:
- Occidental Petroleum (OXY)
- Venture Global LNG (VG)
- Devon Energy (DVN)
- Energy Transfer (ET)
- EOG Resources (EOG)
- SLB (SLB)
- Diamondback Energy (FANG)
- Cheniere Energy (LNG)
- ONEOK (OKE)
- Baker Hughes (BKR)
- Selective Allocation: Avoid blind allocation of the entire energy sector; focus on financially sound, low-cost leading enterprises
- Focus on Dividend Yield: In a low oil price environment, high dividend stocks provide income buffer
- Technical Analysis Entry Points: Crude oil prices are highly volatile; wait for technical confirmation signals
- Value Investment Opportunities: Current valuations may provide long-term value investment opportunities
- Focus on Industry Consolidation: The low-price environment may drive industry M&A activities
- Beneficiaries of Energy Transition: Focus on natural gas, LNG, and renewable energy transition enterprises
- Structural Transformation Investment: Invest in energy transition and clean technologies
- Cyclical Investment: Use the cyclical characteristics of the energy industry for contrarian investment
- ESG Screening: Focus on environmental, social, and governance factors while seeking returns
- Core Position (70-80%): Diversified index funds and low-correlation assets
- Satellite Position (20-30%): Tactical allocation including the energy sector
- Commodities (5-10%): Including energy, precious metals, and agricultural products
- Private Energy Funds: Provide professional management for high-net-worth investors
- Infrastructure Investment: Energy infrastructure provides stable returns
- Regular Rebalancing: Adjust energy exposure according to market changes
- Hedging Strategies: Use options and futures to hedge commodity price risks
- Dynamic Allocation: Dynamically adjust weights according to economic cycles and oil price cycles
- Sustained Supply Surplus Risk: If global supply continues to exceed demand, prices may be under long-term pressure
- Accelerated Energy Transition: The global transition to renewable energy may suppress fossil fuel demand in the long term
- Policy Uncertainty: Changes in U.S. policies and international trade frictions affect market dynamics
- ESG Investment Trends: Institutional investors reducing fossil fuel investments may affect sector valuations
- Geopolitical Risks: Geopolitical events such as the situation in the Middle East and the Russia-Ukraine conflict may cause sharp price fluctuations
The sharp adjustment in crude oil prices in 2025 has created a complex investment environment for energy investments. Despite the poor short-term performance of the energy sector, valuations are reasonable, dividend yields are high, and energy assets still have strategic value in inflation hedging and portfolio diversification.
For diversified investors, it is recommended to adopt a selective, dynamic energy allocation strategy, focus on financially sound leading enterprises, and strictly manage risk exposure. In 2026, as the market re-evaluates supply and demand balance, the energy sector may provide attractive risk-adjusted return opportunities.
[0] Gilin API Data - Crude oil prices, energy ETFs, market indices, and company financial data
[1] Business Times - “Oil edges higher following biggest annual loss since 2020” (https://www.businesstimes.com.sg/companies-markets/energy-commodities/oil-edges-higher-following-biggest-annual-loss-2020)
[2] KSL.com - “Oil set for biggest annual drop since 2020” (https://www.ksl.com/article/51425246/oil-set-for-biggest-annual-drop-since-2020)
[3] Investing.com - “Oil prices set for biggest annual slump since 2020 as supply glut weighs” (https://www.investing.com/news/commodities-news/oil-prices-set-for-biggest-annual-slump-since-2020-as-supply-glut-weighs-4426139)
[7] Cambridge Associates - “2026 Outlook: Diversifier Views” (https://www.cambridgeassociates.com/insight/2026-outlook-diversifier-views)
[8] CIO Investment Club - “8 Best Investment Strategies for 2026: A Guide for Institutional Investors” (https://www.cioinvestmentclub.com/best-investment-strategies-for-2026)
[9] Morningstar - “The Best Energy Stocks to Buy” (https://www.morningstar.com/stocks/best-energy-stocks-buy)
Insights are generated using AI models and historical data for informational purposes only. They do not constitute investment advice or recommendations. Past performance is not indicative of future results.
About us: Ginlix AI is the AI Investment Copilot powered by real data, bridging advanced AI with professional financial databases to provide verifiable, truth-based answers. Please use the chat box below to ask any financial question.