Investment Value Analysis Report of Zijin Mining (601899.SS)
Unlock More Features
Login to access AI-powered analysis, deep research reports and more advanced features
About us: Ginlix AI is the AI Investment Copilot powered by real data, bridging advanced AI with professional financial databases to provide verifiable, truth-based answers. Please use the chat box below to ask any financial question.
Related Stocks
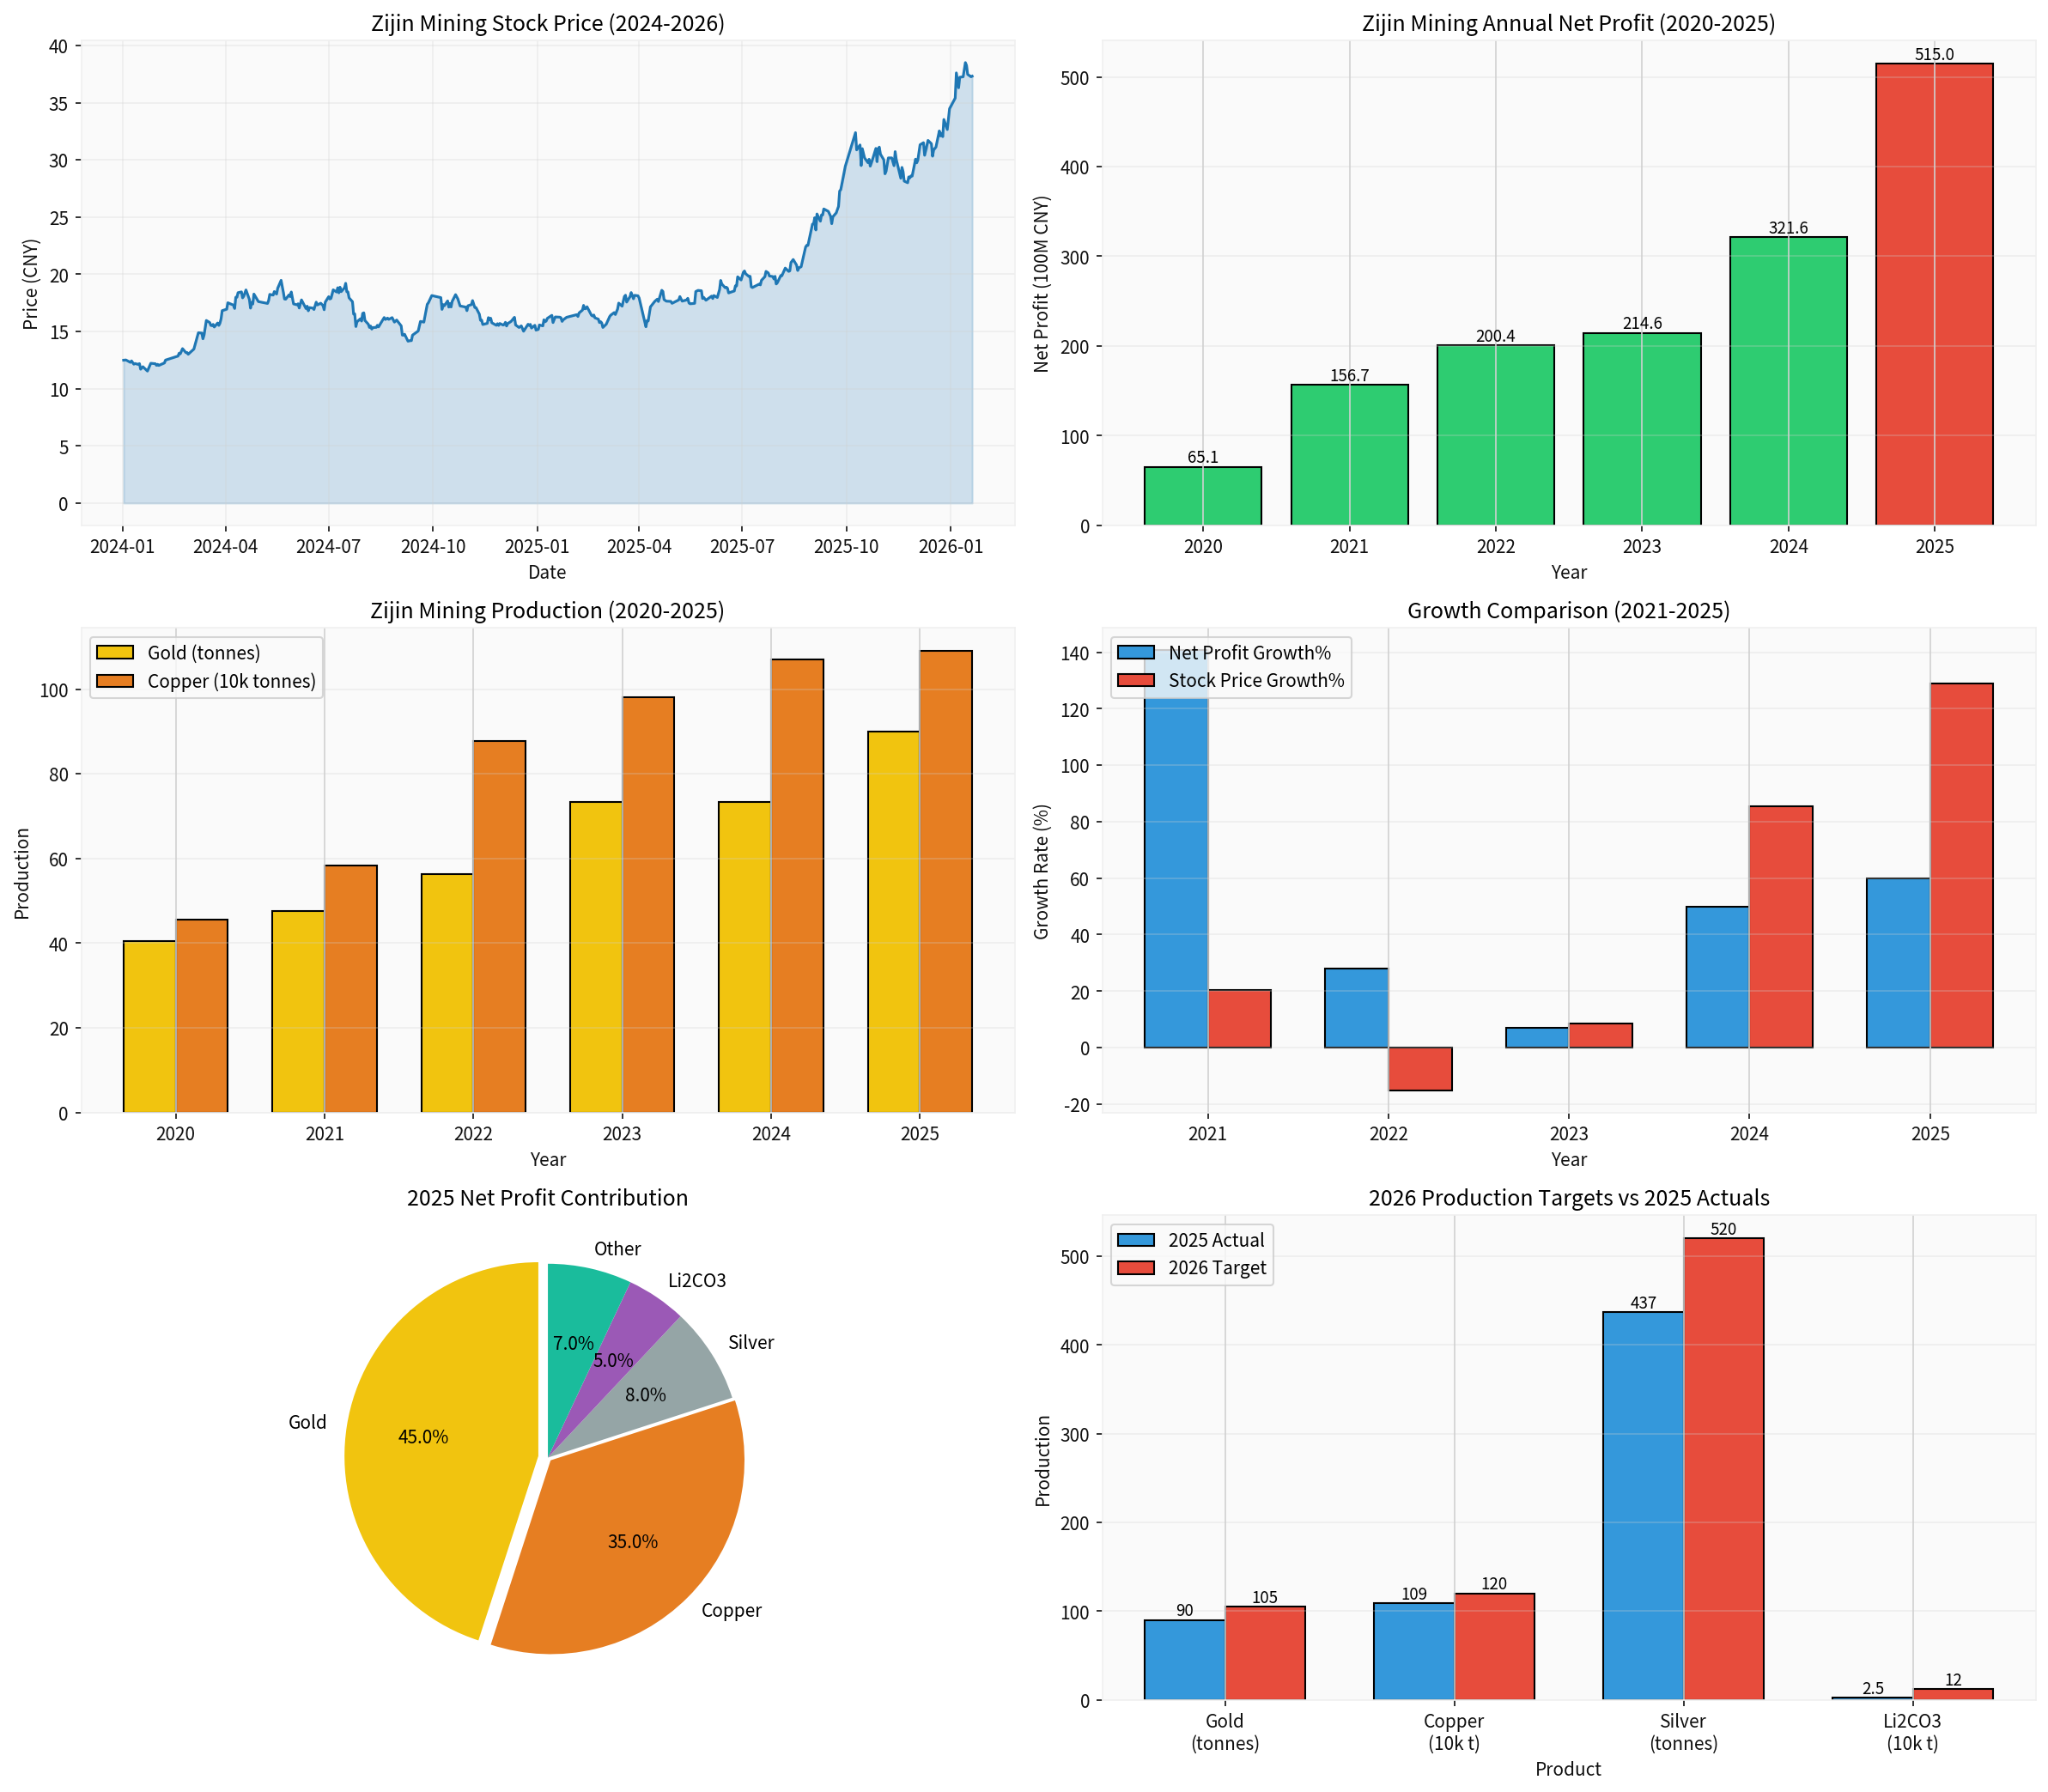
I have now collected sufficient data, let me present an in-depth analysis report of Zijin Mining to you:
According to the 2025 annual performance pre-increase announcement released by Zijin Mining in January 2026, the company expects to achieve a net profit attributable to shareholders of listed companies of
| Indicator | Value | Industry Position |
|---|---|---|
| Market Capitalization | Approx. RMB 990 billion | One of the world’s largest gold mining enterprises |
| ROE (Return on Equity) | 30.60% | Excellent |
| Net Profit Margin | 13.91% | Relatively High |
| P/E (Price-to-Earnings Ratio) | 21.71x | Reasonable Range |
| P/B (Price-to-Book Ratio) | 5.90x | - |
In 2025, the company’s main mineral product output all achieved year-on-year growth:
| Product | 2025 Output | 2024 Output | Year-on-Year Growth |
|---|---|---|---|
| Mined Gold | Approx. 90 tons | 73 tons | +23.3% |
| Mined Copper (including Kamoa) | Approx. 1.09 million tons | 1.07 million tons | +1.9% |
| Mined Silver | Approx. 437 tons | 436 tons | Flat |
| Lithium Carbonate Equivalent | Approx. 25,000 tons | 261 tons | +858% |
In 2025, commodity prices soared, directly enhancing the company’s profitability:
- In 2025, the gold price rose from approximately $2,600 per ounce at the start of the year to approximately $4,381 per ounce at the end of the year, with an annual increase of up to 67%[3][4]
- As of January 20, 2026, the COMEX gold futures price has exceeded $4,766 per ounce, hitting a new all-time high[5]
- Gold became one of the best-performing asset classes globally in 2025
- In 2025, the LME copper price rose by approximately 30%, from around $8,500 per ton at the start of the year to around $12,000 per ton at the end of the year[6]
- In January 2026, the copper price once hit an all-time high of $13,238 per ton[6]
| Institution | 2026 Gold Price Forecast | Potential Increase |
|---|---|---|
| Jefferies Group | $6,600 per ounce | +52% |
| Yardeni Research | $6,000 per ounce | +38% |
| UBS Group | $5,400 per ounce | +24% |
| JPMorgan Chase | $5,055 per ounce | +16% |
| Goldman Sachs Group | $4,900 per ounce | +13% |
- Strong Central Bank Gold Purchasing Demand: Global central banks net purchased 1,045 tons of gold in 2024, and it is expected to remain at a high level of 750-900 tons per year in 2025-2026[4]
- Geopolitical Risks: Tensions in the Middle East and Russia-Ukraine region remain high, supporting gold prices due to safe-haven demand
- Declining US Dollar Credit: The US government’s debt continues to expand, increasing fiscal deficit pressure
- Expectations of Fed Interest Rate Cuts: The start of a monetary easing cycle will benefit gold
- Inflation Hedge: Gold’s allocation value as an inflation-resistant asset is highlighted
| Institution | 2026 Forecast | Core Logic |
|---|---|---|
| Citigroup | $13,000-$15,000 per ton | Persistent Supply Shortage |
| JPMorgan Chase | Average Price of $12,075 per ton | May hit $12,500 per ton in Q2 |
| UBS Group | $11,500-$13,000 per ton | Strong Demand |
| Goldman Sachs | Long-term bullish to $15,000 per ton | Structural Supply-Demand Tightness |
- Energy Transition Demand: Electric vehicles, power grid expansion, and data center construction (AI infrastructure) drive copper demand
- Supply Disruptions: The Grasberg Copper Mine in Indonesia (the world’s second-largest) reduced output by approximately 525,000 tons due to a mudslide accident[6]
- Low Inventory: LME copper inventories continue to decline, leading to tight supply
- US Tariff Policy: A 50% copper import tariff has led to supply chain restructuring, exacerbating regional shortages
Zou Laichang, Chairman of Zijin Mining, disclosed the
| Product | 2025 Actual | 2026 Target | Growth Rate |
|---|---|---|---|
| Mined Gold | 90 tons | 105 tons | +16.7% |
| Mined Copper | 1.09 million tons | 1.2 million tons | +10.1% |
| Mined Silver | 437 tons | 520 tons | +19.0% |
| Lithium Carbonate | 25,000 tons | 120,000 tons | +380% |
- Focus on Gold and Copper Core Businesses: Increase efforts to acquire strategic mineral resources, with gold and copper as the key development minerals
- Lay Out Lithium Sector: Fully form a globally competitive lithium business sector
- Focus on M&A Opportunities: Closely track M&A opportunities for super-large mineral deposits and mid-sized mining companies
- Resource Reserve Increase: Continuously advance global mineral resource layout
| Risk Type | Details |
|---|---|
Price Risk |
Fluctuations in commodity prices may lead to performance volatility |
Geopolitical Risk |
Overseas mine operations face risks such as policy and exchange rate risks |
Cost Pressure |
Rising mining costs may compress profit margins |
Technical Risk |
Mining development has a long cycle with high uncertainty |
Valuation Risk |
Current stock price is high (129% increase in one year), with pullback pressure[0] |
- P/E (Price-to-Earnings Ratio): 21.71x (based on TTM), within a historically reasonable range[0]
- P/B (Price-to-Book Ratio): 5.90x[0]
- Stock Price Performance: 129.04% increase in the past year, far exceeding the industry average[0]
| Indicator | Value | Signal |
|---|---|---|
| MACD | No Crossover | Bullish Bias |
| KDJ | K:50.4, D:64.1, J:23.0 | Bearish Bias |
| RSI | Normal Range | Neutral |
| Beta | 1.35 | Higher than Market Volatility |
- High Certainty of Performance Growth: The 2025 net profit of RMB 51-52 billion validates the company’s growth capability, and the 2026 production target is further raised
- Strong Commodity Price Support: Gold and copper prices are expected to remain high supported by factors such as tight supply-demand structure, geopolitical risks, and declining US dollar credit
- Relatively Reasonable Valuation: A P/E ratio of 21.7x is at a moderately reasonable level among mining cyclical stocks
| Dimension | Evaluation |
|---|---|
Growth |
★★★★★ Continuous production expansion, high-speed growth of lithium carbonate business |
Profitability |
★★★★☆ ROE of 30.6%, strong profitability |
Valuation |
★★★☆☆ Significant stock price increase, short-term adjustment pressure |
Risk |
★★★☆☆ Need to pay attention to the risk of commodity price pullbacks |
- A sharp pullback in gold and copper prices will directly affect the company’s performance
- Current market expectations are high, and the stock price may have already partially reflected positive factors
- Overseas businesses face risks such as exchange rate and geopolitical risks
[1] China Securities Journal - “Gold Prices Remain Red-Hot, Mining-Related Listed Companies See Sharp Performance Pre-Increases” (https://m.cnfin.com/yw-lb//zixun/20260114/4365018_1.html)
[2] Securities Times - “Multiple Non-Ferrous Metal Listed Companies Deliver Outstanding 2025 Performance” (https://finance.eastmoney.com/a/202601213625058987.html)
[3] Sina Finance - “Gold Price Rally Continues at the Start of 2026, Wall Street Remains Bullish on Gold” (https://finance.sina.com.cn/stock/usstock/c/2026-01-18/doc-inhhtasx2162363.shtml)
[4] Securities Times - “Nearly 70% Surge This Year! Spot Gold Hits a New All-Time High!” (https://www.stcn.com/article/detail/3551407.html)
[5] Jinling AI Financial Data System - Real-Time Market Data [0]
[6] Caijing Magazine - “International Copper Price Hits a New All-Time High, Will It Continue to Rise?” (https://m.caijing.com.cn/s/202512/5132400)
[7] CNFOX - “2026 Copper Price Outlook: Institutional Capital Rotation, Supply Shortage and Technical Analysis” (http://forex.cnfol.com/jingjiyaowen/20260119/31954432.shtml)
[8] 21st Century Business Herald - “Shenzhen Shuibei Launches 999.9 Copper Bars, 1kg Fetches Up to RMB 280” (https://www.21jingji.com/article/20260120/herald/63567a1411505d92cf6517e2e9c0e6a1.html)
Insights are generated using AI models and historical data for informational purposes only. They do not constitute investment advice or recommendations. Past performance is not indicative of future results.
About us: Ginlix AI is the AI Investment Copilot powered by real data, bridging advanced AI with professional financial databases to provide verifiable, truth-based answers. Please use the chat box below to ask any financial question.