Technical Signal Analysis of Rongbai Technology (688005) Plunge After Resumption of Trading
Unlock More Features
Login to access AI-powered analysis, deep research reports and more advanced features
About us: Ginlix AI is the AI Investment Copilot powered by real data, bridging advanced AI with professional financial databases to provide verifiable, truth-based answers. Please use the chat box below to ask any financial question.
Related Stocks
Based on the above data analysis, below is a complete technical signal analysis of the 11.16% plunge of Rongbai Technology after resumption of trading:
Rongbai Technology announced on the evening of January 13, 2026 that it had signed a procurement cooperation agreement with Contemporary Amperex Technology Co., Limited (CATL) for lithium iron phosphate cathode materials with an estimated total value of over RMB 120 billion, with an agreement period from Q1 2026 to 2031 and an expected supply of 3.05 million tons of products [1]. Immediately after the announcement was released, the company received an inquiry letter from the Shanghai Stock Exchange (SSE), requiring it to supplement the disclosure of contract details and proof of performance capabilities. From January 14 to 18, Rongbai Technology’s stock was suspended from trading.
On the evening of January 18, in its response to the SSE’s inquiry letter, Rongbai Technology admitted that
| Moving Average | Price | Relationship with Current Price |
|---|---|---|
| 5-day MA | RMB 35.66 | Current price of RMB 33.09 has broken below |
| 10-day MA | RMB 35.54 | Current price of RMB 33.09 has broken below |
| 20-day MA | RMB 34.25 | Current price of RMB 33.09 has broken below |
| Indicator | Value | Signal Status |
|---|---|---|
| DIF(MACD) | 1.3994 | Below zero line |
| DEA(Signal) | 1.6570 | Below zero line |
| MACD Histogram | Negative | Bearish momentum |
| Indicator | Value | Signal Status |
|---|---|---|
| K Value | 41.2 | Weak range |
| D Value | 59.2 | Weak range |
J Value |
5.3 |
Severely oversold |
| Indicator | Value | Signal Status |
|---|---|---|
| RSI(14) | 48.76 | Weak but not oversold |
| Band | Price |
|---|---|
| Upper Band | RMB 39.35 |
| Middle Band | RMB 34.25 |
Lower Band |
RMB 29.15 |
Trading volume data on the day of resumption (January 19) reveals important market behavior signals:
- Opened at the limit-down price of RMB 29.88 per share, but closed at RMB 33.18 per share
- Trading volume increased significantly on the day, showing a game between panic selling and bottom-fishing funds
- The amplitude reached 17.47%, with fierce game between bulls and bears
In the 5 trading days before the suspension (December 30, 2025 to January 10, 2026), the stock price rose by approximately 17% cumulatively, with suspicion of
- First Resistance Level: RMB 35.00 integer level
- Second Resistance Level: 5-day MA (RMB 35.66)
- Third Resistance Level: 10-day MA (RMB 35.54)
- First Support Level: RMB 30.00 integer level
- Second Support Level: Bollinger Bands Lower Band (RMB 29.15)
- Third Support Level: December Low (RMB 25.48)
- Moving Average System: Price broke below all short-term moving averages, forming a bearish alignment
- MACD: Death cross below the zero line, mid-term trend is weak
- KDJ: Both K and D values are in the weak range
- Trading Volume: Obvious panic selling on the resumption day
- Fundamentals: CSRC investigation brings systemic risks
- KDJ J-valueis below 20, severely oversold
- Bollinger Bandslower band provides technical support
- Repair reboundmay occur after consecutive declines
- Short-term: Oversold repair rebound is expected, but the upside is limited
- Mid-term: Wait for stabilization signals, may enter a consolidation and bottom-building phase
- Risk Point: If it breaks below the RMB 30 integer level, a new round of decline may start
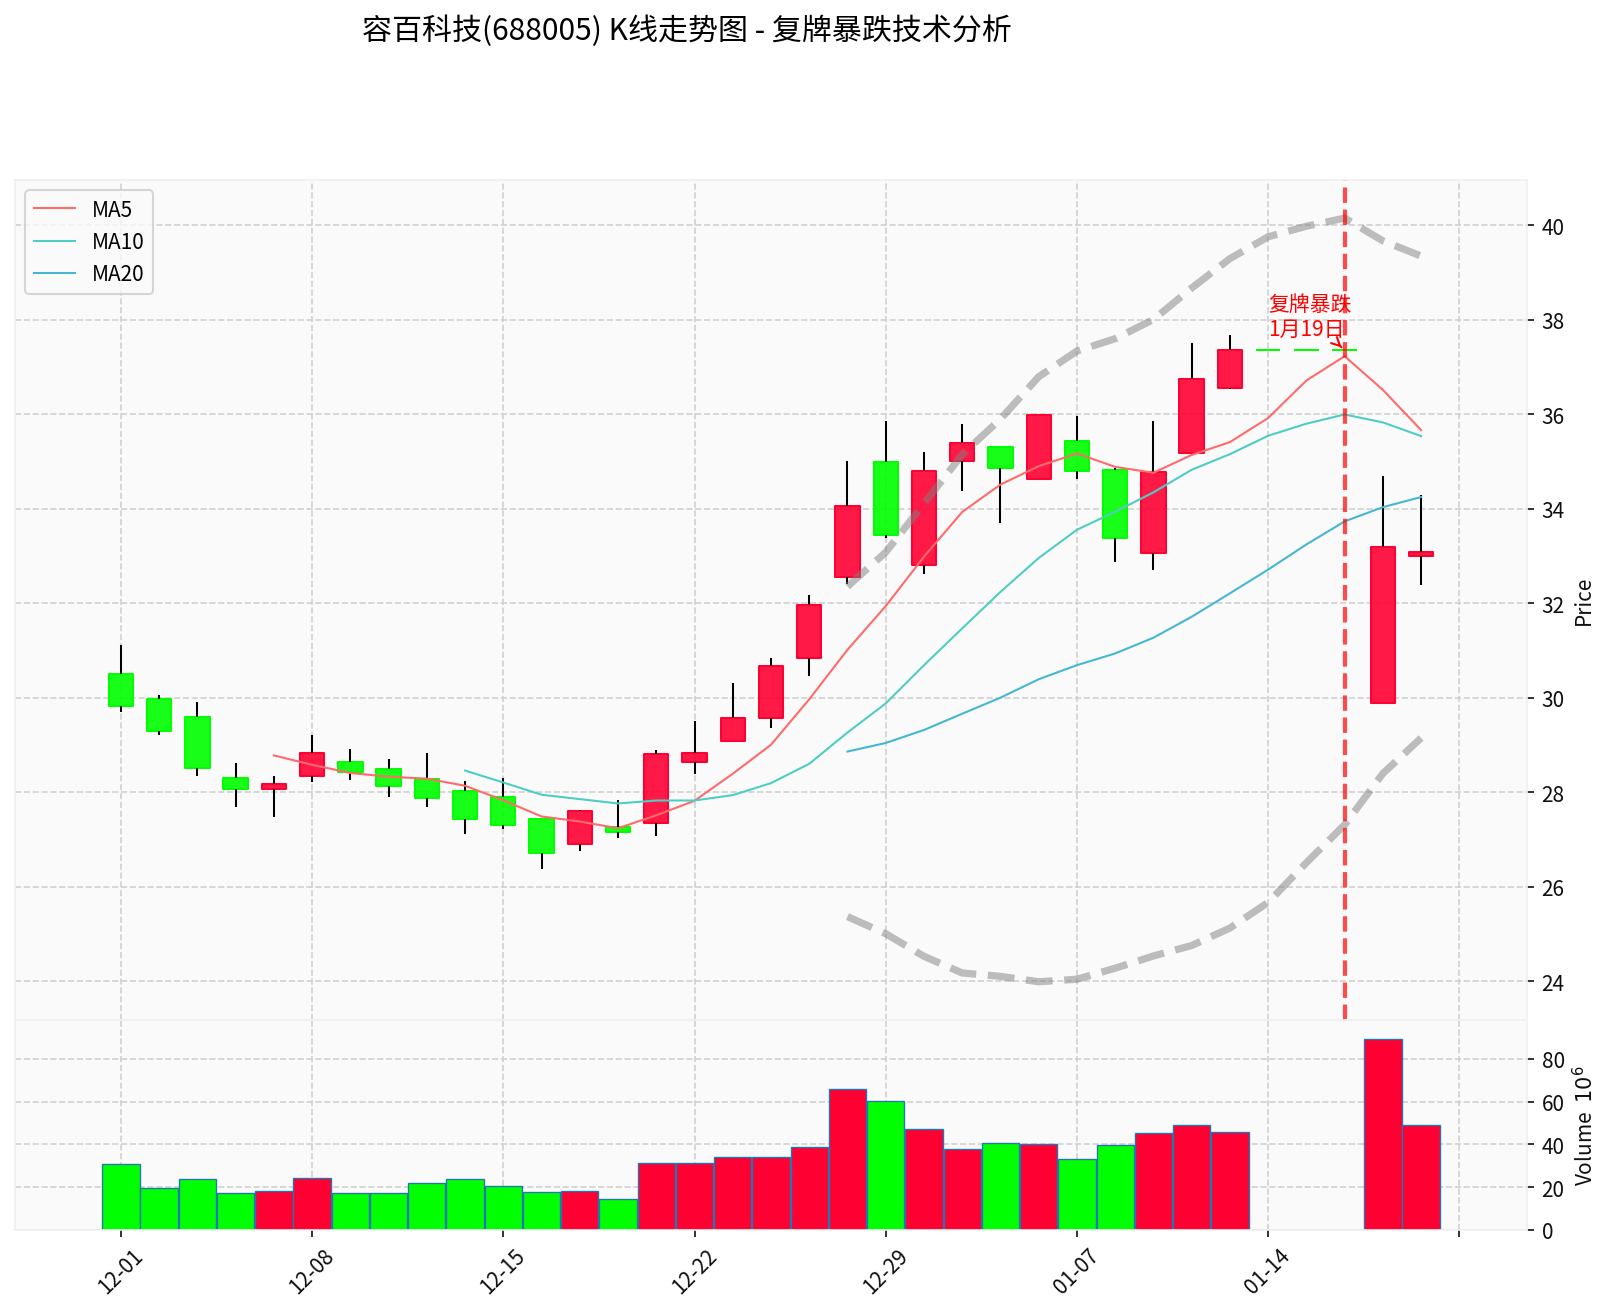
The chart above shows Rongbai Technology’s K-line trend from December 2025 to January 2026, where you can clearly see:
- The uptrend before the suspension (before January 13)
- The technical pattern after the resumption plunge
- The death cross status of the moving average system
- The position of the Bollinger Bands
| Investor Type | Suggestion |
|---|---|
| Risk-averse | Mainly wait and see , wait for stabilization signals |
| Risk-tolerant | Can take small positions to bet on rebound, strict stop-loss |
| Holders | Pay attention to the RMB 30 support level, consider reducing positions if it breaks below |
- Stop-Loss Level: RMB 30.00 integer level
- Take-Profit Level: RMB 34-35 range (near the 5-day MA)
Fundamental bearish factors (CSRC investigation) are in a game with technical oversold conditions. It is recommended that investors closely follow the progress of subsequent regulatory investigations, the company’s actual production capacity, and changes in trading volume. It is advisable to remain cautious before the results of the regulatory investigation are clarified [1][2][3].
[1] Sohu - Behind the CSRC Investigation into Rongbai Technology Over Suspicious RMB 120 Billion Order
[3] Sina Finance - Rongbai Technology’s RMB 100 Billion Order Farce Devastates Its Stock Price
Insights are generated using AI models and historical data for informational purposes only. They do not constitute investment advice or recommendations. Past performance is not indicative of future results.
About us: Ginlix AI is the AI Investment Copilot powered by real data, bridging advanced AI with professional financial databases to provide verifiable, truth-based answers. Please use the chat box below to ask any financial question.