WTI Crude Oil Market Analysis: February 6, 2026
Unlock More Features
Login to access AI-powered analysis, deep research reports and more advanced features

About us: Ginlix AI is the AI Investment Copilot powered by real data, bridging advanced AI with professional financial databases to provide verifiable, truth-based answers. Please use the chat box below to ask any financial question.
Based on comprehensive technical analysis, inventory data, and market fundamentals, here is my assessment of WTI’s marginal gain amid volatile inventories.
| Indicator | Current Value | Signal |
|---|---|---|
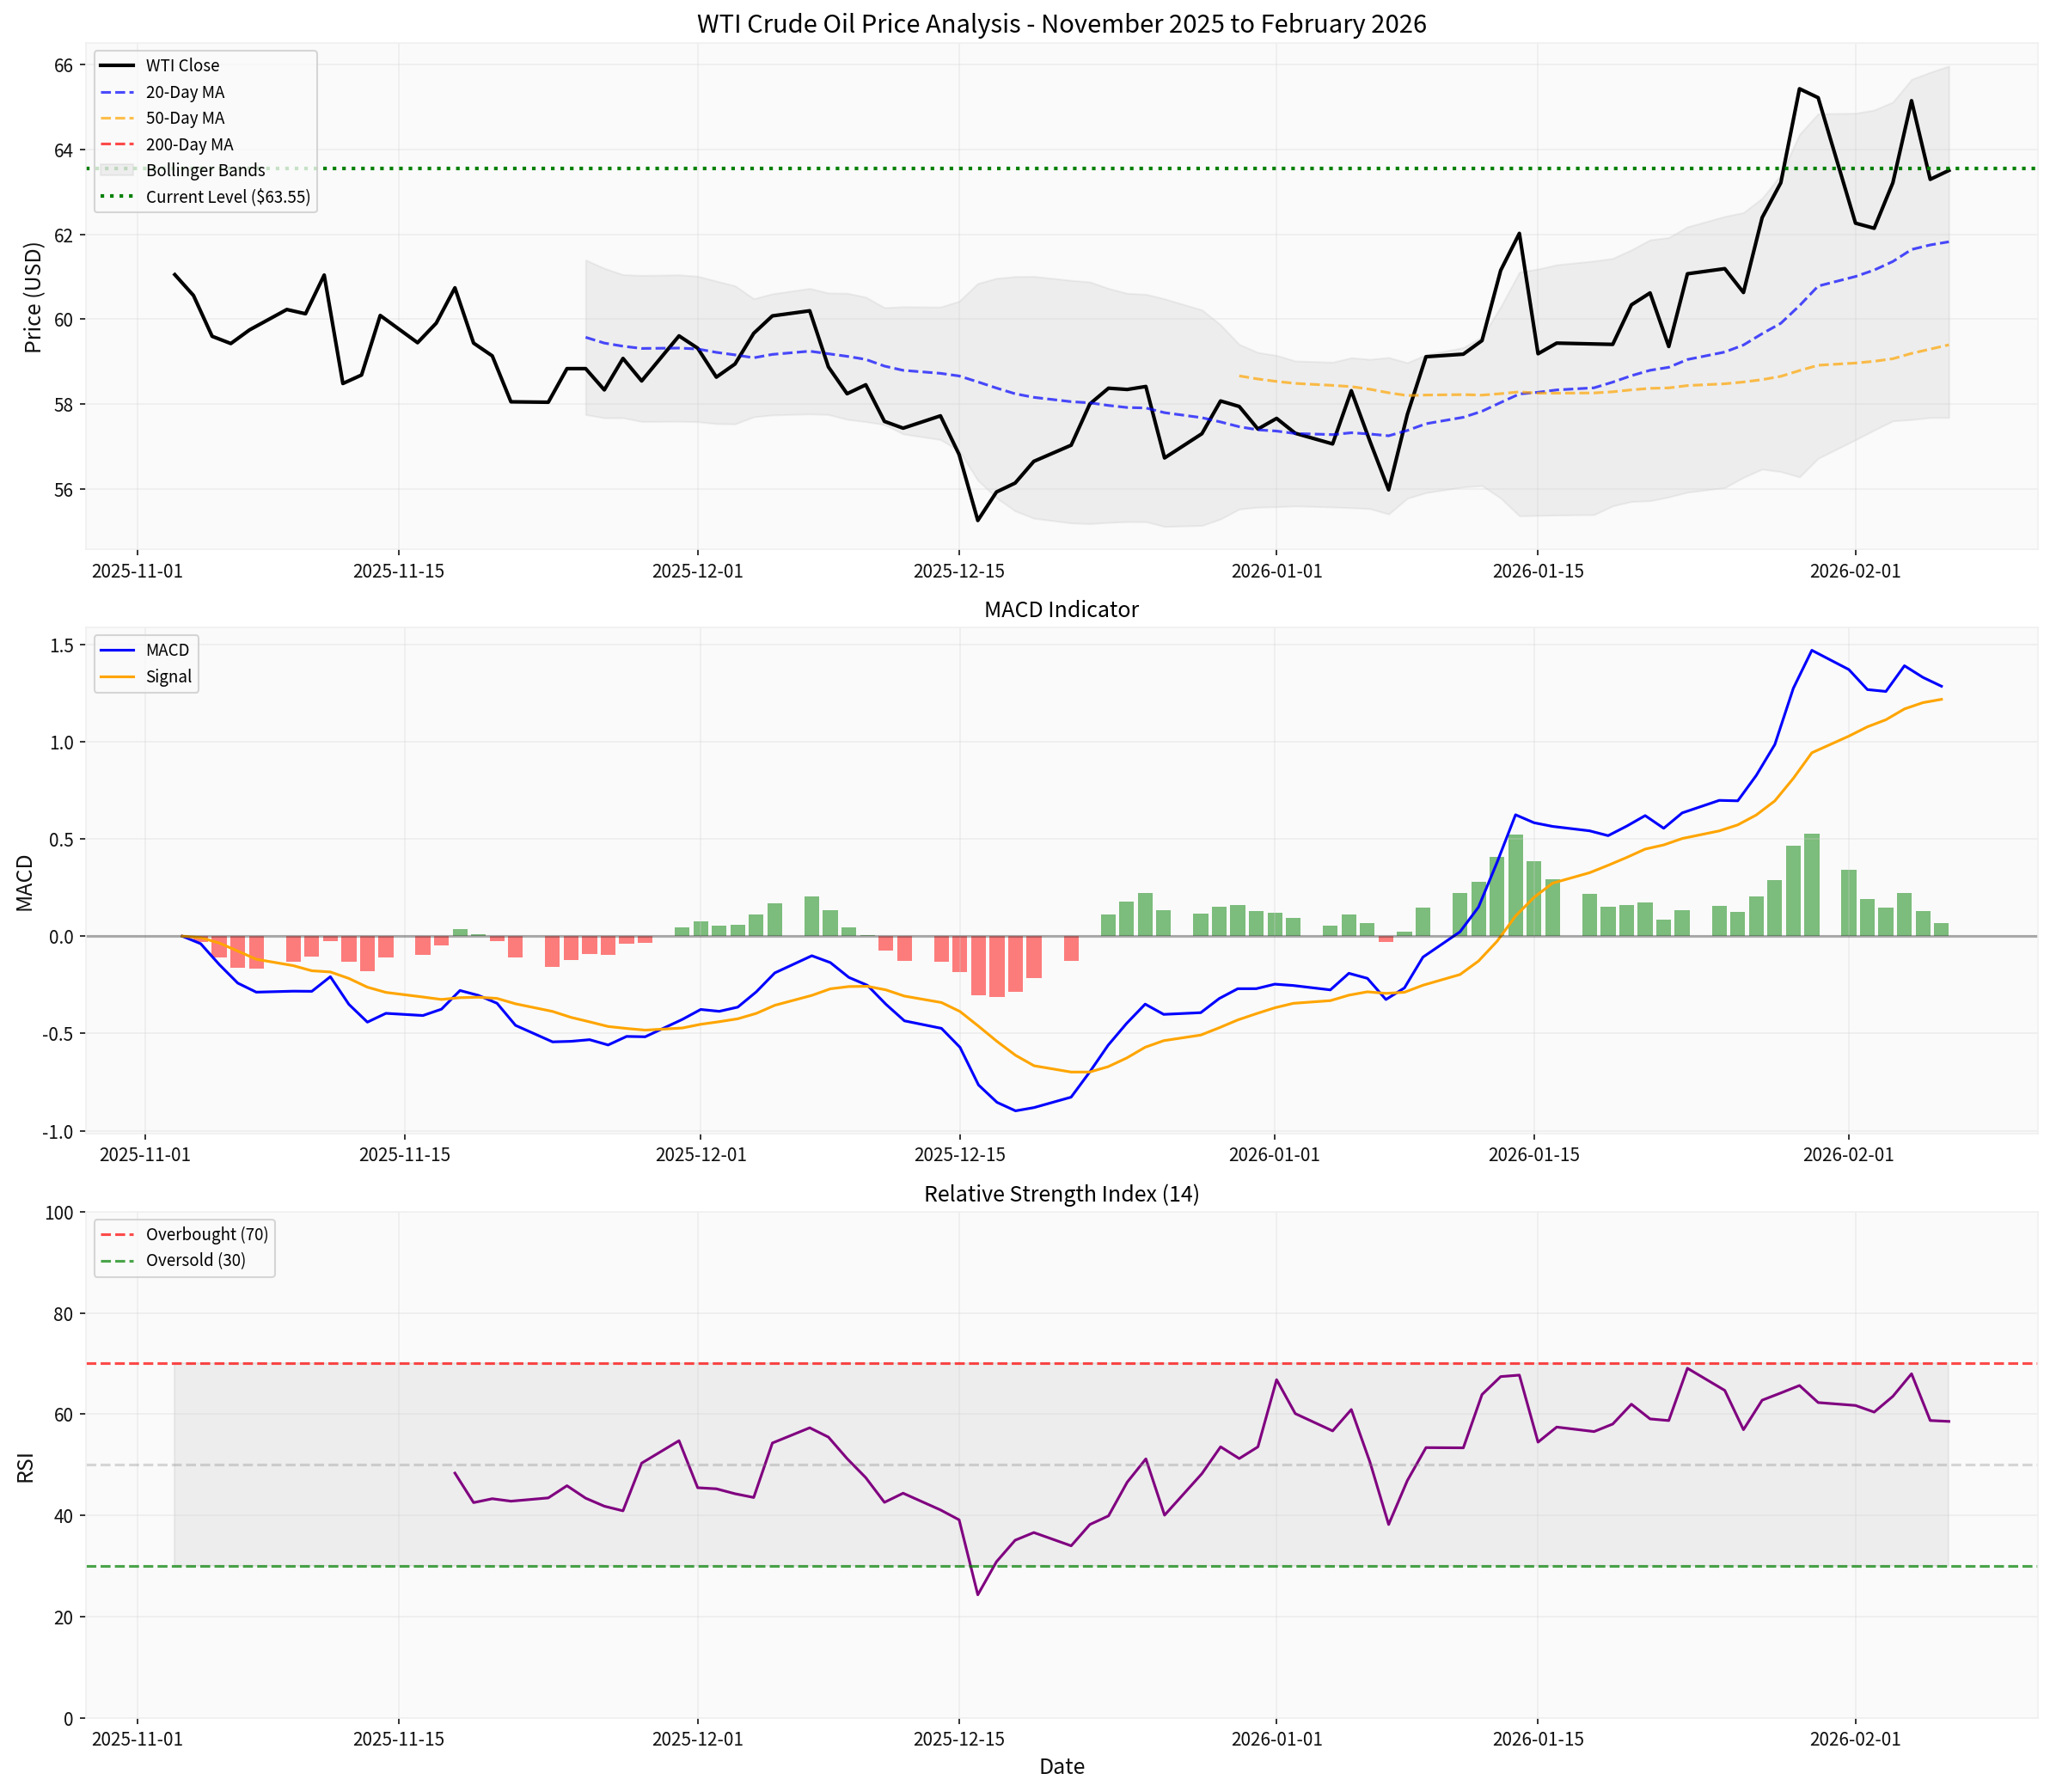
| 20-Day MA | $61.82 | +2.71% above |
| 50-Day MA | $59.40 | +6.90% above |
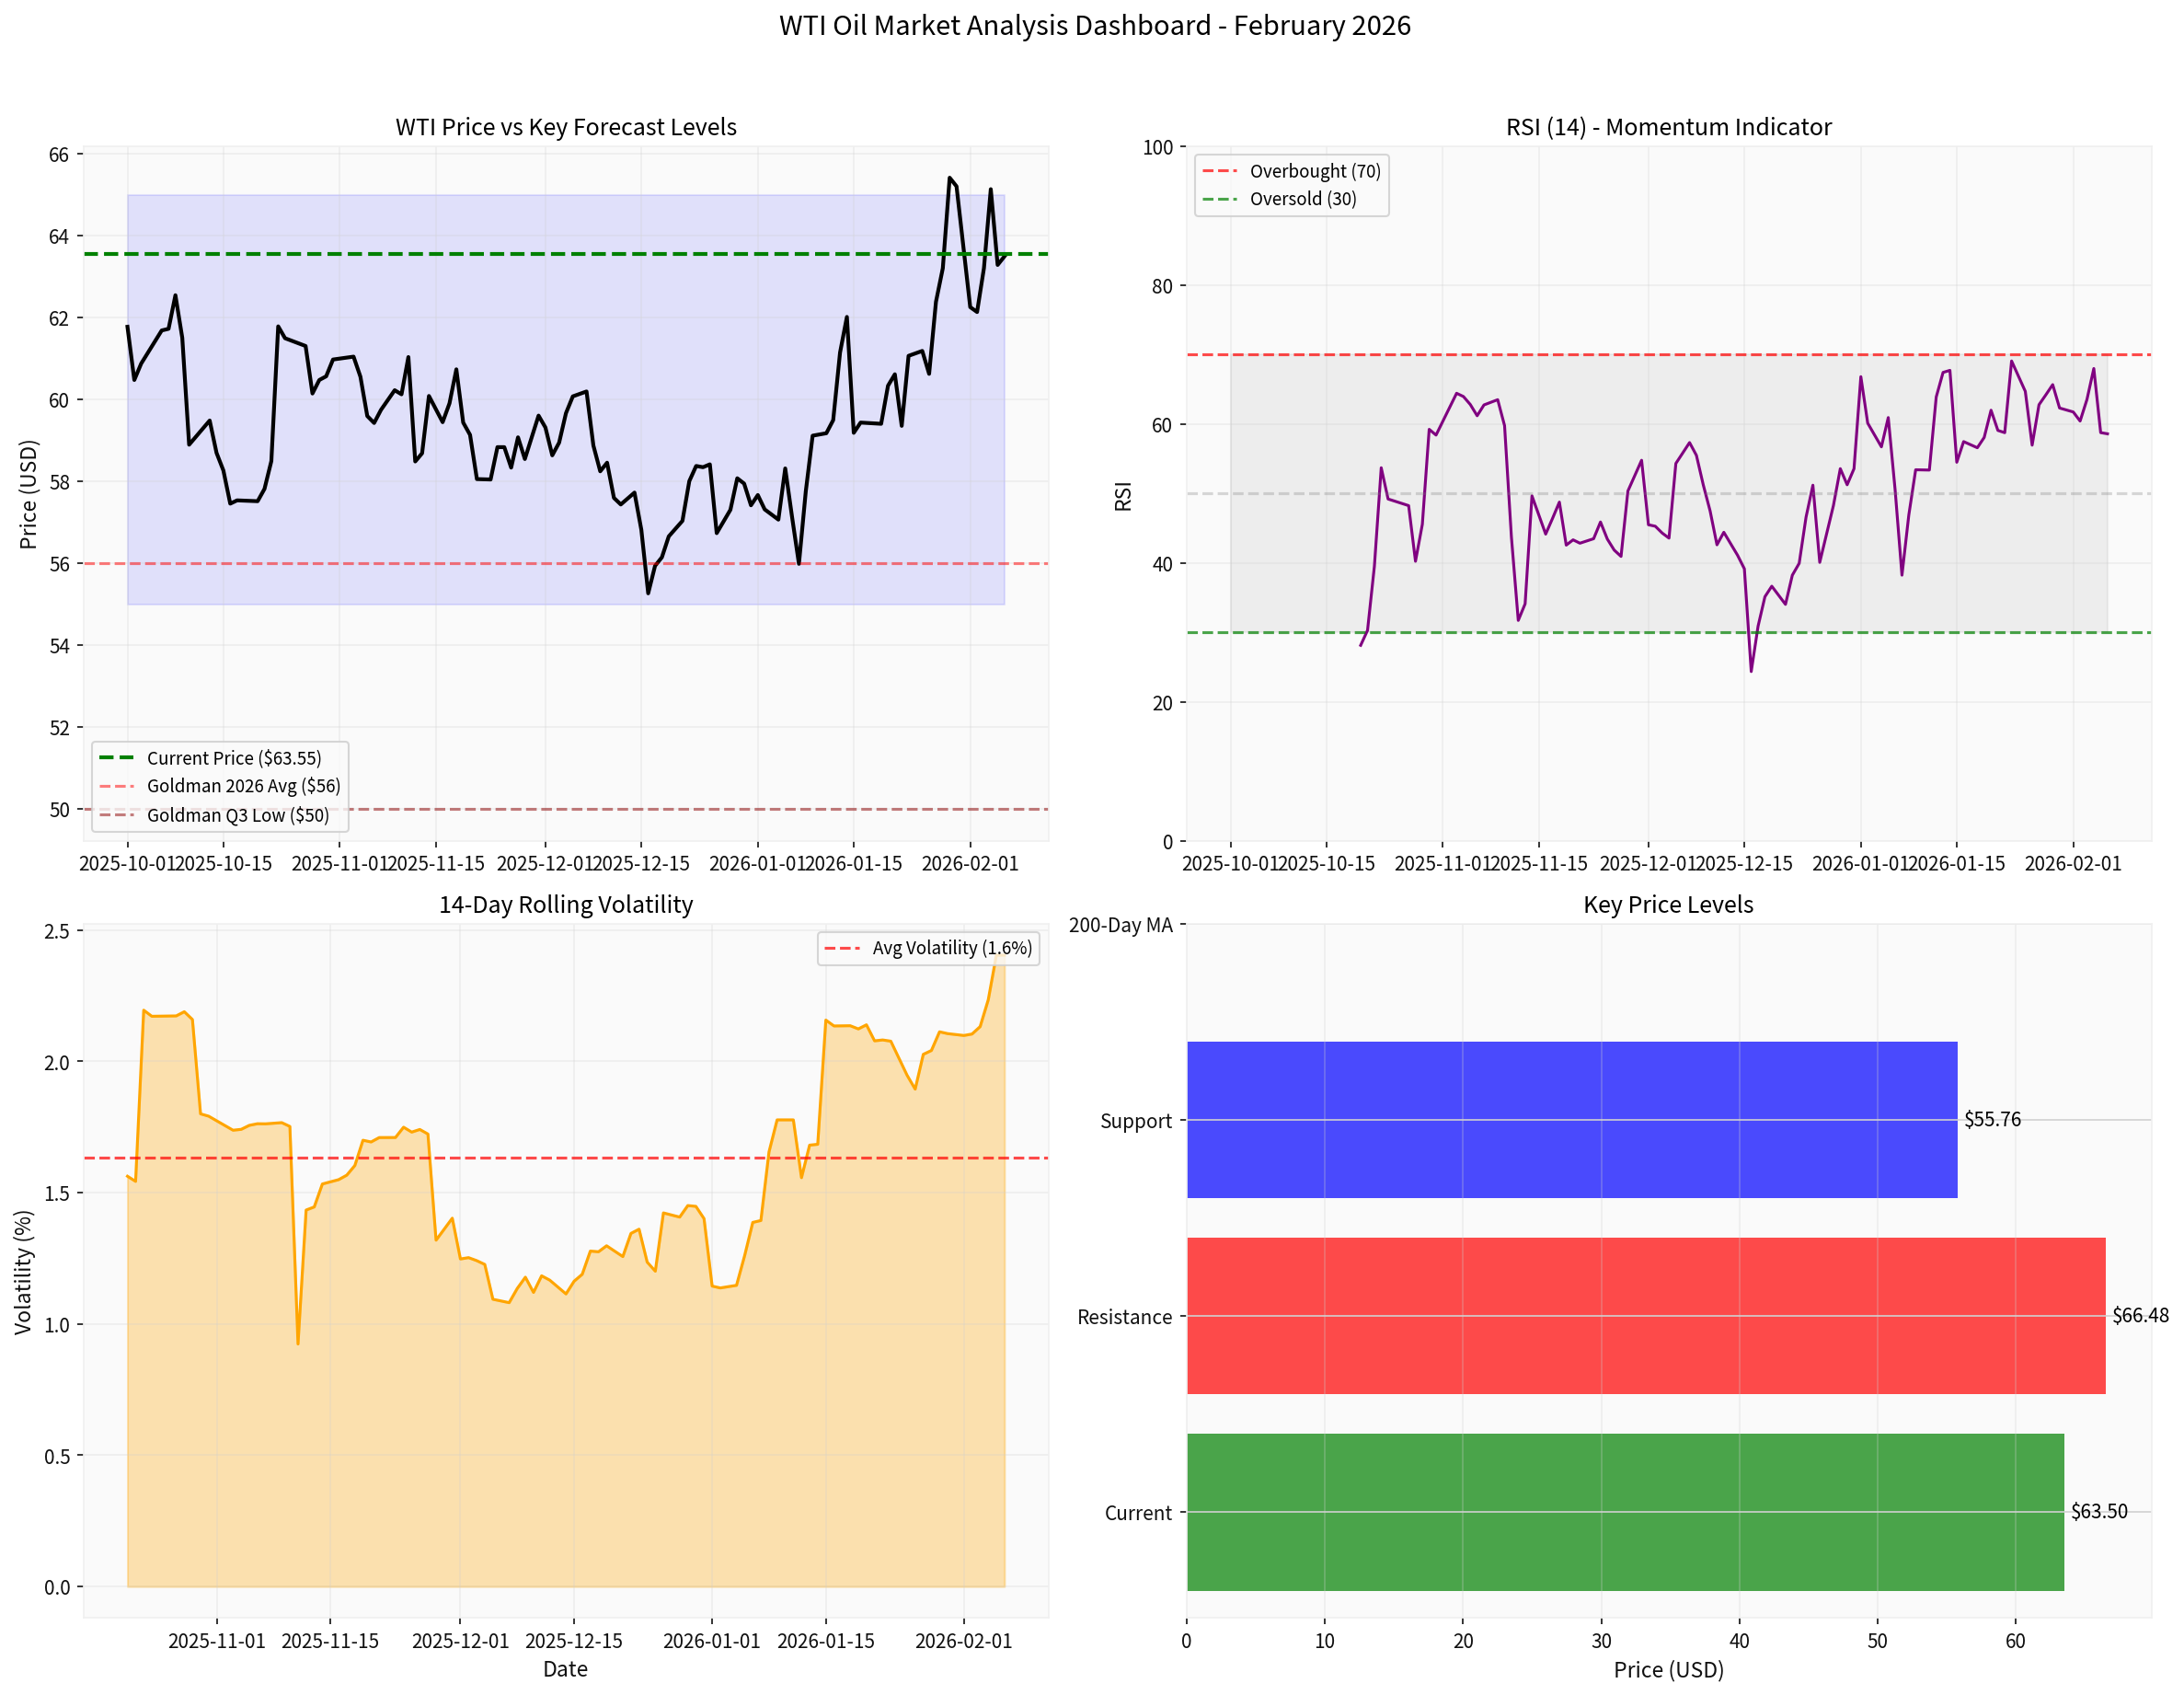
| RSI (14) | 58.58 | Moderate Bullish |
| MACD | 1.2845 | Positive momentum |
| Bollinger Band Position | 70.3% | Upper half of range |
-
Price Positioning Within Ranges:WTI has rallied from its 90-day low of $54.98 (December 16, 2025) to current levels, placing it in theupper portion of its 3-month trading range($54.98-$66.48). The Bollinger Band position of 70.3% indicates the market is approaching overbought territory rather than being in a sustainable uptrend [0].
-
RSI Analysis:The RSI reading of58.58sits in moderate bullish territory but has not reached overbought levels (70+). This suggests momentum is positive but not yet exhausted—a characteristic of corrective bounces rather than trend reversals [0].
-
MACD Signals:While the MACD histogram shows positive values (0.0675), the divergence between MACD and signal line is minimal, indicatingweak convictionbehind the recent price rise rather than strong directional momentum [0].
-
Persistent Surplus Fundamentals:Goldman Sachs projects a2.3 million barrels per day (mb/d) global surplusin 2026, with inventories expected to continue building through Q3 2026 [2][3]. This fundamental backdrop does not support a sustained demand-driven recovery.
The latest EIA report (week ending January 30, 2026) presents a nuanced picture:
| Inventory Category | Actual Change | Expected | Implication |
|---|---|---|---|
| Crude Oil Stocks | -3.5 million barrels |
+489,000 barrels | Tighter supply |
| Gasoline Stocks | +685,000 barrels | +1.4 million barrels | Subdued demand |
| Distillates | -5.6 million barrels |
-2.3 million barrels | Strong winter demand |
| Refinery Runs | -180,000 bpd | — | Lower processing |
- The crude inventory draw (-3.5M barrels vs +489K expected)represents a bullish surprise that provided technical buying support [1][2]
- However, gasoline inventories reaching 5-year highs (257.9 million barrels)indicates weak domestic demand despite the holiday season [1][2]
- The sharp distillate draw (-5.6M barrels)reflects winter heating demand but may be seasonal rather than structural [1]
Based on the current market structure, traders should prioritize the following indicators:
- Crude stock draws vs builds— A sustained drawdown trend would signal genuine supply tightening
- Gasoline inventory trajectory— Must see draws, not builds, to confirm demand recovery
- Refinery utilization rates— Above 92% indicates strong refining demand
- Watch for any production cuts or extensionsbeyond current quotas
- Saudi Arabia’s voluntary cuts remain critical to market balance
- March 2026 OPEC+ meeting is a key inflection point
- Strong inverse correlation with oil prices
- Fed policy trajectory will drive dollar and oil in opposite directions
- Iran nuclear talks (reportedly back on track) could add downside pressure if sanctions ease [1]
- Russia/Venezuela supply risks remain potential volatility drivers
- Import data and refinery throughput figures
- GDP growth trajectory for 2026
| Level Type | Price | Significance |
|---|---|---|
| Resistance | $65.96 | Bollinger Upper Band |
| Resistance | $66.48 | Recent high (Jan 29) |
| Support | $61.82 | 20-Day MA |
| Support | $59.40 | 50-Day MA |
| Critical | $56.00 | Goldman 2026 average forecast |
- OPEC+ implementing deeper production cuts
- Geopolitical supply disruptions
- Stronger-than-expected global demand recovery
[0] Ginlix API Data - WTI Crude Oil Price and Technical Analysis
[1] BNN Bloomberg - “US crude oil and distillate inventories fell last week” (February 4, 2026)
[2] Qatar News Agency - EIA Crude Oil Stocks Report (February 5, 2026)
[3] Reuters - “Goldman projects lower oil prices in 2026 as supply swells” (January 12, 2026)
Insights are generated using AI models and historical data for informational purposes only. They do not constitute investment advice or recommendations. Past performance is not indicative of future results.
About us: Ginlix AI is the AI Investment Copilot powered by real data, bridging advanced AI with professional financial databases to provide verifiable, truth-based answers. Please use the chat box below to ask any financial question.