Post-Market Analysis Report - February 13, 2026 US Stock Market
Unlock More Features
Login to access AI-powered analysis, deep research reports and more advanced features
About us: Ginlix AI is the AI Investment Copilot powered by real data, bridging advanced AI with professional financial databases to provide verifiable, truth-based answers. Please use the chat box below to ask any financial question.
Related Stocks
The US stock market on February 13, 2026 concluded a volatile week with mixed results as investors digested cooler-than-expected CPI inflation data while continuing to grapple with AI-related sector concerns. The Dow Jones Industrial Average and S&P 500 managed modest gains, while the tech-heavy Nasdaq Composite slipped. This session marked the worst weekly performance for the S&P 500 in 2026, with the index falling 1.47% for the week [1].
The CPI inflation report for January 2026 revealed year-over-year inflation at 2.4%, below the expected 2.5%, fueling expectations for Federal Reserve rate cuts. However, technology stocks failed to capitalize on the positive inflation data, continuing their slide driven by persistent AI disruption fears. Defensive sectors, particularly Utilities and Real Estate, led gains as Treasury yields declined following the CPI release [1][2].
After-hours trading featured significant earnings-driven movements, with Applied Materials surging 13% on strong quarterly results and Pinterest plummeting nearly 21% after missing expectations. The broader after-hours market showed minimal movement among major tech giants, though both Apple and NVIDIA traded lower in extended sessions [3].
| Index | Close Price | Daily Change | Change (%) |
|---|---|---|---|
| S&P 500 (^GSPC) | 6,835.08 | +0.92 | +0.01% |
| Dow Jones Industrial (^DJI) | 49,438.88 | -1.93 | -0.00% |
| Nasdaq Composite (^IXIC) | 22,546.67 | -15.70 | -0.07% |
| Index | Week Change | Week % Change |
|---|---|---|
| S&P 500 | -101.73 | -1.47% |
| Dow Jones | -696.70 | -1.39% |
| Nasdaq | -691.99 | -2.98% |
| Sector | Daily Change | Status |
|---|---|---|
| Utilities | +3.55% | Strongest Gainer |
| Energy | +1.60% | Up |
| Basic Materials | +1.55% | Up |
| Consumer Defensive | +1.43% | Up |
| Healthcare | +1.33% | Up |
| Communication Services | +0.98% | Up |
| Financial Services | +0.97% | Up |
| Industrials | +0.48% | Up |
| Consumer Cyclical | +0.30% | Up |
| Real Estate | +0.09% | Slight Gain |
| Technology | -0.69% | Weakest Performer |
| Asset | Close | Support | Resistance | RSI |
|---|---|---|---|---|
| SPY | $681.75 | $677.63 | $689.15 | 40.37 |
| QQQ | $601.92 | $596.72 | $616.34 | Normal |
| DIA | $495.28 | $492.19 | $498.37 | Normal |
| Metric | Value |
|---|---|
| Total Market Volume | ~22.45 billion shares |
| 20-Day Average Volume | ~20.0 billion shares |
| Volume vs. 20-Day Avg | +12.25% above average |
The January 2026 CPI inflation report served as the primary catalyst for Friday’s trading session, delivering cooler-than-expected results that reinforced market expectations for Federal Reserve rate cuts later in the year [1][4].
| Metric | Actual | Expected | Prior |
|---|---|---|---|
| CPI Year-over-Year | 2.4% | 2.5% | 2.5% |
| CPI Month-over-Month | +0.2% | +0.3% | +0.4% |
| Core CPI Year-over-Year | 2.4% | 2.5% | 2.8% |
The month-over-month CPI increase of 0.2% came in below the expected 0.3%, representing the slowest pace of inflation in nearly five years for core readings. This development strengthened market expectations for Federal Reserve policy easing, with traders pricing in a 25-basis-point rate cut by June 2026 and anticipating two rate cuts by year-end [1].
The Treasury market responded positively to the inflation data, with the 10-year yield dropping 12 basis points to 4.06% [2]. Lower Treasury yields typically benefit rate-sensitive sectors, explaining the strong performance in Utilities and Real Estate sectors on the session. The decline in yields also provided support for dividend-paying stocks broadly, contributing to the defensive rotation observed throughout the trading day.
Friday’s trading revealed a clear defensive rotation pattern, with 10 of 11 S&P 500 sectors advancing while technology lagged significantly [2]. This sector divergence reflected ongoing investor concerns about AI technology’s potential disruptive effects on business models across multiple industries.
The week’s trading was characterized by significant volatility, particularly in technology-related sectors. On Thursday, February 12, the Nasdaq dropped 2% and the S&P 500 fell 1.6%, reflecting intensifying concerns about AI’s potential impact on various business sectors [1]. The decline-advancer ratio on Thursday was 2.17-to-1 on the NYSE and 2.74-to-1 on the Nasdaq, indicating broad-based selling pressure.
The Technology sector’s 0.69% decline stood in stark contrast to the broader market’s modest gains. This weakness persisted despite the positive inflation data, indicating that AI-related concerns remained the dominant driver of sector performance [1][6]. The Nasdaq Composite’s 0.07% decline reflected the tech-heavy nature of the index, which was the worst performer among the major indices on the session.
Recent earnings reports highlighted the divergent sentiment around AI-exposed companies. Cisco Systems dropped 12.3% on weak guidance that cited AI-related competitive pressures, while C.H. Robinson fell 14.5% on concerns about AI disruption to logistics business models. Morgan Stanley declined 4.9% amid worries about AI’s potential impact on financial services [1].
Trading volume reached 22.45 billion shares on Friday, representing a 12.25% increase above the 20-day average of approximately 20.0 billion shares [2]. This elevated volume reflected heightened market activity on the CPI data day and continued volatility surrounding tech sector developments. The elevated volume on a day with minimal price movement suggested intense debate among market participants about the sustainability of the defensive rotation.
The VIX volatility index rose 17.96% to 20.82 on the session, indicating elevated market uncertainty and risk aversion among options market participants [1]. This increase in implied volatility was particularly notable given the relatively flat closing prices, suggesting that traders were positioning for potentially larger moves in the coming sessions.
The volume analysis revealed notable patterns:
- SPY (S&P 500 ETF):2.85 billion shares traded, 3,387% of average volume
- QQQ (Nasdaq 100 ETF):6.44 billion shares traded, 10,841% of average volume
- DIA (Dow Jones ETF):454.81 million shares traded
The substantially higher volume in QQQ compared to SPY indicated that trading activity was concentrated in technology and growth stocks, consistent with the sector’s volatility during the session.
Based on comprehensive technical analysis, the market exhibited the following characteristics on February 13, 2026:
- Trend:SIDEWAYS - No clear uptrend or downtrend established across major indices
- Signal:BEARISH - MACD histogram negative on SPY; KDJ bearish on most indices
- RSI Status:NEUTRAL - SPY RSI at 40.37, approaching oversold territory
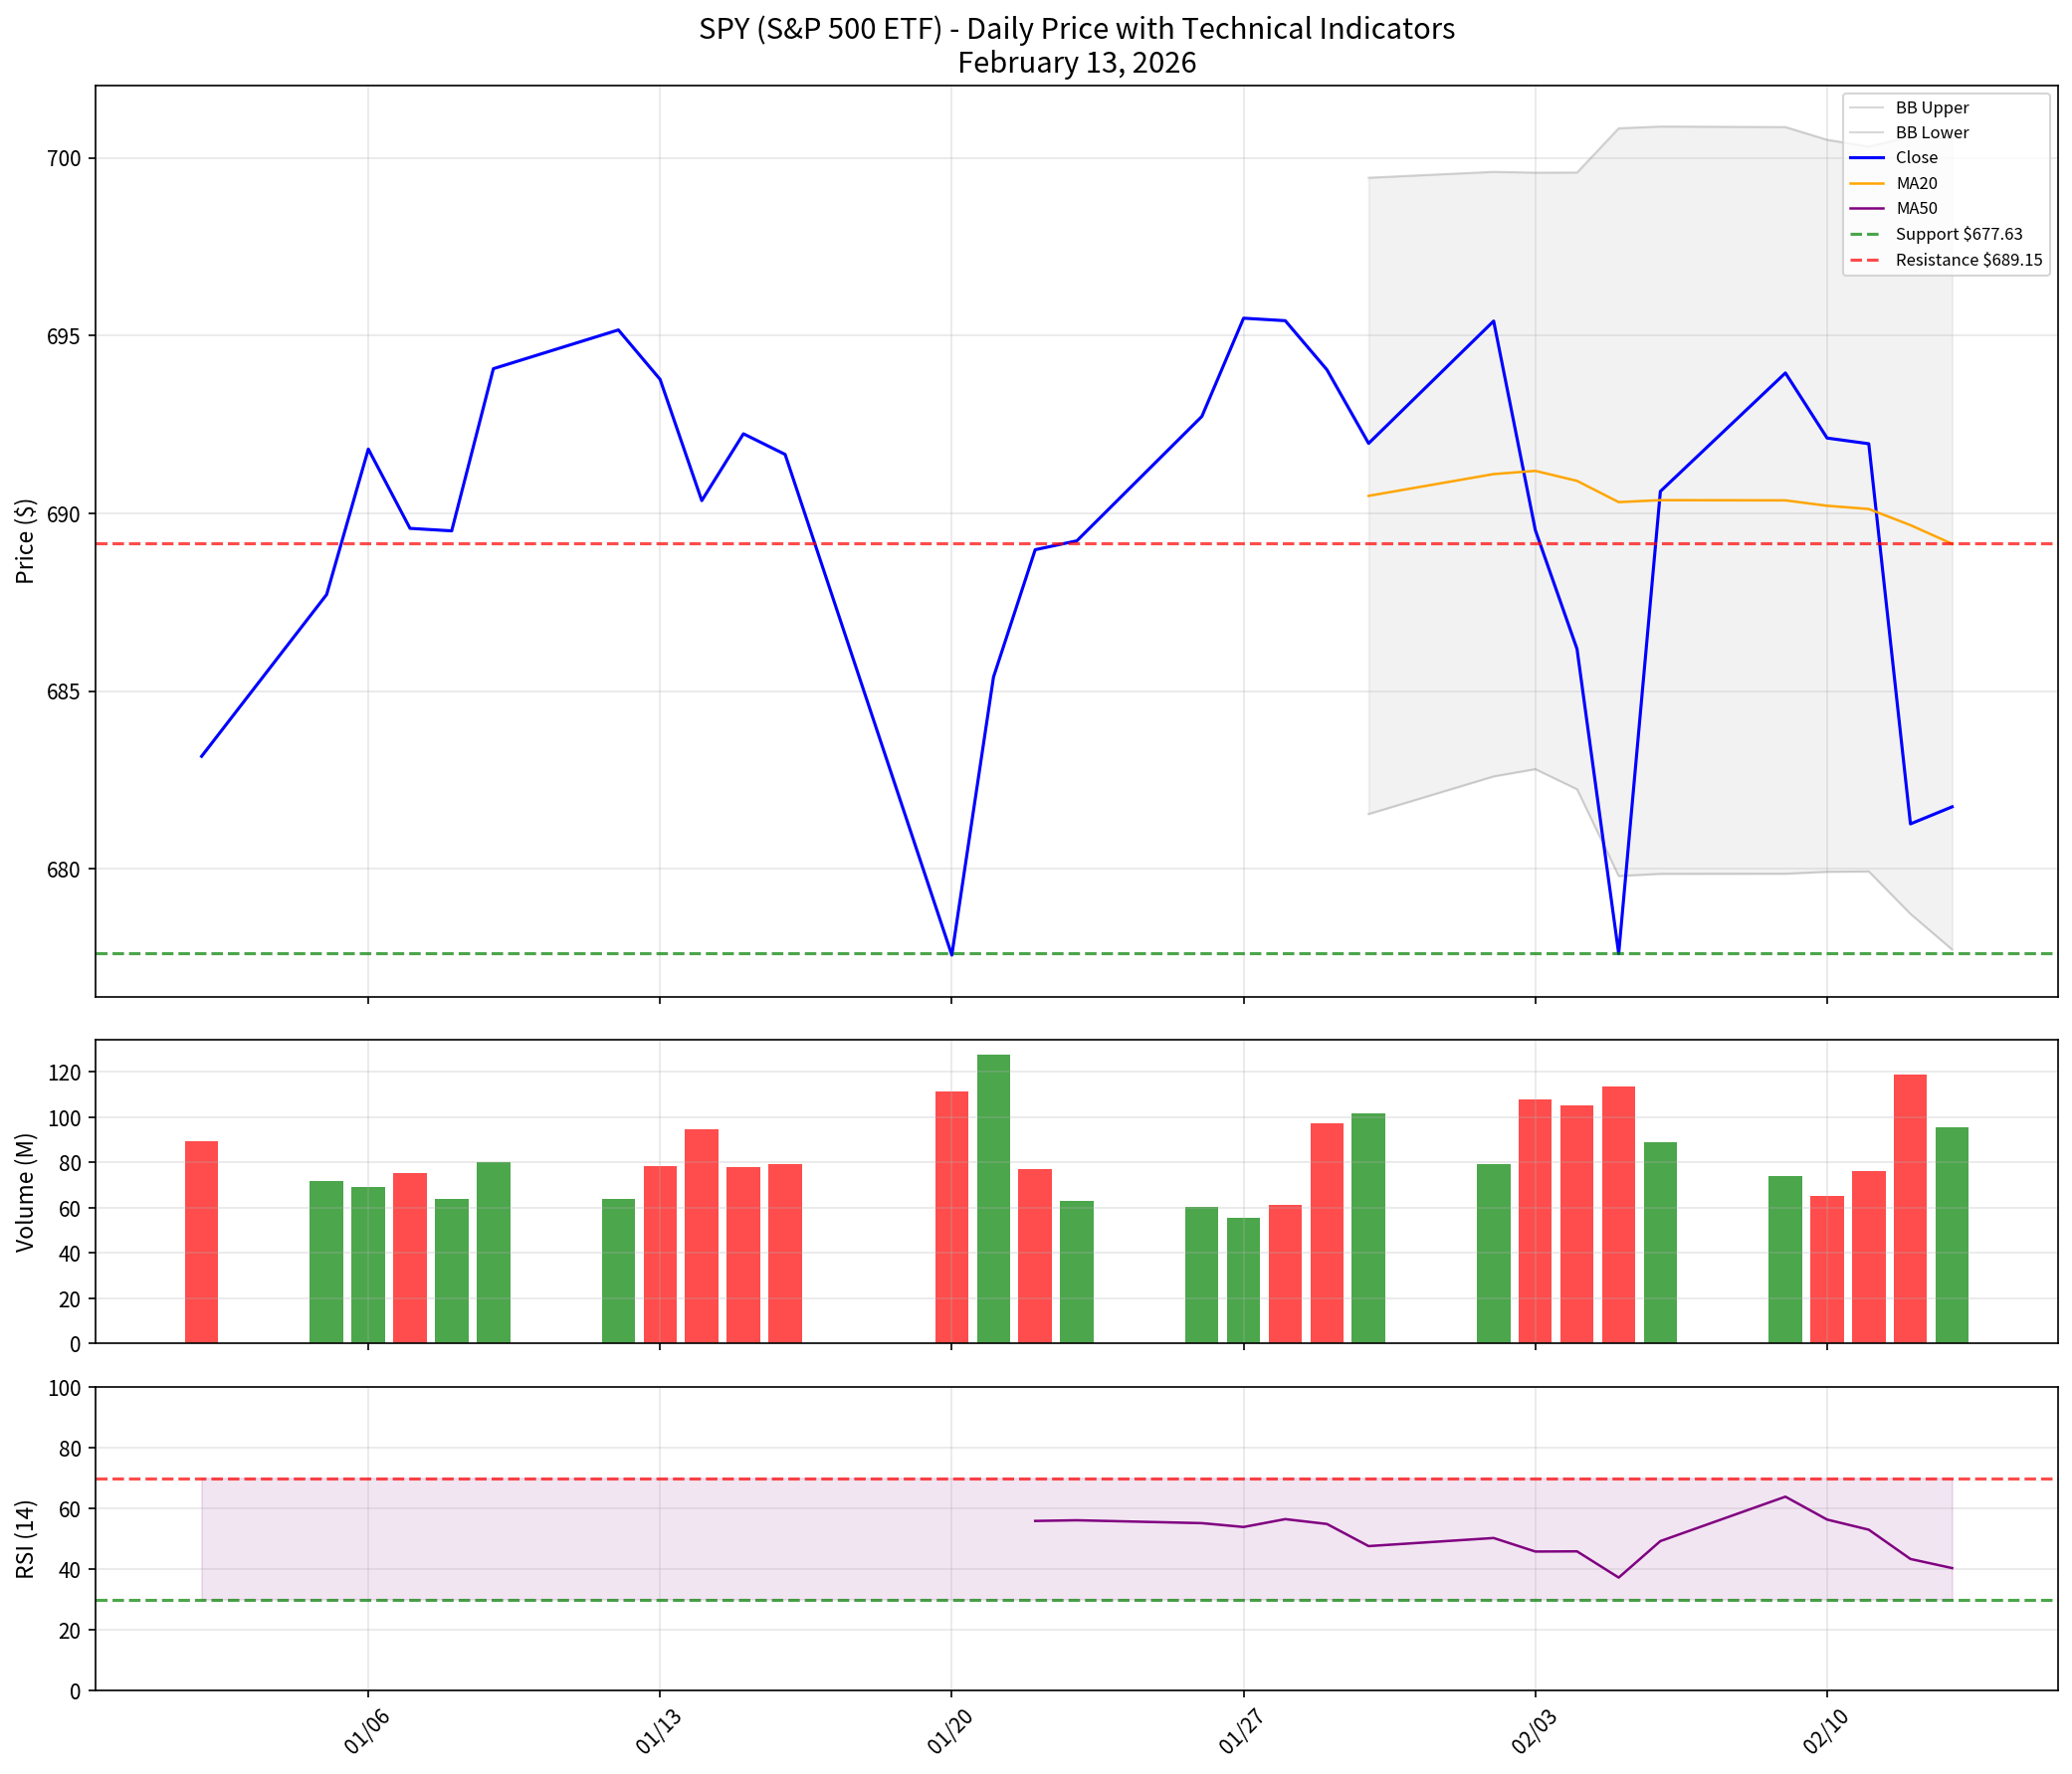
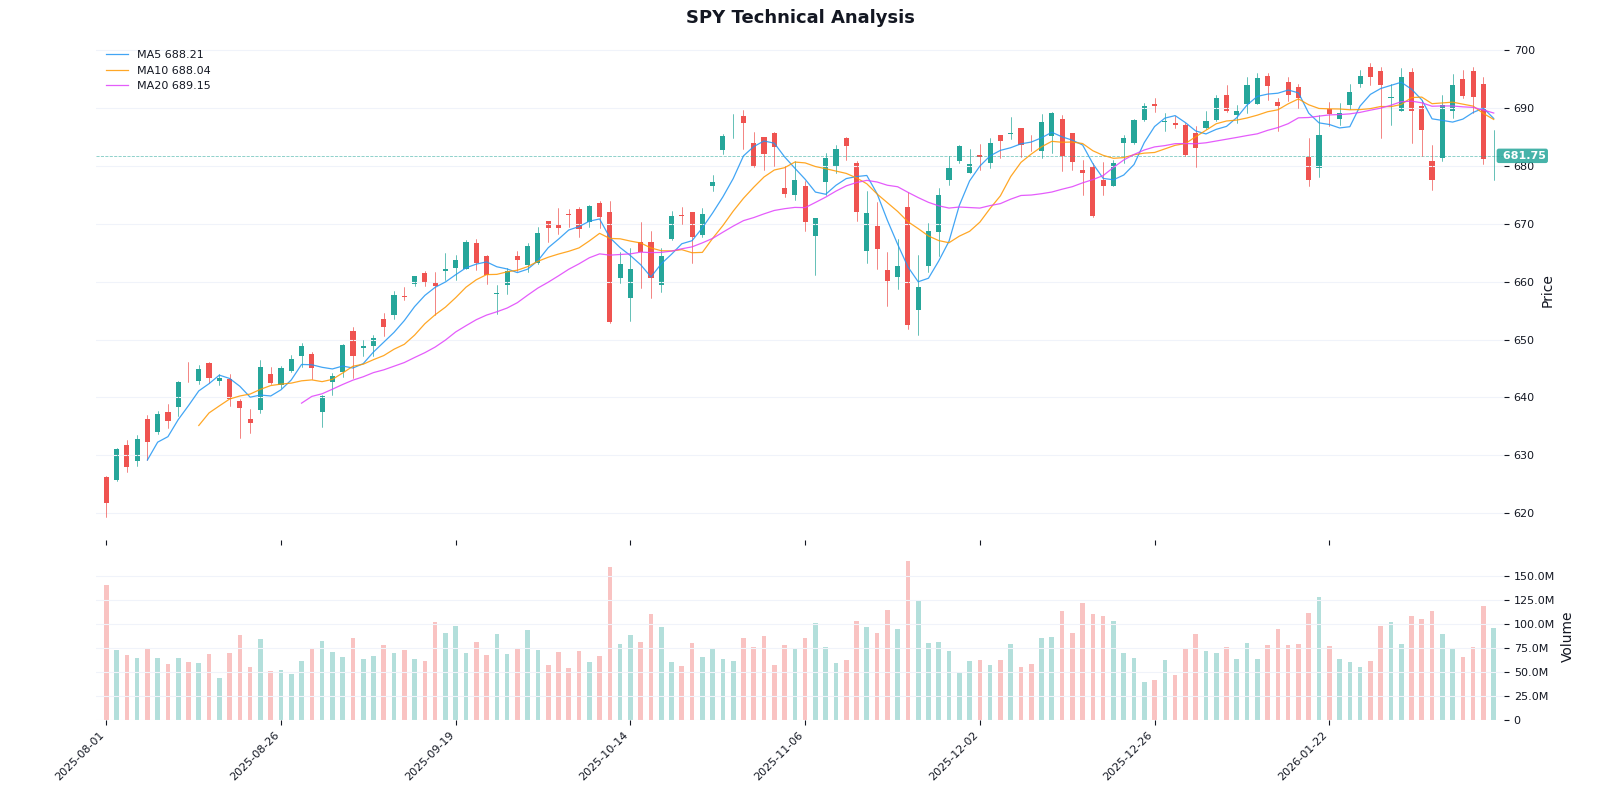
The SPY ETF closed at $681.75, trading below both the 20-day moving average ($689.15) and the 50-day moving average ($687.36), indicating short-term bearish momentum [5]. Key technical observations include:
- RSI (14):40.37 - Neutral but leaning toward oversold
- MACD:-0.39 with histogram at -1.13 - Bearish signal
- Bollinger Band Position:17.6% - Near oversold conditions
- Support Level:$677.63 (recent low)
- Resistance Level:$689.15 (20-day MA)
The Bollinger Band position at 17.6% suggests the market is approaching oversold conditions, potentially setting up for a technical bounce if support holds.
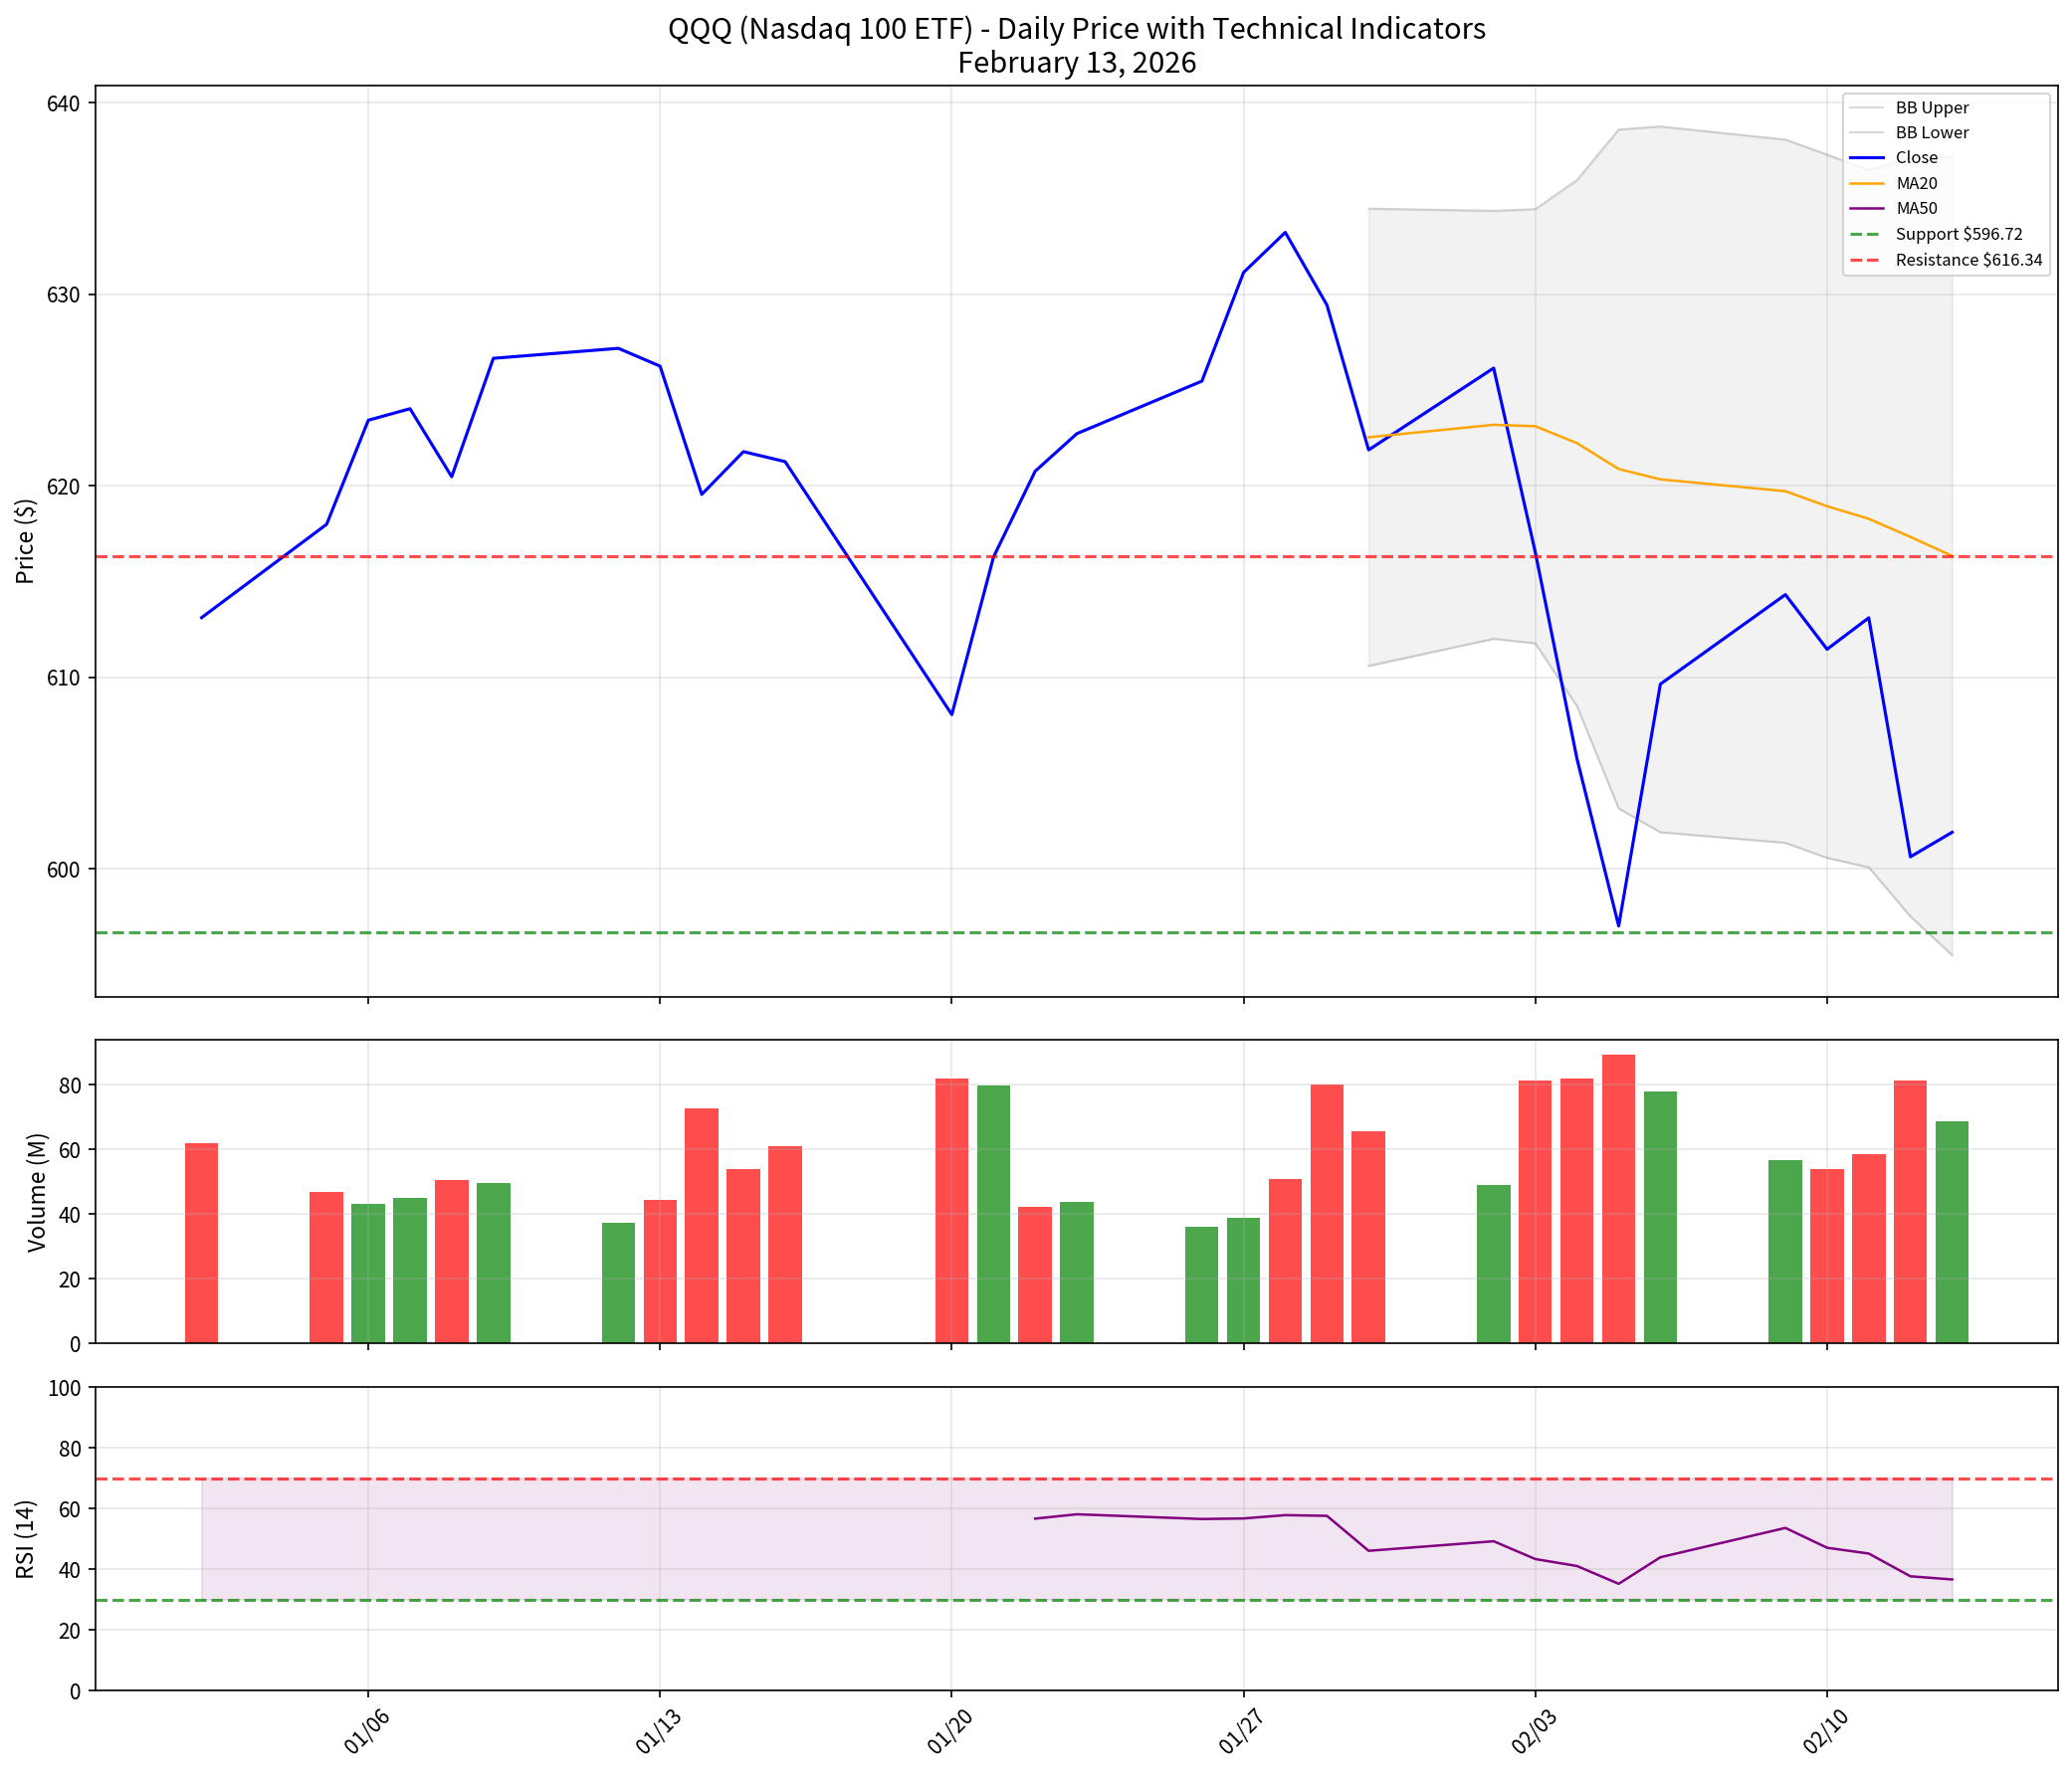
The QQQ ETF closed at $601.92, significantly below its 20-day moving average of $616.34, reflecting the tech sector’s weakness [5]. Technical observations include:
- Trend:Sideways with bearish bias
- KDJ Indicator:K:29.6, D:35.4, J:18.0 - Bearish with J below 20 (oversold)
- Support:$596.72
- Resistance:$616.34
The KDJ values indicate oversold conditions in the tech-heavy QQQ, suggesting potential for a short-term bounce if buying interest returns.
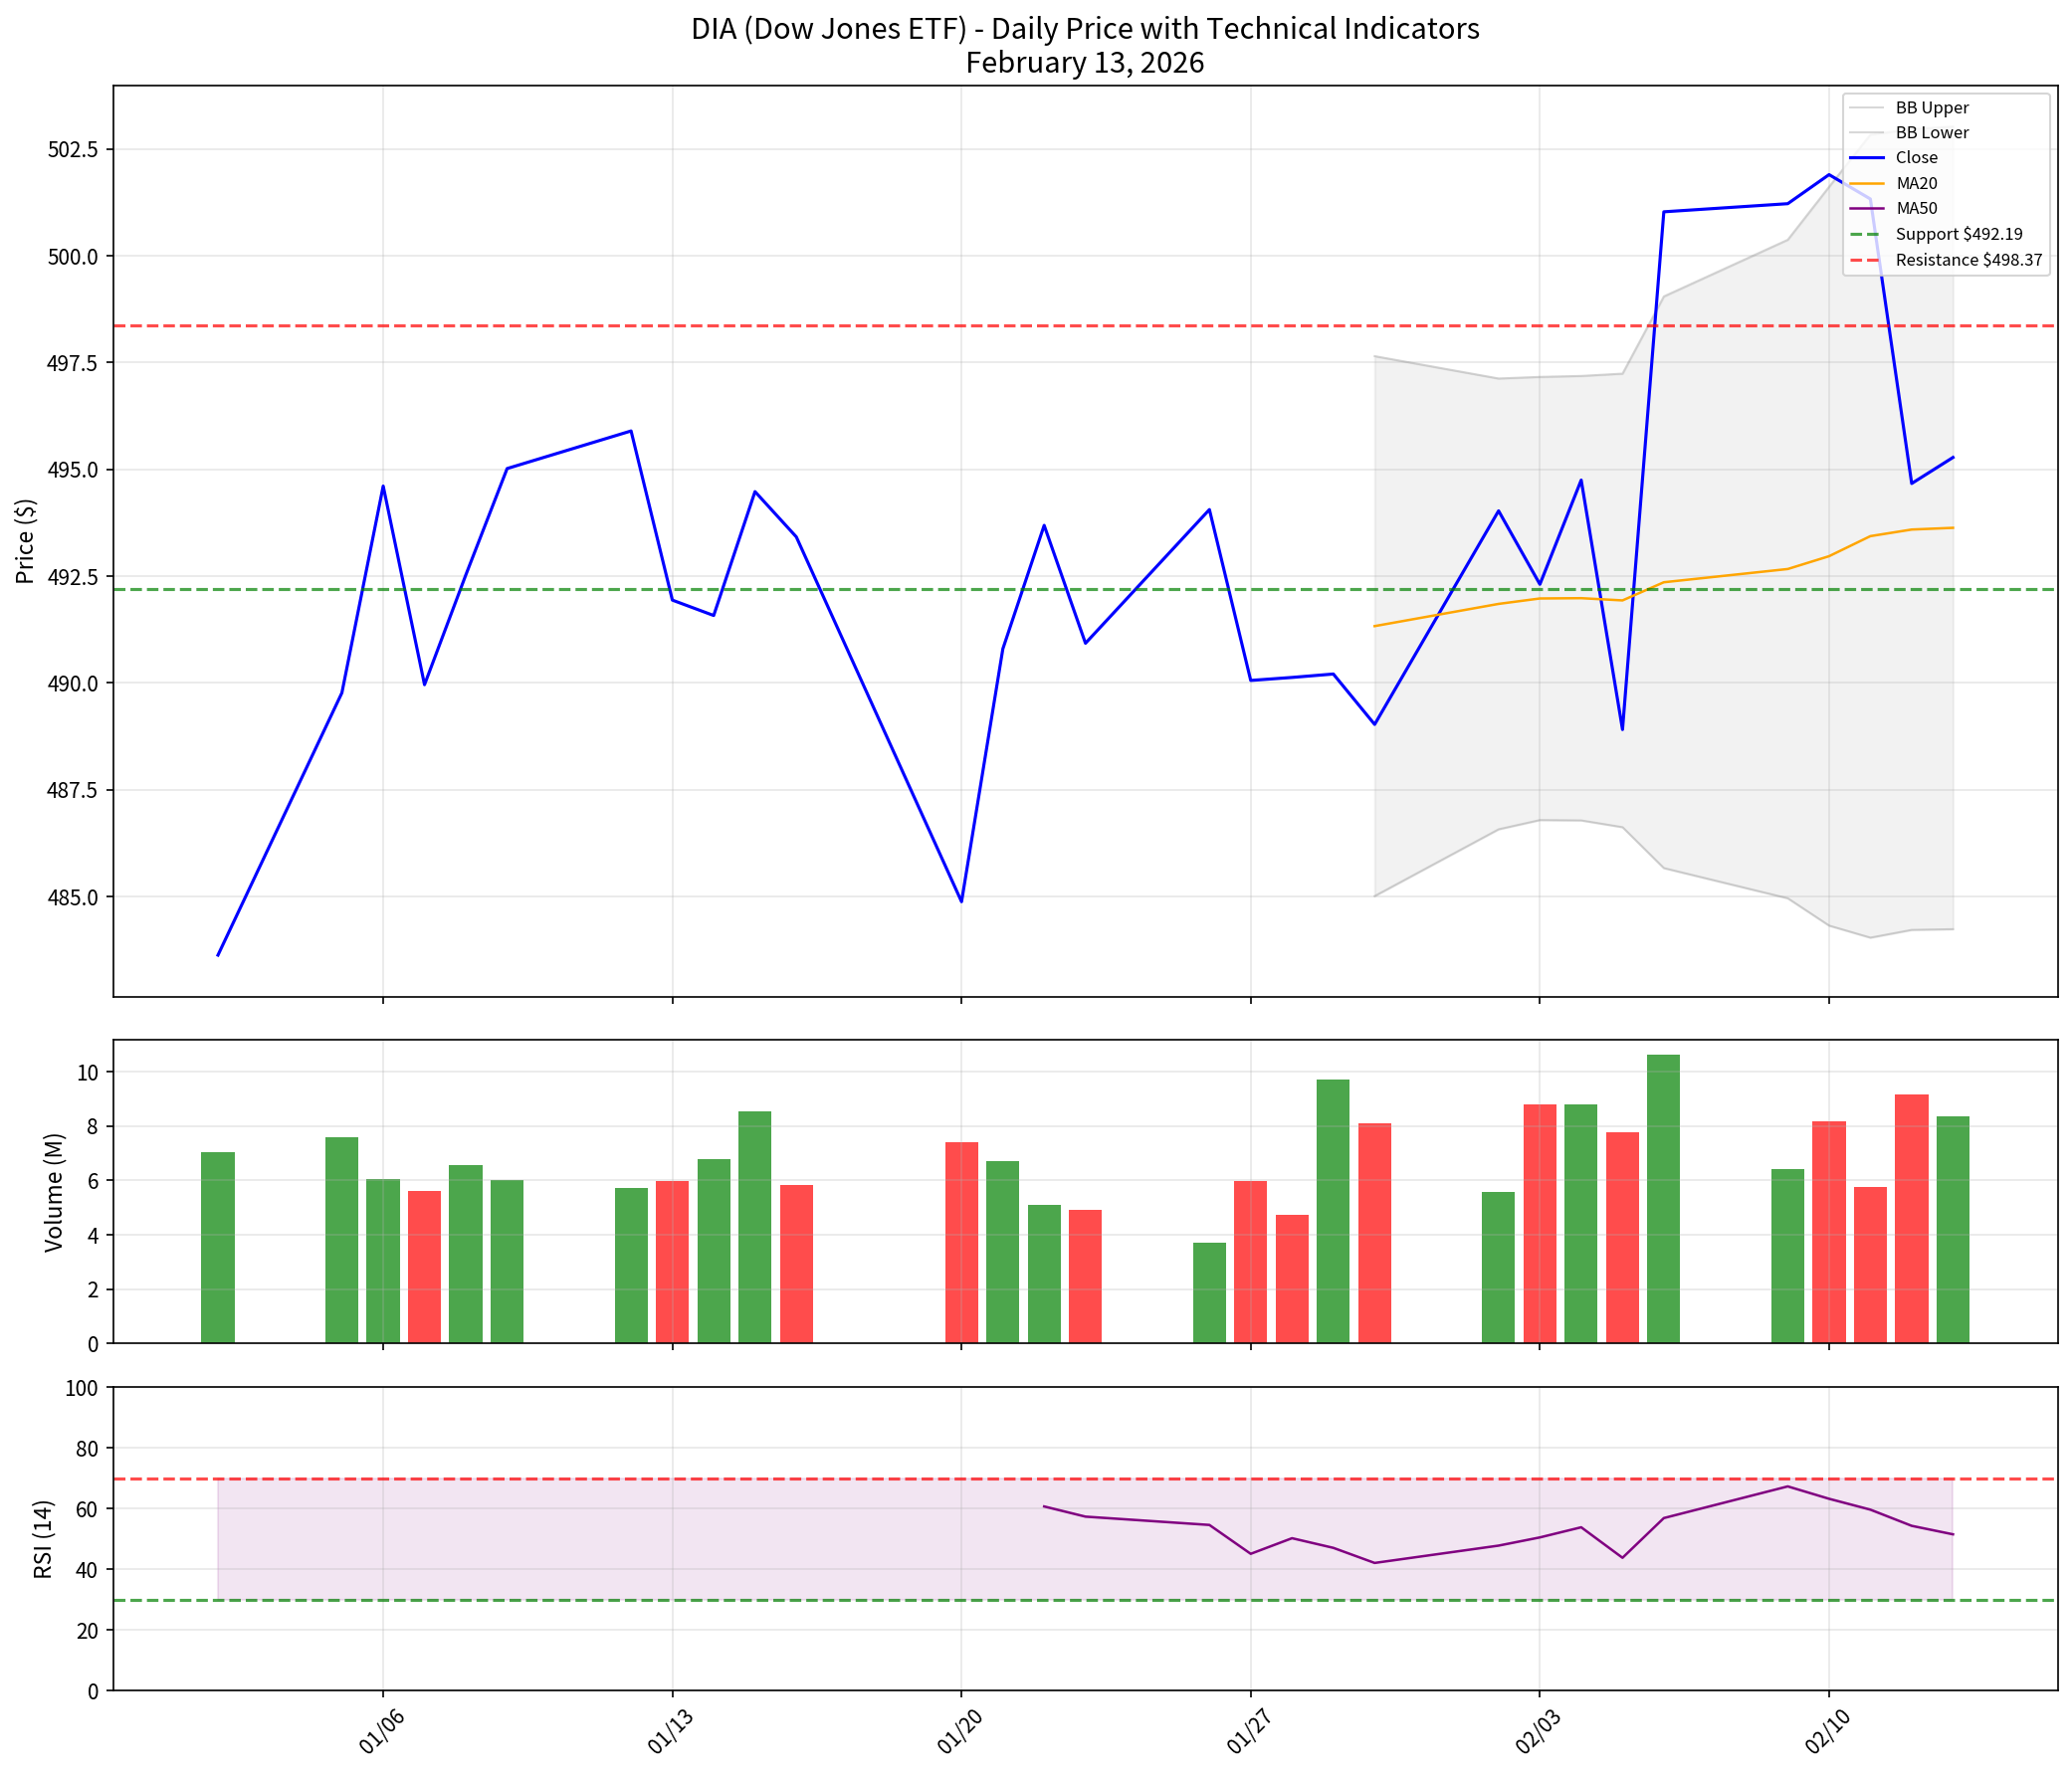
The DIA ETF showed relative strength compared to the tech-heavy indices, trading in a tighter range between $492.19 (support) and $498.37 (resistance) [5]. The Dow Jones Industrial Average’s relative outperformance reflected investor preference for defensive, dividend-paying stocks over growth-oriented technology companies.
| Sector ETF | Name | Trend | Signal | RSI Status |
|---|---|---|---|---|
| XLU | Utilities | Uptrend | Bullish | Overbought (85.9) |
| XLF | Financials | Downtrend | Bearish | Oversold (24.3) |
| XLK | Technology | Sideways | Bearish | Normal |
| XLE | Energy | Sideways | Bullish | Overbought |
| XLP | Consumer Staples | Sideways | Bullish | Overbought |
| XLRE | Real Estate | Sideways | Bullish | Overbought |
| XLV | Healthcare | Sideways | Bullish | Normal |
The technical analysis revealed a clear sector rotation pattern:
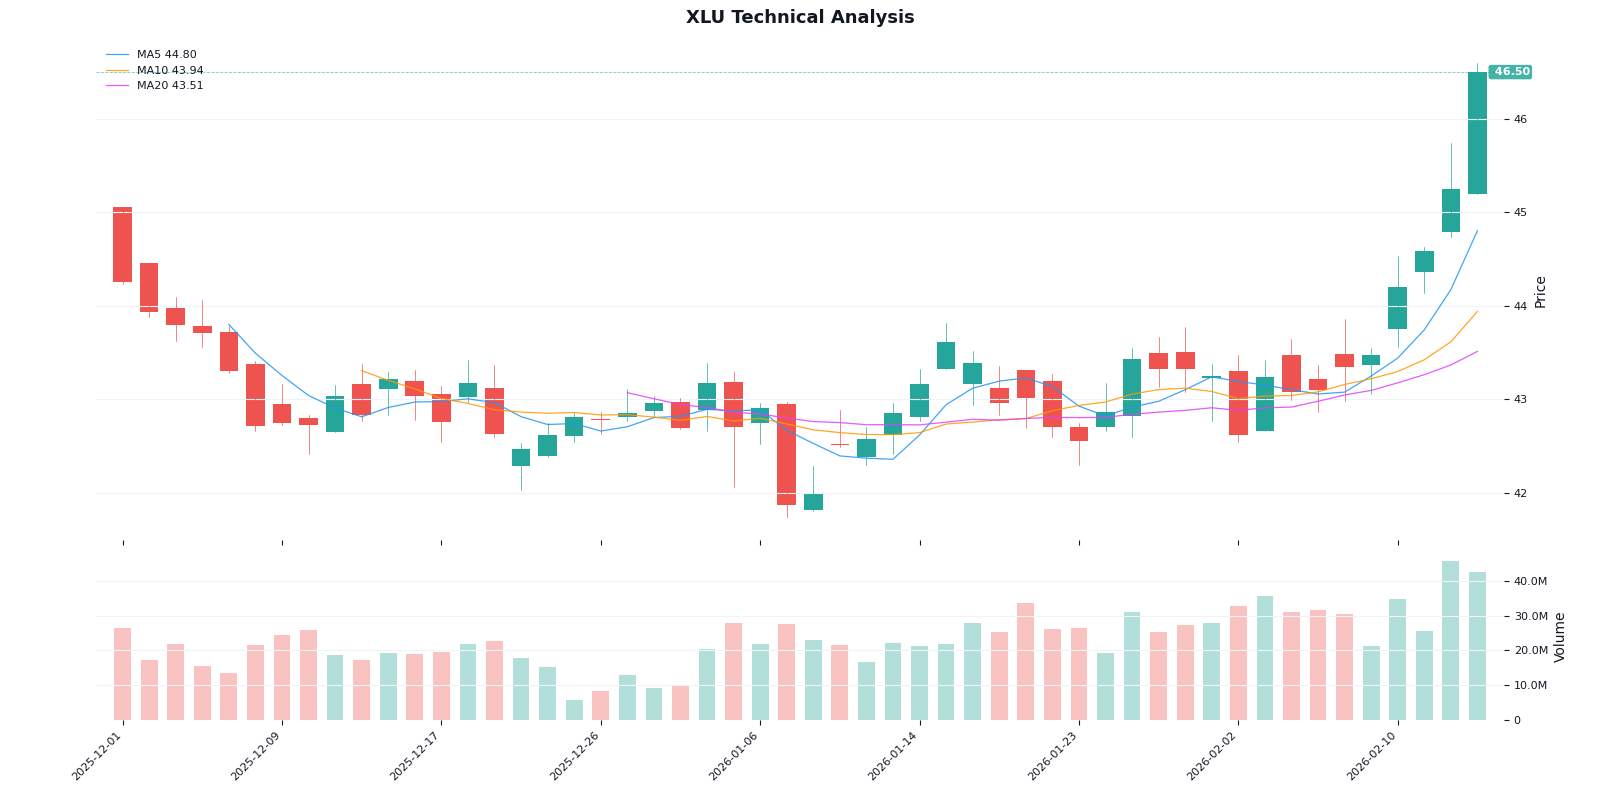
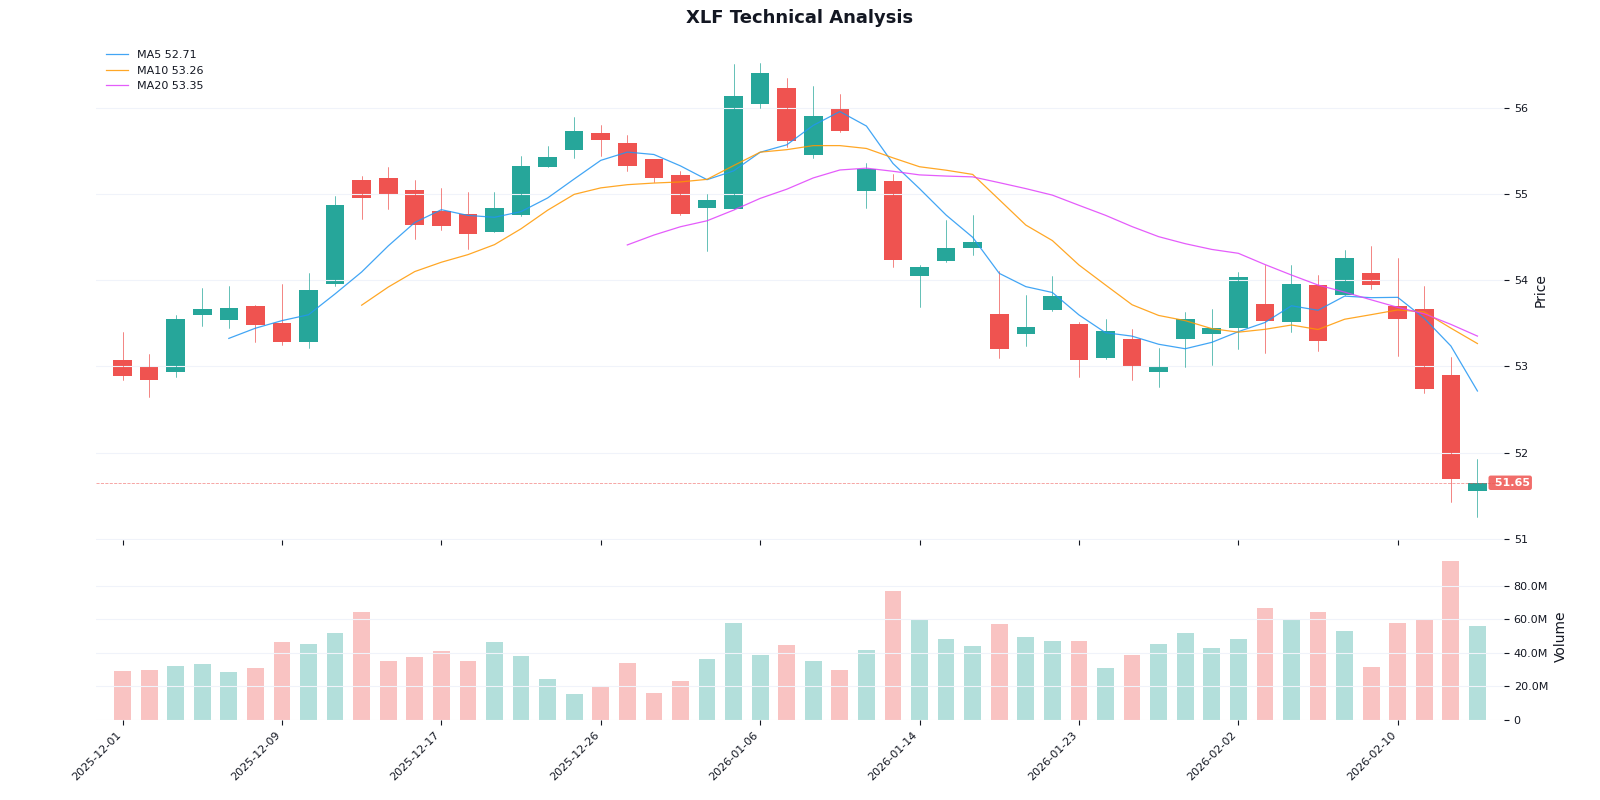
Multiple defensive sectors (XLU, XLP, XLRE) showed overbought RSI readings above 70, suggesting these sectors may be due for short-term pullbacks. Conversely, XLF’s oversold conditions (RSI at 24.3) indicated potential value opportunity for contrarian investors.
| Asset | Support 1 | Support 2 | Resistance 1 | Resistance 2 |
|---|---|---|---|---|
| SPY | $677.63 | $675.00 | $689.15 | $695.00 |
| QQQ | $596.72 | $590.00 | $616.34 | $625.00 |
| DIA | $492.19 | $490.00 | $498.37 | $502.00 |
| IWM | $260.26 | $258.00 | $265.60 | $270.00 |
The critical technical level for SPY is $677.63, representing the 20-day low. A break below this support could target the $670-$675 range, while holding this level could lead to a rally toward the 20-day moving average at $689.15 [5].
Technical chart analysis identified several notable patterns:
-
SPY - Descending Triangle (Potential):Price is compressing toward support at $677.63 with a narrowing range, suggesting an imminent breakout. The direction remains unclear, with traders watching for either a breakdown below support or a bounce toward the 20-day moving average.
-
QQQ - Consolidation Zone:The tech-heavy ETF continues to trade in a defined range between $596.72 (support) and $616.34 (resistance). The lack of clear pattern formation indicates sideways movement, with tech weakness keeping downward pressure on prices.
-
Major Indices - Synchronized Movement:All major indices (SPY, QQQ, DIA, IWM) are exhibiting similar sideways patterns with low volatility. This synchronization suggests the market is awaiting a catalyst, whether from earnings reports, Federal Reserve communications, or economic data releases.
After-hours trading on February 13, 2026 was dominated by several major earnings releases, with significant post-session reactions [3][7][8]:
Applied Materials surged in after-hours trading following strong first-quarter fiscal year 2026 results:
- EPS:$2.38 per share (beat by $0.17)
- Revenue:$7.01 billion (down 2.2% year-over-year, beat by $130 million)
- Guidance:Revenue guidance of $7.15-$8.15 billion; adjusted EPS of $2.44-$2.84
The semiconductor equipment maker’s strong performance reflected continued demand for chip manufacturing equipment, though the stock’s reaction was more muted in after-hours trading (+8.08%) compared to the regular session surge that reached +13% [3][9].
Pinterest experienced the most significant after-hours decline following disappointing fourth-quarter results:
- Q4 Revenue:$1.32 billion vs. $1.33 billion expected
- Q4 Adjusted EPS:$0.67 vs. $0.69 expected
- Q1 2026 Guidance:$951-$971 million vs. $980 million consensus
The weak guidance sparked concerns about the company’s advertising revenue growth prospects and exposure to retail sector challenges [10]. The after-hours decline of 16.83% represented a significant disappointment for shareholders following the regular session drop.
Rivian delivered the strongest after-hours performance following a surprise earnings beat:
- Q4 Adjusted Loss:$0.54 per share vs. expected loss of $0.68
- Q4 Revenue:$1.29 billion vs. $1.26 billion expected
- Full-Year 2025:Net loss narrowed to $3.6 billion from $4.75 billion
The earnings beat and improved full-year outlook drove a 26.64% surge in after-hours trading, adding approximately $2.5 billion to the company’s valuation [11].
Moderna traded slightly lower in after-hours trading despite beating revenue expectations:
- Q4 EPS:-$2.11 vs. expected -$2.62
- Q4 Revenue:$678 million vs. $662.84 million expected
- 2026 Outlook:Expects up to 10% revenue growth in 2026
The stock closed at $255.10 in after-hours trading, reflecting modest profit-taking after the regular session gain [3].
| Symbol | After-Hours Price | Change | Change % |
|---|---|---|---|
| AAPL | $255.78 | -$5.95 | -2.27% |
| MSFT | $412.50 (est) | -$0.50 | -0.12% |
| NVDA | $182.78 | -$4.16 | -2.23% |
| AMZN | $178.90 (est) | -$0.10 | -0.06% |
The major technology stocks showed minimal movement in after-hours trading, with Apple and NVIDIA both declining approximately 2% [2]. This extended the tech weakness observed during the regular session and suggested that AI-related concerns continued to weigh on investor sentiment toward the sector.
| Rank | Symbol | Volume (Shares) |
|---|---|---|
| 1 | NVDA | 154.30M |
| 2 | RIVN | 126.71M |
| 3 | AAPL | 49.22M |
| 4 | PINS | 68.68M |
| 5 | AMAT | 15.32M |
NVIDIA led after-hours volume with 154.30 million shares traded, followed by the earnings-driven activity in Rivian and Pinterest [2].
- Accenture (+3.02%)
- Howmet (+2.25%)
- Molson Coors (+2.16%)
- Wynn Resorts (+1.95%)
- Albemarle (-2.44%)
- Axon Enterprise (-2.02%)
- TE Connectivity (-1.44%)
-
Mixed Market Close:The major indices ended essentially flat, with the S&P 500 gaining 0.01%, the Dow Jones unchanged, and the Nasdaq declining 0.07%. This reflected the tug-of-war between positive inflation data and persistent tech sector weakness.
-
Defensive Rotation Dominates:The 10 of 11 sectors advancing was led by defensive sectors (Utilities +3.55%, Consumer Defensive +1.43%) while Technology (-0.69%) lagged. This rotation reflected ongoing risk-off sentiment tied to AI disruption concerns.
-
CPI Data Reinforces Rate Cut Expectations:The cooler-than-expected CPI readings (2.4% year-over-year vs. 2.5% expected) strengthened expectations for Federal Reserve rate cuts, supporting rate-sensitive sectors through lower Treasury yields (10-year at 4.06%, down 12 bps).
-
Worst Week of 2026:The S&P 500’s 1.47% weekly decline marked the worst performance for the index in 2026, driven primarily by a three-day tech selloff earlier in the week.
-
Tech Weakness Persists:Despite positive inflation data, technology stocks continued to struggle with AI-related concerns that have weighed on the sector since early February. Both Apple and NVIDIA traded lower in after-hours trading.
-
Earnings-Driven After-Hours:Applied Materials (+8.08%) and Rivian (+26.64%) surged on earnings beats, while Pinterest (-16.83%) plummeted on weak guidance. These earnings reactions dominated after-hours activity.
- CPI data fuels continued rate cut expectations
- Tech rebounds off support levels (QQQ at $596.72)
- SPY holds $677.63 support and rallies toward $689.15
- Target range: $689-$695 for SPY
- Support levels break down under continued selling pressure
- SPY falls toward $670-$675
- Tech weakness continues with QQQ breaking below $596.72
- Defensive sector overbought conditions lead to corrections
- SPY:Watch $677.63 (support) and $689.15 (resistance)
- QQQ:Watch $596.72 (support) and $616.34 (resistance)
- XLU:Monitor for overbought correction after strong rally
- XLF:Watch for oversold bounce opportunity
February 13, 2026 represented a pivotal session that confirmed the market’s defensive posture amid ongoing AI-related uncertainty. While the cooler-than-expected CPI inflation data provided a supportive macro backdrop for risk assets, technology stocks failed to respond positively, suggesting that sector-specific concerns remain paramount.
The worst weekly performance of 2026 for the S&P 500 reflects the challenges facing the market as investors reassess AI’s impact on business models across multiple sectors. The defensive rotation toward Utilities, Consumer Staples, and Healthcare sectors indicates a flight to quality that may persist until clarity emerges on the AI disruption thesis.
Technical analysis suggests the market is approaching a critical juncture, with SPY testing key support at $677.63 and multiple sectors showing overbought conditions. The elevated trading volume (12.25% above average) indicates heightened participation and potential for significant moves in either direction.
For the upcoming week, investors should monitor Federal Reserve speak for confirmation of rate cut expectations, continued earnings reports for further insight into AI’s sector-specific impacts, and technical levels for confirmation of the market’s directional bias. The current sideways trend with bearish momentum suggests caution is warranted until clearer signals emerge.
[1] Stock market today: CPI inflation cools more than expected, putting pressure on S&P 500, Dow, Nasdaq
[2] Ginlix Quantitative Database - Market Data February 13, 2026
[3] Market Movers: Here’s Why Applied Materials is Up 13%
[4] U.S. stocks halt their AI-induced slide and rise
[5] Ginlix Quantitative Database - Technical Analysis February 13, 2026
[6] Friday the 13th brings global selloff in stocks and gold as AI fear grips markets
[8] Rivian shares jump 14.6% after earnings beat adds $2.5bn to valuation
[9] Applied Materials Inc (AMAT) Shares Up 9.04% on Feb 13
[10] Pinterest Stock Tariff Shock Exposes Retail Ad Dependence
[11] Stock Market Today: Stocks Post Worst Week of 2026 as Tech Jitters
Insights are generated using AI models and historical data for informational purposes only. They do not constitute investment advice or recommendations. Past performance is not indicative of future results.
About us: Ginlix AI is the AI Investment Copilot powered by real data, bridging advanced AI with professional financial databases to provide verifiable, truth-based answers. Please use the chat box below to ask any financial question.