Weekly Recap: February 9-13, 2026 - Market Volatility and Defensive Rotation
Unlock More Features
Login to access AI-powered analysis, deep research reports and more advanced features
About us: Ginlix AI is the AI Investment Copilot powered by real data, bridging advanced AI with professional financial databases to provide verifiable, truth-based answers. Please use the chat box below to ask any financial question.
Related Stocks
The week of February 9-13, 2026 delivered heightened volatility across US equity markets, characterized by a pronounced rotation from growth-oriented technology stocks toward defensive sectors. While the major indices posted weekly declines, the Dow Jones Industrial Average maintained its newly achieved 50,000 milestone, and Friday’s session witnessed a significant breadth improvement suggesting underlying market resilience.
The S&P 500 declined 1.43% to close at 6,835.08, the Nasdaq Composite fell 2.98% to 22,546.67, and the Dow Jones Industrial Average slipped 1.39% to 49,438.88. The Russell 2000, despite a strong Friday performance that saw it surge 3.2%, ended the week down 1.57%. The technology sector suffered the most, declining 0.69%, while utilities emerged as the top performer with a 3.55% weekly gain [0].
Key market drivers this week included cooling January inflation data, stronger-than-expected labor market conditions, and evolving Federal Reserve policy expectations. The VIX spiked 18.8% week-over-week to 20.62, reflecting elevated investor uncertainty heading into the weekend [0].
The trading week of February 9-13, 2026 encompassed five trading days that saw significant volatility concentrated in the middle of the week, followed by a notable Friday reversal. All major US indices posted negative weekly returns, though the magnitude of declines varied considerably across indices.
| Index | Week Open | Week Close | Weekly Change | Daily Volatility |
|---|---|---|---|---|
S&P 500 |
6,964.81 | 6,835.08 | -1.43% | 0.68% |
Dow Jones |
50,135.88 | 49,438.88 | -1.39% | 0.56% |
Nasdaq Composite |
23,238.67 | 22,546.67 | -2.98% | 1.01% |
Russell 2000 |
2,689.05 | 2,646.70 | -1.57% | 1.02% |
The Nasdaq Composite experienced the steepest weekly decline at 2.98%, reflecting the technology sector’s underperformance during the week. The index dropped 2.36% on Thursday, February 12, alone, its worst single-day performance during the week. The small-cap Russell 2000, while posting a weekly decline of 1.57%, demonstrated remarkable resilience on Friday, surging 3.2% and outperforming all major indices on the final trading day of the week [0].
The week’s price action followed a distinctive pattern: modest gains on Monday, followed by three consecutive days of declines, culminating in a stabilization and modest recovery on Friday.
- Monday, February 9:Opened at 6,917.26, closed at 6,964.81 (+0.69%) - Markets opened the week with modest gains
- Tuesday, February 10:Closed at 6,941.82 (-0.47%) - Slight pullback as investors digested early week momentum
- Wednesday, February 11:Closed at 6,941.46 (-0.50%) - Continued consolidation with minimal change
- Thursday, February 12:Closed at 6,832.77 (-1.79%) - Sharp selloff driven by tech sector weakness, highest volume day at 7.12B shares
- Friday, February 13:Closed at 6,835.08 (+0.01%) - Stabilization with minimal change as markets found support
The Thursday selloff represented the most significant market-moving event of the week, with technology stocks bearing the brunt of the decline. The elevated trading volume of 7.12 billion shares on that day—26% above the weekly average—indicated substantial institutional participation in the selloff [0].
The week’s sector performance revealed a clear pattern of defensive rotation, with traditionally safer sectors outperforming while growth and technology-oriented sectors lagged significantly.
| Rank | Sector | Weekly Change | Status |
|---|---|---|---|
| 1 | Utilities |
+3.55% | Outperformer |
| 2 | Energy |
+1.60% | Outperformer |
| 3 | Basic Materials |
+1.55% | Outperformer |
| 4 | Consumer Defensive |
+1.43% | Outperformer |
| 5 | Healthcare |
+1.33% | Outperformer |
| 6 | Communication Services |
+0.98% | Outperformer |
| 7 | Financial Services |
+0.97% | Outperformer |
| 8 | Industrials |
+0.48% | Outperformer |
| 9 | Consumer Cyclical |
+0.30% | Outperformer |
| 10 | Real Estate |
+0.09% | Flat |
| 11 | Technology |
-0.69% | Underperformer |
The defensive rotation theme dominated market dynamics throughout the week. Utilities emerged as the clear leader, gaining 3.55% as investors sought safety in traditionally defensive sectors amid uncertainty about the economic outlook and Federal Reserve policy trajectory. Energy and Basic Materials also posted strong gains, each adding more than 1.5% for the week [0].
The technology sector’s 0.69% decline marked it as the worst-performing sector, reflecting ongoing concerns about artificial intelligence valuations and capital expenditure requirements. This marked a continuation of the sector’s weakness that has persisted over recent weeks, with AI-focused companies particularly hard hit.
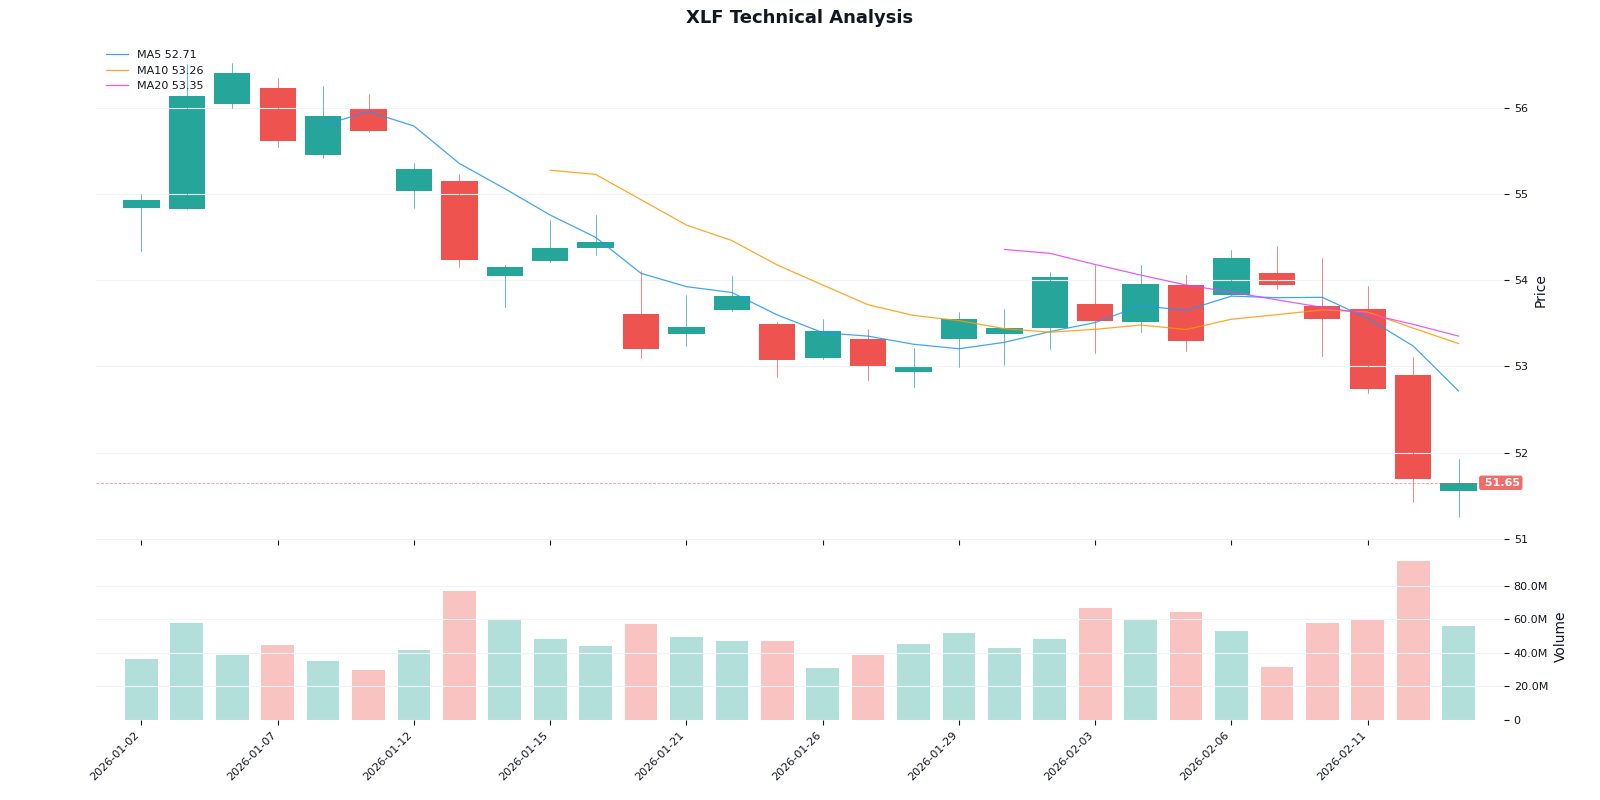
The financial services sector, despite posting a 0.97% weekly gain, showed technical weakness with a confirmed breakdown pattern. The Financial Select Sector SPDR (XLF) generated a sell signal on February 10, with its next target at $50.39. The sector’s relative underperformance despite the weekly gain reflects the mixed nature of the rotation—investors favored the most defensive segments while reducing exposure to more cyclical areas [0].
The week’s most notable individual stock movements centered on the mega-cap technology companies, with Apple experiencing the most significant decline among the Magnificent Seven cohort.
The catalyst for Apple’s decline appeared to be broader concerns about technology sector valuations rather than company-specific news. The stock’s decline mirrored broader market sentiment toward AI-exposed companies, as investors reassessed the risk-reward profile of high-growth technology stocks.
- Microsoft (MSFT):-2.97% for the week
- Alphabet (GOOGL):-5.74% for the week
- Amazon (AMZN):-4.76% for the week
- Meta Platforms (META):-5.53% for the week
- Tesla (TSLA):Essentially flat (+0.03%), showing relative resilience
Tesla’s relative stability contrasted with the broader technology sector weakness. The stock’s ability to maintain its value while peers declined suggests continued investor conviction in the company’s growth prospects, though the stock experienced significant volatility during the week, dropping 3.07% on Thursday before recovering 0.76% on Friday [0].
While the technology sector struggled, several stocks posted significant gains during the week:
- Coinbase (COIN):+16.46% on Friday, February 13—marking the strongest single-day gain among major movers
- Procter & Gamble (PG):+1.74% for the week, reflecting defensive sector strength
- Constellation Brands (STZ):-8.04% on Friday, February 13
- C.H. Robinson (CHRW):Fell approximately 15% over two days due to AI-automation concerns
- JPMorgan Chase (JPM):-6.11% for the week
The week’s economic data releases provided mixed signals for Federal Reserve policy expectations. January’s Consumer Price Index (CPI) data came in at 2.4% year-over-year, below the 2.5% consensus estimate and representing the lowest inflation reading since mid-2025. This cooling inflation data initially sparked optimism that the Federal Reserve might maintain its accommodative stance [1].
However, the stronger-than-expected Non-Farm Payrolls report complicated the picture. The economy added 130,000 jobs in January, substantially beating the consensus estimate of 70,000 and representing the strongest monthly job gain of 2025. This robust labor market data tempered expectations for immediate rate cuts, with Federal Reserve futures now pricing in a rate cut for July rather than June [1].
The probability of a March rate cut rose from 40% to over 75% following the CPI data release, before retreating as the implications of the strong employment data became clear. This shifting expectation created significant volatility throughout the week as investors adjusted their positioning. The Federal Reserve’s preferred inflation gauge—Personal Consumption Expenditures (PCE)—will be released on Friday of the upcoming week, providing the next major data point for policy expectations [1].
The DXY US Dollar Index strengthened to around 97.30-98 during the week, supported by both the cooling inflation data and solid employment figures. A stronger dollar typically pressures international revenue-heavy companies and can create headwinds for commodity prices, including gold, which fell below $5,000 per ounce during the cross-asset liquidation [1].
The technology sector’s weakness this week reflected broader market concerns about artificial intelligence valuations and capital expenditure requirements. Companies heavily invested in AI infrastructure faced particular pressure as investors questioned the return on investment for massive capital spending programs.
This theme manifested across multiple technology subsectors, with semiconductor companies, cloud computing providers, and software companies all experiencing pressure. The concern appears to be twofold: first, that AI infrastructure investments may not generate returns commensurate with the capital deployed, and second, that competitive pressures may compress margins as more players enter the AI space [1].
The rotation toward defensive sectors that has characterized much of 2026 intensified this week. Utilities, consumer staples, healthcare, and other traditionally defensive sectors attracted inflows as investors reduced exposure to more cyclical growth areas. This rotation typically intensifies during periods of economic uncertainty, and the combination of Fed policy uncertainty, elevated valuations in the technology sector, and geopolitical risks created a backdrop favorable to defensive positioning [1].
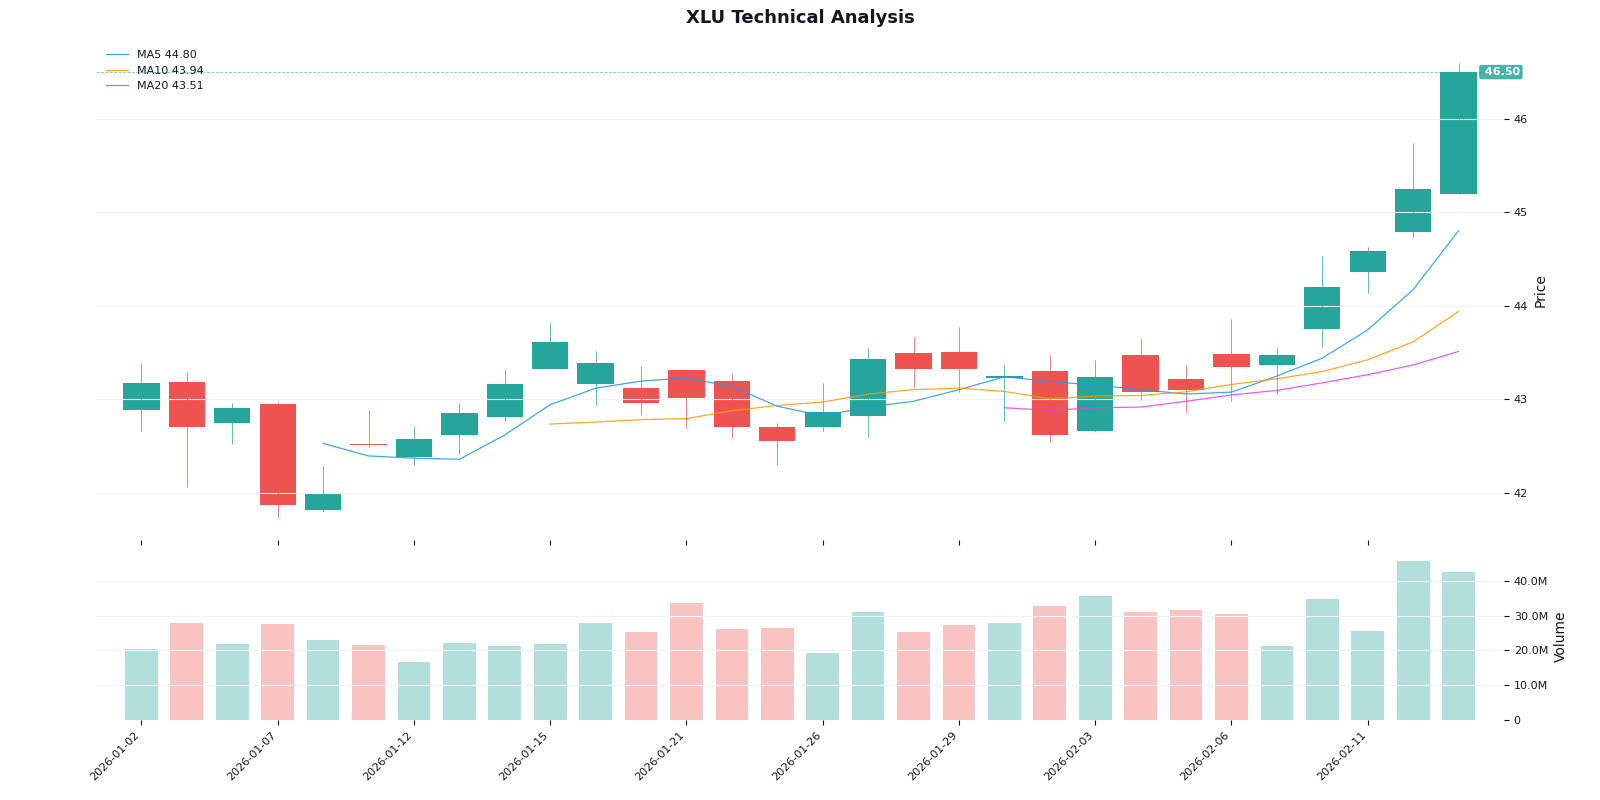
The technical analysis confirms this rotation pattern, with the Utilities Select Sector SPDR (XLU) showing a confirmed uptrend with a buy signal generated on February 6. The sector’s trend score of 4.0 indicates strong momentum, with the next technical target at $47.37. Consumer Staples (XLP) and Healthcare (XLV) also show stable technicals despite being in sideways patterns, with Healthcare showing the healthiest KDJ readings among defensive sectors—bullish K values (61.4) above D values (55.1) with RSI in normal range [0].
The energy sector’s 1.60% weekly gain represents a more nuanced rotation—while typically considered defensive, energy’s performance is closely tied to geopolitical developments and inflation expectations. Oil prices tested the $62 per barrel support level during the week amid ongoing geopolitical tensions and US dollar strength [1].
Geopolitical concerns continued to influence market sentiment throughout the week. Tensions surrounding US-China relations over Taiwan, the Russia-Ukraine conflict approaching its anniversary, and ongoing Middle East developments all contributed to investor uncertainty. These geopolitical risk factors typically favor defensive positioning and contribute to elevated volatility readings [1].
The cross-asset liquidation observed during the week—gold falling below $5,000 per ounce and Bitcoin declining to around $69,700—reflected a broader risk-off sentiment that typically accompanies geopolitical uncertainty. The VIX’s spike on Thursday coincided with this cross-asset selloff, suggesting that margin calls and deleveraging in other markets may have contributed to equity market pressure [1].
The CBOE Volatility Index (VIX) spiked significantly during the week, rising 18.8% from 17.36 at the start of the week to 20.62 at the close on Friday. The most dramatic move occurred on Thursday, February 12, when the VIX surged 19.38%—its largest single-day increase during the week—corresponding with the peak of the technology sector selloff. The VIX high of 22.40 on February 13 represented elevated but not extreme volatility levels [0].
| Date | VIX Close | Daily Change |
|---|---|---|
| February 9 | 17.36 | -3.29% |
| February 10 | 17.79 | +1.83% |
| February 11 | 17.65 | -1.23% |
| February 12 | 20.82 | +19.38% |
| February 13 | 20.62 | -4.00% |
The elevated VIX level of 20.62 suggests elevated options premiums and increased hedging activity among institutional market participants. While the VIX remains below levels typically associated with market crises—typically above 30—its spike on Thursday indicated significant short-term risk aversion. The partial retreat on Friday suggests the market may be finding a short-term bottom in volatility [0].
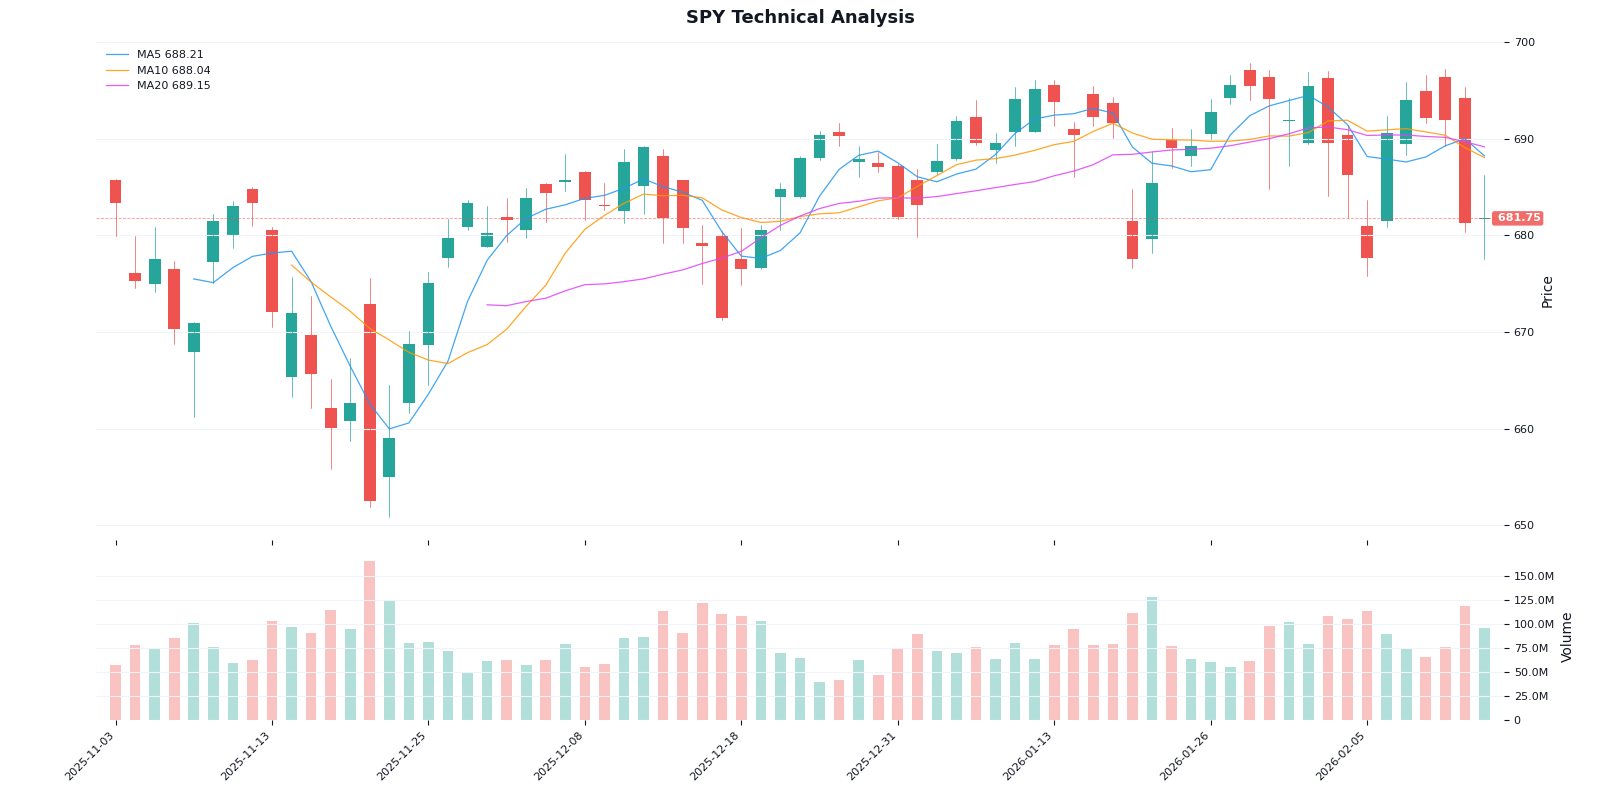
- Trend: Sideways (no clear direction)
- Support: $677.63
- Resistance: $689.15
- MACD Signal: Bearish (no crossover)
- KDJ: Bearish (K:45.6, D:55.0, J:26.7)
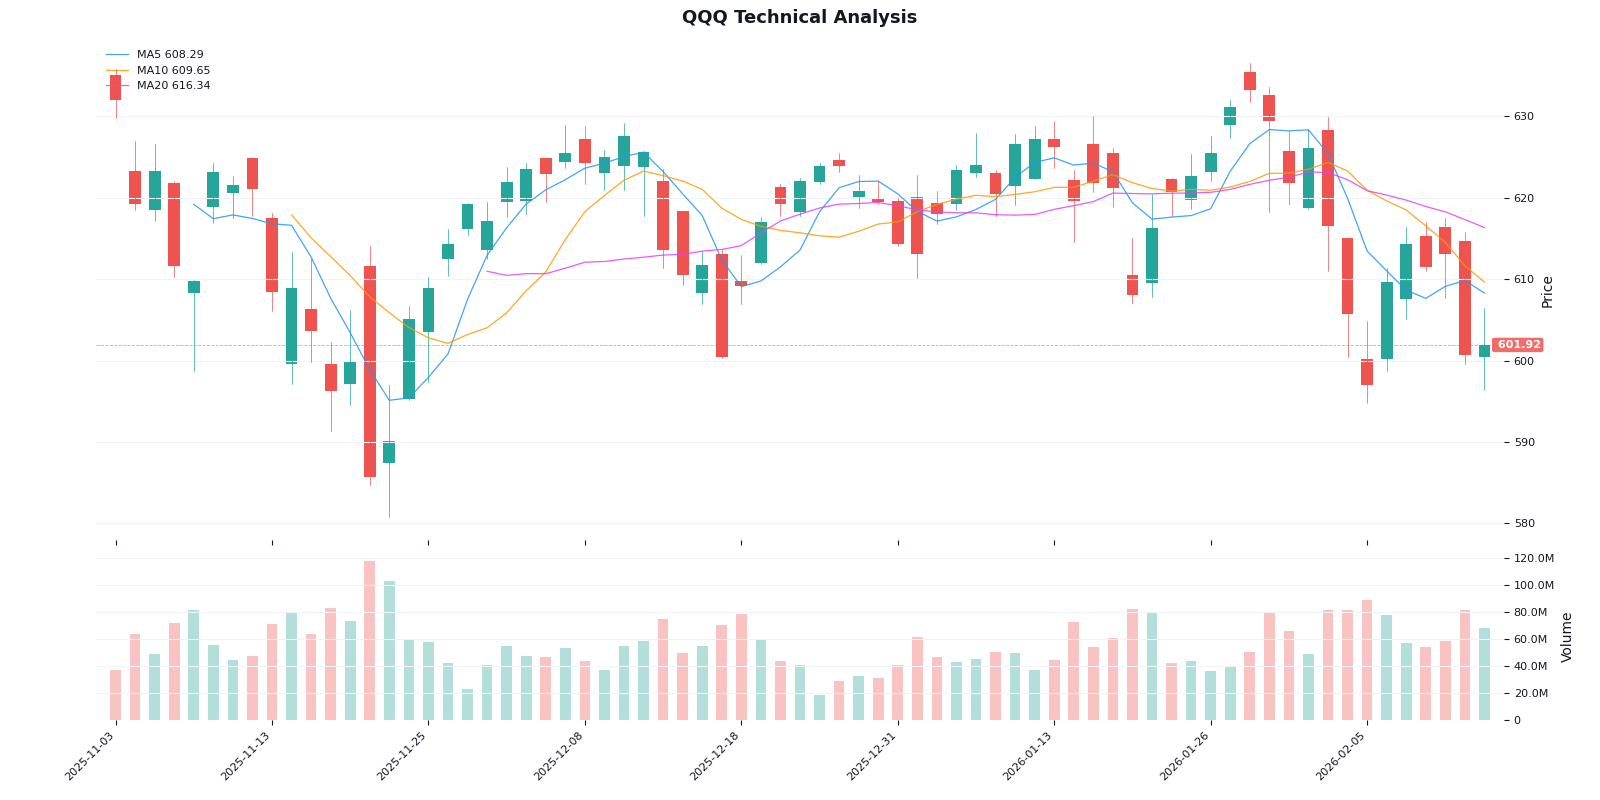
- Trend: Sideways with bearish bias
- Support: $596.73
- Resistance: $616.34
- MACD Signal: Bearish (no crossover)
- KDJ: Bearish (K:29.6, D:35.4, J:18.0)
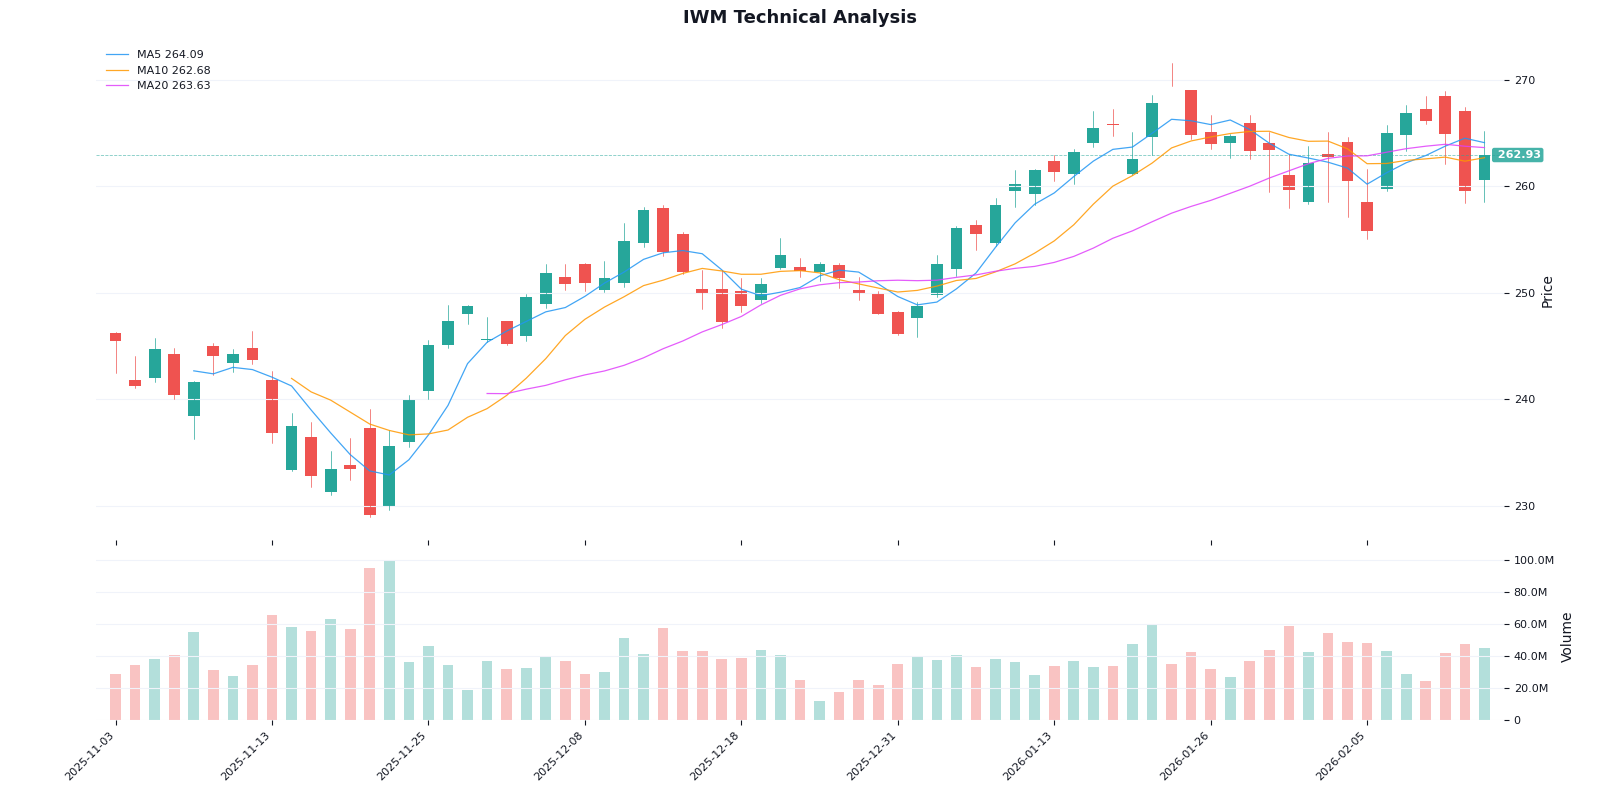
- Trend: Sideways with relative strength
- Support: $260.26
- Resistance: $265.60
- KDJ: Neutral (K:56.7, D:57.0, J:56.0)
A notable positive development on Friday was the significant improvement in market breadth. The NYSE recorded its strongest advance-decline ratio since August, indicating that the market recovery was broad-based rather than concentrated in a narrow group of stocks. This breadth improvement suggests underlying market resilience despite the week’s overall negative performance [1].
The S&P 500 posted its best single-day gain since May on Friday, February 10, with a 2% advance that helped stabilize markets after the midweek selloff. The Russell 2000’s 3.2% surge on Friday was particularly noteworthy, indicating that small-cap stocks—the segment most sensitive to economic conditions—were attracting buyer interest. The small-cap rally is significant because it historically precedes broader market recoveries, as small-caps tend to lead economic expansions [1].
The divergence between large-cap technology weakness and small-cap strength on Friday represents an important market dynamic to monitor. If small-caps continue to outperform, it could signal growing confidence in the economic outlook despite Fed policy uncertainty.
| Sector ETF | Current Price | Trend | Signal |
|---|---|---|---|
| XLK (Technology) | $139.57 | Sideways | Neutral |
| XLF (Financials) | $51.65 | Downtrend |
Sell |
| XLE (Energy) | $54.34 | Sideways | Neutral |
| XLU (Utilities) | $46.50 | Uptrend |
Buy |
| XLP (Consumer Staples) | $89.50 | Sideways | Neutral |
| XLV (Healthcare) | $157.67 | Sideways | Neutral |
The technical analysis identifies Utilities (XLU) as the only major sector in a confirmed uptrend with a buy signal, while Financials (XLF) has generated a breakdown sell signal. This technical configuration aligns with the broader defensive rotation theme evident in price action [0].
Trading volume this week followed the market’s volatility pattern, with the highest volume occurring on Thursday’s selloff day and notably lower volume on Friday as markets stabilized.
| Index | Weekly Total | Peak Day |
|---|---|---|
S&P 500 |
27.40 billion shares | Thursday (7.12B) |
Nasdaq |
41.91 billion shares | Wednesday (9.93B) |
Dow Jones |
2.94 billion shares | Thursday (0.77B) |
Thursday, February 12, represented the peak of selling pressure with S&P 500 volume reaching 7.12 billion shares—26% above the weekly average. This elevated volume coincided with the technology sector’s sharpest decline and the VIX’s largest single-day spike [0].
Friday’s reduced volume—S&P 500 trading only 2.85 billion shares—reflects typical pre-weekend positioning behavior, where traders reduce exposure ahead of potential weekend news events. This lower volume can sometimes lead to exaggerated moves on the following Monday as pent-up trading interest is released.
Technology mega-caps continued to attract substantial trading interest:
- Nvidia (NVDA):825.70 million shares for the week
- Apple (AAPL):261.23 million shares, with spike to 81.08 million on February 12
- Tesla (TSLA):288.79 million shares
- Amazon (AMZN):373.64 million shares
The elevated volume in these stocks reflects continued investor focus on the technology sector despite its underperformance [0].
Several risk factors could influence market direction heading into next week:
-
Geopolitical Developments:Weekend news on US-China tensions, Russia-Ukraine developments, or Middle East situations could impact market sentiment. Geopolitical risks typically increase volatility in the early trading week as markets react to unexpected developments [1].
-
Federal Reserve Speaker Comments:Any weekend commentary from Federal Reserve officials could shift rate cut expectations and impact bond yields and equity valuations.
-
Earnings Pre-Announcements:Companies that typically pre-announce earnings before official report dates could provide negative surprises that impact sector performance.
The upcoming week contains several significant economic events that could provide market direction:
- No major US economic releases due to Presidents Day market closure
- FOMC Meeting Minutes:The release of the Federal Reserve’s latest meeting minutes will provide insight into the central bank’s thinking on rate policy. Investors will scrutinize discussions around inflation, employment, and the economic outlook for clues about the timing of potential rate cuts [1].
- PCE Inflation Data:The Personal Consumption Expenditures (PCE) index represents the Federal Reserve’s preferred inflation gauge. This release will be critical in shaping expectations for monetary policy. Any surprise in either direction could trigger significant market movement [1].
- Presidents Day market closure on Monday will reduce liquidity and potentially amplify early-week volatility
- China markets partially closed for Lunar New Year celebrations throughout the week, reducing Asian market participation [1]
Heading into the weekend, the technical and fundamental landscape suggests the following positioning considerations:
- Utilities in confirmed uptrend with next target at $47.37
- Healthcare showing healthy technicals with bullish KDJ crossover
- Consumer Staples near resistance but maintaining bullish MACD
- Technology sector showing bearish bias with AI valuation concerns persisting
- Financials in confirmed downtrend with breakdown signal on February 10
- Nasdaq-100 facing resistance at $616.34 with bearish momentum
- Support: $677.63 (critical level to watch for further weakness)
- Resistance: $689.15 (breakout level for bullish momentum)
- Current range: Trading in consolidation between support and resistance
- A break below $677.63 would suggest further downside, while a break above $689.15 could lead to test of all-time highs
- Support: $596.73 (critical support level)
- Resistance: $616.34 (key technical barrier)
- Underperformance relative to SPY indicates growth sector weakness
- The J-line at 18.0 on KDJ suggests oversold conditions may develop, potentially leading to a technical bounce
- Support: $260.26
- Resistance: $265.60
- Friday’s strong relative performance suggests potential for continued small-cap strength
- Current price: $51.65 (downtrend confirmed)
- Support: $51.25
- Next downside target: $50.39
- RSI indicating oversold conditions could lead to short-term bounce, but overall trend remains bearish
The week of February 9-13, 2026 demonstrated the market’s ongoing adjustment to evolving economic and monetary policy expectations. Key conclusions from this week’s analysis include:
-
Defensive Rotation Intensifies:The rotation toward defensive sectors—utilities, consumer staples, healthcare—reflects investor concerns about economic uncertainty and Fed policy trajectory. This rotation is technically confirmed, with utilities in a confirmed uptrend. The sector’s 3.55% weekly gain represents the strongest performance among all S&P 500 sectors.
-
Technology Sector Under Pressure:AI valuation concerns continue to weigh on the technology sector, with mega-cap stocks experiencing significant declines. Apple dropped 6.86% for the week—its worst weekly performance—while Nvidia, Google, Amazon, and Meta all posted declines exceeding 3%. The sector’s technical weakness is confirmed by MACD and KDJ indicators.
-
Friday Breadth Improvement:The strong advance-decline ratio on Friday suggests underlying market resilience. The Russell 2000’s 3.2% surge indicates that small-cap stocks—sensitive to economic conditions—may be finding support. This breadth improvement is a constructive development.
-
Inflation Data Mixed:While January CPI cooled to 2.4%, the stronger-than-expected employment data (130K vs 70K consensus) complicates the Fed’s rate cut timeline. Markets now price in a July rate cut rather than June, with the upcoming PCE inflation data likely to refine expectations.
-
Technical Consolidation:Major indices are trading in sideways patterns, with SPY between $677.63 support and $689.15 resistance. The market awaits catalysts—FOMC minutes Wednesday and PCE inflation data Friday—to provide directional bias.
The most likely scenario is continued consolidation with defensive sector outperformance, as the market digests mixed economic signals and awaits clearer Fed policy guidance. The Presidents Day market closure on Monday will reduce liquidity and potentially amplify early-week moves.
[0] Ginlix Quantitative Database - Market data, technical indicators, and sector performance metrics
[1] Investors see hope in the economy despite AI fears igniting a turbulent week for markets
[2] Inflation Relief Halts Market Bloodletting: S&P 500 and Dow Hold Firm as Tech Slump Persists
[3] Small Caps Roar: Russell 2000 Surges as Cooling Inflation Ignites Rate Cut Hopes
Insights are generated using AI models and historical data for informational purposes only. They do not constitute investment advice or recommendations. Past performance is not indicative of future results.
About us: Ginlix AI is the AI Investment Copilot powered by real data, bridging advanced AI with professional financial databases to provide verifiable, truth-based answers. Please use the chat box below to ask any financial question.