Markets Weekly Outlook: Central Banks Signal End to Rate Cut Era
Unlock More Features
Login to access AI-powered analysis, deep research reports and more advanced features
About us: Ginlix AI is the AI Investment Copilot powered by real data, bridging advanced AI with professional financial databases to provide verifiable, truth-based answers. Please use the chat box below to ask any financial question.
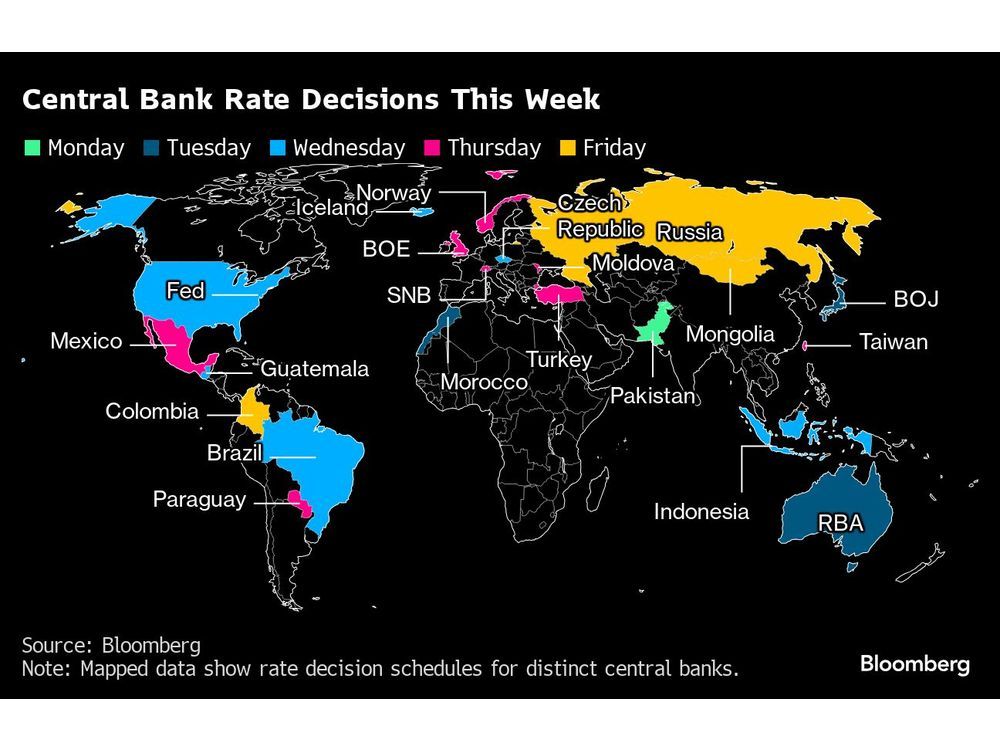
The week of March 17-21, 2026, marked a decisive regime change in global monetary policy, with major central banks collectively signaling an end to the rate-cut cycle that markets had anticipated throughout 2025 [1]. This “central bank super week” saw eight rate decisions from major economies, with the Federal Reserve, European Central Bank, Bank of England, and Bank of Japan all holding rates steady while delivering hawkish forward guidance [1][2][3].
The Federal Reserve’s March 18 decision to maintain the federal funds rate at 3.5%-3.75% and project only one rate cut in 2026—unchanged from December projections—caught markets off guard [1][2]. Chair Jerome Powell emphasized that the economy is “doing pretty well” despite elevated inflation, with January core PCE reaching 3.1% and the end-2026 inflation forecast raised to 2.7% [1][12]. This hawkish stance, combined with the US-Iran conflict creating unprecedented energy supply disruptions, fundamentally altered the investment landscape.
Equity markets responded sharply to this policy pivot, with all major indices posting significant weekly losses [0]. The S&P 500 declined 3.10%, the NASDAQ fell 3.70%, and the Russell 2000 dropped 3.24%—the latter reflecting particular sensitivity among small-cap stocks to higher-for-longer rate expectations [0]. Trading volumes surged, with NASDAQ volume reaching 10.50 billion shares on March 20 alone, indicating substantial portfolio rebalancing [0].
The sector breakdown on March 20 revealed pronounced defensive rotations, with all 11 S&P 500 sectors declining [0]. Utilities suffered the most severe losses at -7.36%, as the surge in bond yields eliminated the yield differential that had attracted investors to rate-sensitive dividend stocks [0]. Energy emerged as the relative best performer at -0.08%, reflecting its ability to pass through inflation costs in a supply-constrained environment [0]. Technology declined 2.03%, vulnerable to higher discount rates compressing growth stock valuations [0].
Gold experienced its most significant weekly decline in six years, with spot gold falling 4.3% on March 19 to $4,612.21/oz and futures plummeting 5.9% [8][9]. Silver declined 5.4% with futures down 8.7% [9]. This precious metals sell-off reflects the confluence of reduced speculative interest following hawkish central bank communications, profit-taking after record levels, and a stronger dollar supported by rate differentials [8][10].
The geopolitical backdrop has significantly complicated the policy picture. The US-Iran conflict has caused the effective closure of the Strait of Hormuz, through which approximately 20% of global oil passes [5][6][7]. The International Energy Agency characterized this as “the largest supply disruption in the history of the global oil market” [7]. The Dallas Fed projects WTI oil could reach $98/barrel if the closure persists, with global GDP growth potentially declining by 2.9 percentage points in Q2 2026 [13]. On March 20, the US temporarily lifted sanctions on Iranian oil until April 19, 2026, allowing approximately 140 million barrels to enter the market [14].
The ECB held rates at 3.75% but President Christine Lagarde predicted 2026 inflation at 2.6%, noting that the Middle East conflict would push average headline inflation higher [3][4]. Slovak Governor Peter Kažimír indicated “a reaction by the ECB is potentially closer than many people think” [4]. The BoE held steady but hinted at future hikes, while the BoJ maintained its divergent ultra-low rate policy [3].
The convergence of hawkish central bank policy, geopolitical conflict, and energy supply disruption creates an environment reminiscent of 1973 (oil embargo) and 2022 (Ukraine conflict) periods. The key insight is that central banks have prioritized inflation control over growth support, effectively ending the rate-cut anticipation that had characterized much of 2025.
The equity market decline represents more than a typical correction—it signals a fundamental repricing of risk assets as the “higher-for-longer” narrative reasserts itself. The severity of utility sector losses (-7.36%) indicates that the yield chase that had driven defensive equity positioning is unwinding rapidly.
The gold sell-off is particularly significant as it marks a shift in safe-haven psychology. Traditionally, geopolitical instability and inflation concerns support gold prices; however, the combination of hawkish monetary policy and dollar strength has overwhelmed these traditionally supportive factors.
The lifting of Iran oil sanctions on March 20 introduces a new variable in supply-demand calculations [14]. If sustained beyond April 19, this could moderate oil prices and potentially provide central banks more flexibility. However, the conflict trajectory remains highly uncertain, keeping energy prices as the critical variable for near-term inflation outlook.
The geopolitical risk remains paramount, with the US-Iran conflict showing no immediate resolution and the Strait of Hormuz closure persisting [5][6][7]. This represents the largest supply disruption in modern oil market history and could sustain elevated energy prices.
Inflation risk continues to run above target, with January core PCE at 3.1% versus the 2.0% target, and Fed projections showing 2.7% inflation by year-end [1][12]. Energy price shocks from the conflict are feeding into broader price pressures.
Policy uncertainty has increased with Fed Chair Powell’s indication that he would remain until successor Kevin Warsh is confirmed, amid ongoing DOJ investigation [12]. The potential leadership transition introduces uncertainty regarding future policy continuity.
Market valuation risk is elevated as equity markets have declined over 3% on the week, bond yields are rising, and gold’s biggest weekly loss in six years suggests broad de-risking behavior [8].
Energy and defensive sectors have demonstrated relative strength in the current environment, with energy falling only 0.08% compared to broader market declines [0].
Financial services showed the second-best relative performance at -0.48%, potentially benefiting from net interest margin dynamics in a higher-rate environment [0].
Consumer defensive stocks outperformed rate-sensitive sectors at -0.85%, reflecting their defensive characteristics in uncertain economic conditions [0].
This “central bank super week” represents a fundamental regime change in monetary policy expectations. Major central banks have collectively signaled that the anticipated rate cut cycle in 2026 has effectively ended, with the Fed projecting only one cut and potentially none if inflation persists.
Market performance data [0] shows:
- S&P 500: 6,506.49 (weekly change: -3.10%)
- NASDAQ: 21,647.61 (weekly change: -3.70%)
- Dow Jones: 45,577.48 (weekly change: -2.78%)
- Russell 2000: 2,438.45 (weekly change: -3.24%)
Sector performance [0] demonstrates pronounced rotation away from rate-sensitive areas, with utilities declining 7.36% while energy declined only 0.08%.
Gold’s 4.3% decline on March 19 represents its biggest weekly loss in six years [8], reflecting the shift in market sentiment toward rate-supporting assets.
The US-Iran conflict and Strait of Hormuz closure represent a 20% reduction in global oil supply [5][6][7], with the IEA characterizing this as the largest supply disruption in global oil market history [7]. The US response of temporarily lifting Iran oil sanctions until April 19, 2026 [14], provides a potential near-term supply relief valve.
Central bank rationale centers on persistent inflation above targets—the Fed’s 2.7% year-end forecast and ECB’s 2.6% 2026 projection both exceed the 2.0% objective [1][3]. The geopolitical shock from the Iran conflict has complicated the policy path, forcing central banks to maintain restrictive stances despite growth concerns.
Insights are generated using AI models and historical data for informational purposes only. They do not constitute investment advice or recommendations. Past performance is not indicative of future results.
About us: Ginlix AI is the AI Investment Copilot powered by real data, bridging advanced AI with professional financial databases to provide verifiable, truth-based answers. Please use the chat box below to ask any financial question.