Updated US Mega-Cap Tech Net Income & Market Cap Analysis (2025)
Unlock More Features
Login to access AI-powered analysis, deep research reports and more advanced features
About us: Ginlix AI is the AI Investment Copilot powered by real data, bridging advanced AI with professional financial databases to provide verifiable, truth-based answers. Please use the chat box below to ask any financial question.
Related Stocks
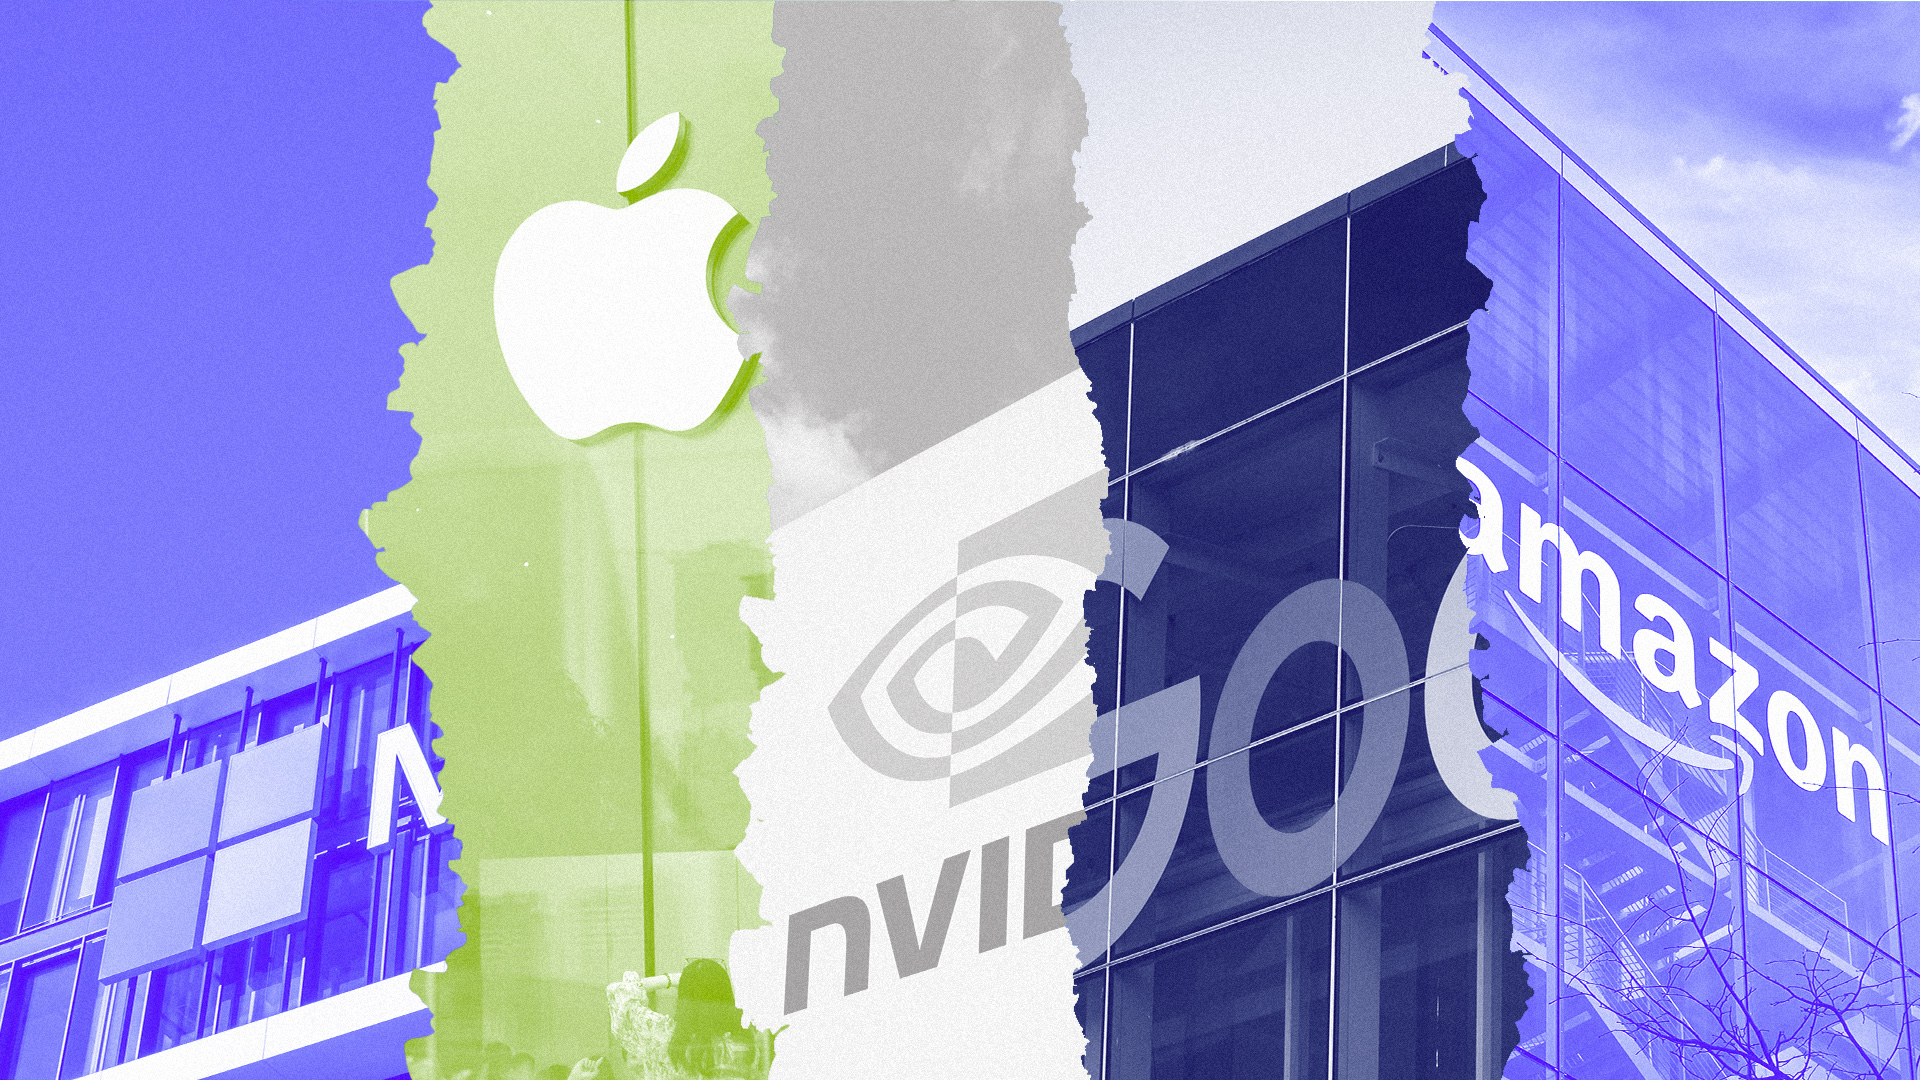
On November 21, 2025 (EST), a Reddit post titled “Updated US mega cap tech net income comparisons” presented revised profitability metrics for leading US tech companies [1]. Key findings included:
- Broadcom (AVGO) overtook Meta Platforms (META) for sixth position in market capitalization among US mega-cap tech firms
- The analysis used consistent y-axis scales for fair comparison and sourced data from Macrotrends and StockAnalysis
- The update followed NVIDIA’s (NVDA) latest earnings report, providing fresh context on relative profitability across the sector
The 1-day price movements of affected companies (as of November 21, 2025) reflect mixed market reactions:
- Alphabet (GOOGL): +4.14% (strongest gain among mega-caps) [0]
- Apple (AAPL): +2.15% [0]
- Amazon (AMZN): +1.81% [0]
- Meta (META): +1.14% [0]
- NVIDIA (NVDA): +0.21% [0]
- Broadcom (AVGO): -1.16% (slight decline despite market cap leadership over META) [0]
- Microsoft (MSFT): -0.75% [0]
Notably, GOOGL’s strong performance aligns with its exceptional 3-month gain of +50.90% [0], while META’s 1-month decline of -18.74% likely contributed to its market cap drop below AVGO [0].
- NVIDIA (NVDA): $4.41T [0]
- Apple (AAPL): $4.02T [0]
- Alphabet (GOOGL): $3.64T [0]
- Microsoft (MSFT): $3.53T [0]
- Amazon (AMZN): $2.36T [0]
- Broadcom (AVGO): $1.61T [0]
- Meta (META): $1.50T [0]
- Alphabet (GOOGL): ~$32.99B (Revenue: $102.35B × Margin:32.23%)
- NVIDIA (NVDA): ~$30.22B (Revenue:$57.01B × Margin:53.01%)
- Microsoft (MSFT): ~$27.74B (Revenue:$77.67B × Margin:35.71%)
- Apple (AAPL): ~$27.59B (Revenue:$102.47B × Margin:26.92%)
- Amazon (AMZN): ~$19.93B (Revenue:$180.17B × Margin:11.06%)
- Meta (META): ~$15.83B (Revenue:$51.24B × Margin:30.89%)
- Broadcom (AVGO): ~$5.04B (Revenue:$15.95B × Margin:31.59%)
| Metric | NVDA | MSFT | GOOGL | AVGO | META | AAPL | AMZN |
|---|---|---|---|---|---|---|---|
| P/E Ratio | 44.44x | 33.65x | 29.32x | 85.30x | 25.63x | 36.29x | 30.84x |
| Net Profit Margin | 53.01% | 35.71% | 32.23% | 31.59% | 30.89% | 26.92% | 11.06% |
- Full-year net income data to confirm long-term profitability trends (current estimates based on single quarter)
- Verification of the Reddit post’s data sources (Macrotrends and StockAnalysis) for accuracy
- Understanding of specific factors driving AVGO’s high valuation despite lower net income than META
- Valuation vs Profitability: AVGO trades at a 3.3x higher P/E ratio than META (85.30x vs25.63x) while generating 3x lower net income, indicating significant market optimism about its future growth prospects [0]
- Profitability Leaders: NVIDIA maintains industry-leading net profit margins (53.01%) driven by AI chip demand [0]
- Performance Trends: GOOGL’s exceptional 6-month gain of +78.83% reflects strong market confidence in its AI initiatives [0]
- Valuation Risk: Users should be aware that AVGO’s high valuation multiple (P/E ratio of85.30x) relative to peers may significantly impact its future price performance if earnings do not meet market expectations [0]
- Performance Concerns: This development raises concerns about META’s recent 1-month decline of18.74% that warrant careful consideration for investors holding the stock [0]
- Market Cap Volatility: Historical patterns suggest that market cap rankings among mega-cap tech firms can shift rapidly, requiring ongoing monitoring [0]
- Upcoming earnings reports for AVGO and META to assess valuation alignment with fundamentals
- AI demand trends impacting NVIDIA and Broadcom’s revenue growth
- Regulatory developments affecting large tech companies
- Shifts in investor sentiment toward high-valuation vs high-profitability stocks
Insights are generated using AI models and historical data for informational purposes only. They do not constitute investment advice or recommendations. Past performance is not indicative of future results.
About us: Ginlix AI is the AI Investment Copilot powered by real data, bridging advanced AI with professional financial databases to provide verifiable, truth-based answers. Please use the chat box below to ask any financial question.