Eli Lilly $1 Trillion Market Cap Analysis: Drivers, Risks, and Competitive Landscape
Unlock More Features
Login to access AI-powered analysis, deep research reports and more advanced features
About us: Ginlix AI is the AI Investment Copilot powered by real data, bridging advanced AI with professional financial databases to provide verifiable, truth-based answers. Please use the chat box below to ask any financial question.
Related Stocks
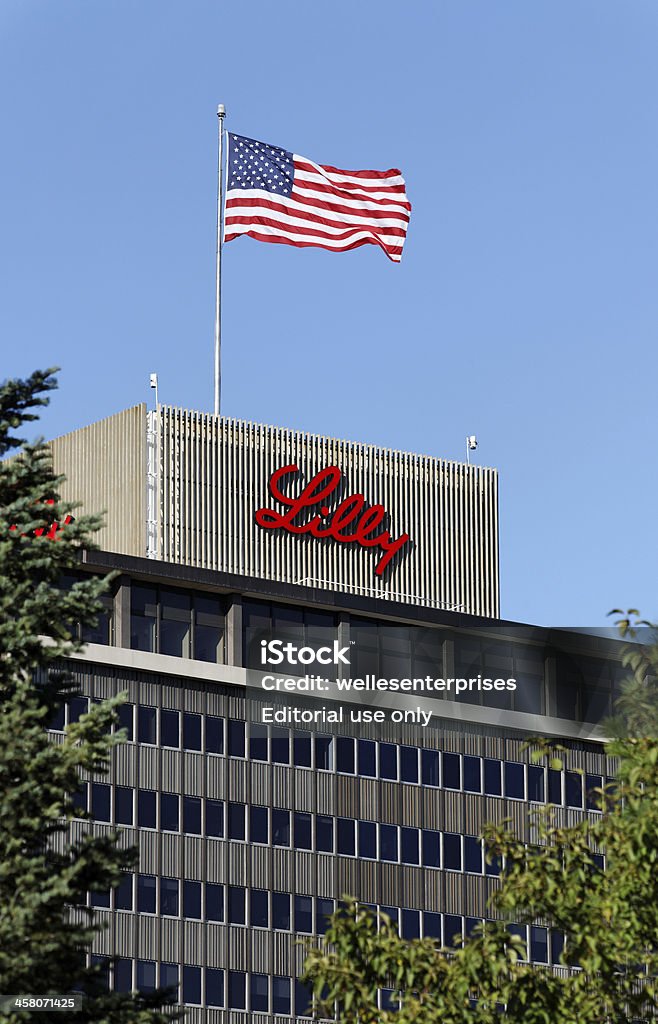
Eli Lilly (LLY) achieved a temporary $1 trillion market cap on November 22, 2025, marking a milestone as the first healthcare company to reach this valuation [5]. The surge is fueled by robust demand for its GLP-1 receptor agonist drugs: Zepbound (weight loss) and Mounjaro (diabetes) [2]. Additionally, an upcoming oral drug Orforglipron—expected to receive FDA approval by March 2026—has boosted investor sentiment due to its potential to expand market access [4].
LLY’s stock performance has outpaced peers: up 30.44% month-over-month and +36.20% year-to-date, while competitor Novo Nordisk (NVO) declined -10.77% monthly and -45.58% year-to-date [1][3]. Trading volume for LLY exceeded its average (4.14M vs.3.81M) on the event date, indicating strong investor interest [0].
- Valuation Disparity: LLY’s P/E ratio of ~51.62x is significantly higher than NVO’s ~12.20x, raising concerns about overvaluation [2][3].
- Pipeline Optimism: Orforglipron’s phase III results (up to17.5% weight loss in24 weeks) and expected approval are key growth drivers [4].
- Consensus Caution: Despite bullish market sentiment,70.5% of analysts rate LLY as “Buy” but the consensus price target ($948) is ~10.5% below current levels [2].
- High valuation relative to peers [2][3]
- Regulatory delays for pipeline drugs (Orforglipron/Retatrutide) [4]
- Competitive pressure from NVO [3]
- Potential correction if growth expectations aren’t met [2]
- Expanding access via government agreements [4][5]
- Market leadership in GLP-1 drugs [2]
- Upside from new drug launches [4]
LLY’s $1 trillion market cap milestone reflects strong demand for its metabolic disease drugs and pipeline optimism. However, investors should note the valuation gap with competitors and analyst caution. Key metrics:
- LLY: Market cap ~$951.91B, P/E ~51.62x [0][2]
- NVO: Market cap ~$211.72B, P/E ~12.20x [3]
This summary provides objective context for decision-making without prescriptive recommendations.
Insights are generated using AI models and historical data for informational purposes only. They do not constitute investment advice or recommendations. Past performance is not indicative of future results.
About us: Ginlix AI is the AI Investment Copilot powered by real data, bridging advanced AI with professional financial databases to provide verifiable, truth-based answers. Please use the chat box below to ask any financial question.